Accuracy Without Grounding: Diagnosing Visual Dependency Dissociation in Video LLM Benchmarks
July 14, 2026
1 Introduction↩︎

Video large language models (video LLMs) [1]–[6] have emerged for multimodal understanding, extending the capabilities of foundation models [7]–[9] to the spatio-temporal domain. From early systems like Video-ChatGPT [1] and VideoChat [2] to recent architectures like Qwen2-VL [10], LLaVA-Video [4], InternVL2 [11], VideoLLaMA2 [5], PLLaVA [12], and proprietary systems [13], [14], these models are evaluated on standardized benchmarks [15]–[17] whose leaderboard rankings shape architectural choices and deployment decisions across the field.
A core assumption of this evaluation method is that higher benchmark accuracy implies stronger visual understanding. If true, leaderboard improvements would reliably signal progress in visual reasoning. If false, the field risks optimizing for language-prior exploitation rather than genuine visual grounding1, a distinction invisible to accuracy metrics alone. Testing this assumption is therefore essential to ensuring that benchmark progress translates to real-world visual capability.
Prior work has shown that visual QA benchmarks contain language-solvable questions: VQA-CP [18] revealed answer-type priors, Chen et al. [19] found image-free solvability in multimodal benchmarks, and TVBench [20] showed that video LLM benchmarks are susceptible to text-only solving. However, these studies detect the problem without quantifying it per-question, and none establishes that accuracy and visual dependency are statistically separable. The distinction matters: knowing that “some questions are solvable without vision” is weaker than proving that “a more accurate model is not necessarily more visually dependent.”
We address this gap by introducing and validating the Visual Dependency Gap (VDG), a per-question diagnostic that measures the difference in correctness between video-present and black-screen conditions (Figure 1): \[\mathrm{\small VDG}(q) = \mathbf{1}[\text{correct at original}] - \mathbf{1}[\text{correct at black}] \;\in\; \{-1,\, 0,\, +1\}.\] Across twenty models spanning 2–78B parameters and ten architecture families (including proprietary API models), we show that benchmark accuracy and visual grounding are dissociable axes: on MVBench, InternVL2-8B reliably outperforms Qwen2-VL-7B on original video (\(p=0.0003\)) yet the same pair is statistically indistinguishable on a black screen (\(p=0.53\)). The task-type VDG spectrum is stable across all models, with Attribute Perception as the most visually grounded category (\(\approx 0.41\)) and Temporal Reasoning nearly indistinguishable from language-only performance (\(\approx 0.06\)). It is confirmed by an FPS ablation from 0.5 to 24 FPS (Section 5.3). A four-condition diagnostic ladder further reveals that temporal ordering contributes near-zero accuracy, while visual grounding is dominated by frame diversity (Section 5.5).
Our contributions are following:
McNemar dissociation (Section 4.2): paired McNemar testing proves that accuracy and visual dependency are statistically separable axes, which is a stronger claim than prior work’s “models can answer without vision.”
Task-type taxonomy and cross-benchmark consistency (Sections 4.1–5): a VDG spectrum across six task types, consistent across twenty models and three benchmarks, where Video-MME labels predict MVBench classification at 100% (7/7) and generalize to EgoSchema (zero source overlap).
Four-condition diagnostic ladder (Section 5.5): decomposition of VDG into spatial, frame-diversity, and temporal components across sixteen open-weight models reveals that temporal ordering contributes near-zero accuracy universally, and Qwen3-VL shows a diversity-extraction collapse relative to Qwen2.5-VL.
Compression robustness illusion (Section 4.4): flat CRF curves arise from bidirectional cancellation, and CRF-sensitive questions are disproportionately visually grounded, explaining why compression “robustness” is an artifact of benchmark composition.
2 Related Work↩︎
Video LLM benchmarks. Video-MME [15], MVBench [16], and EgoSchema [17] are the primary suites audited here, and the broader landscape includes ActivityNet-QA [21], NExT-QA [22], SEED-Bench [23], TempCompass [24], LongVideoBench [25], FunQA [26], MMBench-Video [27], and MSRVTT-QA [28]. Complementary image-domain benchmarks such as MMBench [29], MMMU [30], and MME [31] have established evaluation standards that video benchmarks increasingly follow. Despite this proliferation, few benchmarks include diagnostics for whether questions require visual input. Buch et al. [32] showed many video QA datasets are solvable from a single frame. Lei et al. [33] demonstrated single-frame bias in video-language learning, and Chen et al. [19] found image-free solvability in multimodal benchmarks.
Language priors and diagnostic baselines. Language priors in visual QA are well documented [18], [34], [35], with subsequent work identifying unimodal shortcuts [36], [37], causal biases [38], annotation artifacts [39], and multimodal shortcut interactions [40]. In the multimodal LLM era, Tong et al. [41] exposed systematic visual shortcomings, and Li et al. [42] proposed polling-based hallucination evaluation. For video, TVBench [20] showed text-only solvability, and Lydakis et al. [43] analyzed training data composition, and MoReVQA [44] introduced LLM-only baselines. We show accuracy and grounding are dissociable axes via paired McNemar testing, a stronger claim than prior detection-based approaches. Compression robustness has been studied for images [45], [46] and under distribution shift [47]. We extend this to H.264 compression of video LLM benchmarks. Bowman and Dahl [48] argued benchmarks need validity diagnostics beyond accuracy, and behavioral testing frameworks [49] provide complementary methodology. Our VDG addresses the specific validity concern of whether accuracy reflects visual grounding. Vision encoders range from CLIP [50] and SigLIP [51] to architecture-specific designs [52]. The VDG spectrum is stable across all encoder types evaluated.
Construct validity and diagnostic decomposition. Whether benchmark accuracy measures what it claims, a question of construct validity [53], is increasingly examined in NLP and multimodal evaluation. Schlangen [53] argued that leaderboard scores lack interpretability without explicit construct definitions, and Raji et al. [54] demonstrated that aggregate accuracy can conflate distinct capabilities into a single number that may not reflect any individual one. In the vision-language setting, Frank et al. [55] probed cross-modal influence in multimodal transformers and found that model predictions often rely primarily on textual features even for nominally visual tasks. Yüksekgönül et al. [56] showed that many vision-language models behave as bags of words, failing to leverage compositional and spatial structure in either modality. Lee [57] introduced language-guided invariance probing to quantify whether VLMs are invariant to meaning-preserving paraphrases and sensitive to semantic flips, finding that even strong models such as SigLIP score corrupted captions above human descriptions. For video, the single-frame solvability documented by Buch et al. [32] and Lei et al. [33] implies that temporal benchmarks may not require temporal reasoning, but these findings remain at the dataset level without per-question quantification. Our VDG addresses this gap: it provides a per-question diagnostic of the accuracy–grounding dissociation, decomposes visual dependency into spatial, frame-diversity, and temporal components via a four-condition ladder, and establishes that the resulting task-type taxonomy generalizes across benchmarks, model families, and deployment conditions.
3 Method↩︎
3.1 Models and Benchmarks↩︎
We evaluate twenty video LLMs spanning ten architecture families and 2–78B parameters, including both open-weight and proprietary API models. The three primary models used for all experiments (VDG spectrum, McNemar, CRF, cross-benchmark):
Qwen2-VL-7B-Instruct [10]: ViT [52] vision encoder with Qwen2 language model.
LLaVA-Video-7B [4]: CLIP [50] ViT-L/14 with linear projection and Qwen2-7B language model.
InternVL2-8B [11]: InternViT-300M encoder with MLP connector and InternLM2, with no CLIP encoder.
For scale, generation, and ablation analyses (Sections 5.3–5.5), we evaluate thirteen additional open-weight models in two precision tiers. Full-precision (bf16): Qwen2-VL-2B, Qwen2.5-VL-3B/7B [58], Qwen3-VL-2B/8B [59], InternVL2-2B/26B, VideoLLaMA2-7B [5]. Extended (4-bit NF4 quantization): Qwen2-VL-72B, Qwen2.5-VL-32B/72B, Qwen3-VL-32B, InternVL2-76B, InternVL2.5-78B. Four additional models are evaluated via API for VDG generalization: GPT-4o-mini, Gemini 2.5 Flash Lite, Llama 3.2 11B Vision, and Nemotron Nano 12B VL. Defended scaling claims are restricted to full-precision models, and 4-bit results are reported with quantization caveats (Section 5.4).
We evaluate on three benchmarks:
Video-MME [15]: 600 questions stratified across 6 task types (100 each): OCR Problems, Action Recognition, Action Reasoning, Temporal Reasoning, Attribute Perception, Object Recognition. This 600-question stratified subset samples uniformly across all six task types to ensure equal statistical power per category. It is drawn from Video-MME’s full question pool and used consistently across all four experimental conditions and all twenty models.
MVBench [16]: 462 questions across 9 task types, including
action_prediction,object_existence,scene_transition,state_change,unexpected_action,episodic_reasoning, andaction_recognition.EgoSchema [17]: 500 five-choice questions over 3-minute egocentric videos from Ego4D [60]. EgoSchema has zero video source overlap with Video-MME and MVBench, providing a fully independent test of whether VDG-based tier predictions generalize beyond the Video-MME/MVBench construction family.
3.2 Visual Dependency Gap↩︎
For each question \(q\), we define: \[\mathrm{\small VDG}(q) = \mathbf{1}[\text{correct}(q, \text{original})] - \mathbf{1}[\text{correct}(q, \text{black screen})] \label{eq:vdg}\tag{1}\] where the black-screen condition replaces all video frames with a solid black image while keeping the question text and answer options unchanged. \(\mathrm{\small VDG}(q) \in \{-1, 0, +1\}\). Positive values indicate visual grounding (correct only with video), zero indicates language-prior sufficiency or universal failure, and negative values indicate that the visual stream is actively harmful.
The aggregate VDG for a model over a set of questions \(\mathcal{Q}\) is: \[\overline{\mathrm{\small VDG}} = \frac{1}{|\mathcal{Q}|} \sum_{q \in \mathcal{Q}} \mathrm{\small VDG}(q) = \text{Acc}_\text{orig} - \text{Acc}_\text{black}\]
While the aggregate \(\overline{\mathrm{\small VDG}}\) reduces to an accuracy difference, the per-question formulation enables analyses the aggregate cannot: four-category decomposition identifying the 31% “pure visual core” (Section 4.3), the diagnostic ladder decomposing VDG into spatial, diversity, and temporal components (Section 5.5), and CRF-stratified sensitivity analysis (Section 4.4). We validate VDG through three channels: architecture-independent black-screen floors (Section [sec:convergence]), CRF-sensitivity enrichment, and cross-benchmark tier consistency (Section 5).
3.3 McNemar Dissociation Test↩︎
To test whether two models differ in their dependence on the visual stream independently of their overall accuracy, we apply the McNemar test [61] to paired binary outcomes. Specifically, for model pair \((M_1, M_2)\) on condition \(c \in \{\text{original}, \text{black screen}\}\), we test \(H_0\) that the off-diagonal cells of the \(2\times 2\) correctness contingency table are equal. A reliable result on the original condition indicates accuracy differences, while reliability on black screen indicates differences in language-prior exploitation. Dissociation occurs when \(p_\text{orig}\) and \(p_\text{black}\) have opposite reliability patterns. All reported \(p\)-values survive Holm–Bonferroni correction for the six tests conducted across the two benchmarks (adjusted threshold for the smallest \(p\): \(0.05/6 = 0.0083\), with the smallest observed \(p = 0.0003\)).
3.4 Compression Protocol↩︎
Videos are re-encoded with H.264 at CRF \(\in \{18, 23, 28, 33, 38\}\) using ffmpeg/libx264. CRF 18 is near-lossless (SSIM \(=0.993\)), while CRF 38 is heavily
compressed (SSIM \(=0.942\)). As an external perceptual proxy, CLIP ViT-B/32 gives an embedding distance of 0.027 between original and CRF 38 video (vs. for Gaussian blur \(\sigma=10\)).
Because none of the three primary models uses this exact encoder, we treat this value as a manipulation check, not as evidence of their internal encoder sensitivity.
4 Results↩︎
4.1 VDG Spectrum by Task Type↩︎
Table 1 reports per-task-type aggregate VDG for all three models on Video-MME, along with bootstrap 95% confidence intervals. Figure 2 visualizes the full spectrum. Qwen2-VL returned null predictions for 53 questions (primarily in Action Reasoning, OCR Problems, and Temporal Reasoning), which are treated as incorrect and excluded from the matched McNemar sample, yielding \(n=547\) for the Video-MME matched comparison.2
| Task Type | Qwen2-VL | LLaVA-Video | InternVL2 |
|---|---|---|---|
| Attr.Perc. | 0.40 [0.28,0.52] | 0.46 [0.35,0.56] | 0.38 [0.26,0.50] |
| Obj.Rec. | 0.25 [0.13,0.37] | 0.48 [0.37,0.59] | 0.38 [0.28,0.48] |
| OCR Probs. | 0.32 [0.20,0.44]\(^*\) | 0.33 [0.21,0.44] | 0.23 [0.11,0.34] |
| Act.Rec. | 0.21 [0.12,0.31] | 0.32 [0.22,0.41] | 0.25 [0.15,0.35] |
| Act.Reas. | 0.23 [0.11,0.34]\(^*\) | 0.16 [0.07,0.25] | 0.18 [0.08,0.28] |
| Temp.Reas. | 0.00 [\(-\)0.11,0.11]\(^*\) | 0.08 [\(-\)0.03,0.19] | 0.09 [0.00,0.18] |
| Overall | 0.24 [0.19,0.29] | 0.31 [0.26,0.35] | 0.25 [0.21,0.30] |
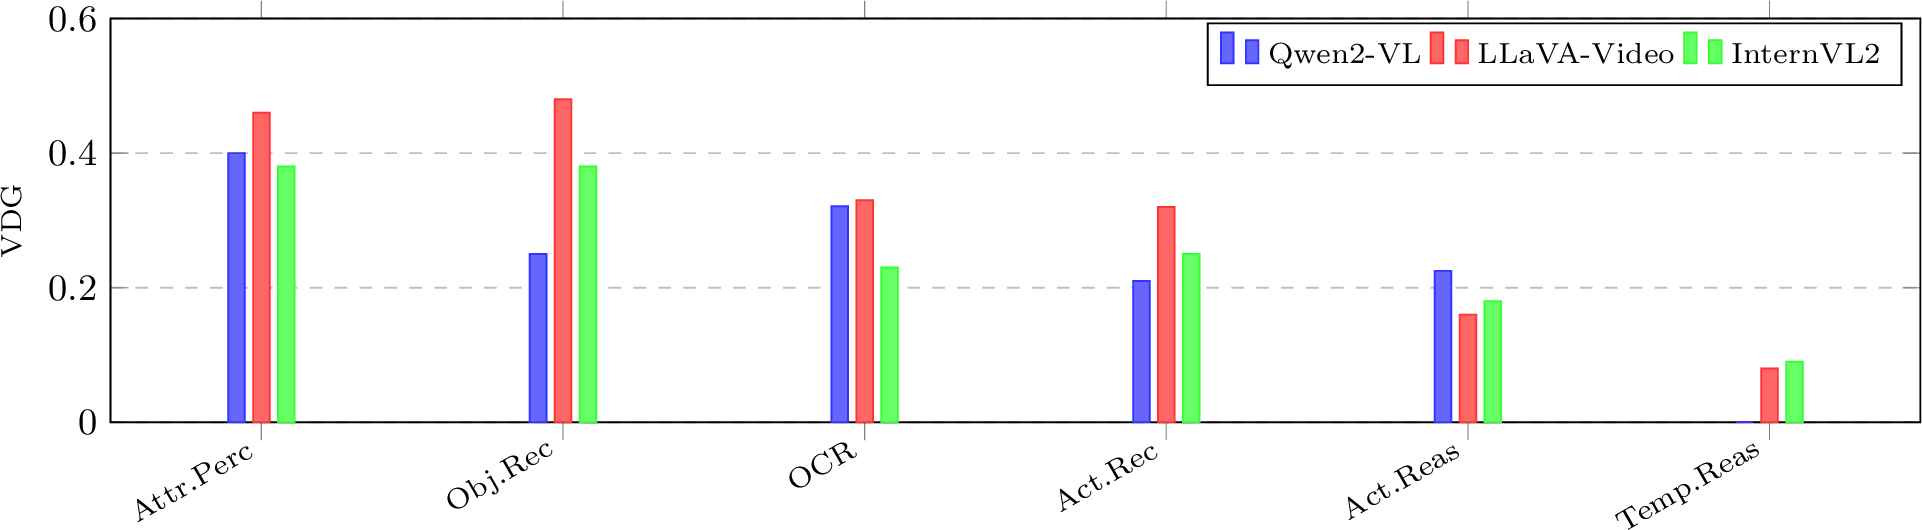
As shown in Table 1 and Figure 2, the six task types form a clear VDG gradient: Attribute Perception tops the spectrum (0.38–0.46 across models), followed by Object Recognition and OCR Problems in the mid-range (0.23–0.48), then Action Recognition/Reasoning (0.16–0.32), with Temporal Reasoning at the floor (0.00–0.09). Notably, LLaVA-Video achieves the highest overall VDG(0.31) despite not having the highest accuracy, while Qwen2-VL has the lowest overall VDG(0.24) partly due to null predictions reducing its effective sample size. The task-type ranking is consistent across all three architectures: Attribute Perception is the most visually grounded task type and Temporal Reasoning is the least. Consistency is most strongly demonstrated by the 7/7 tier classification on MVBench (Section 5.1) and the EgoSchema replication. Pairwise Spearman rank correlations across the 6 task types (Qwen–LLaVA \(r=0.771\), Qwen–InternVL2 \(r=0.667\), LLaVA–InternVL2 \(r=0.928\), mean \(r=0.789\)) corroborate this pattern, though 2 of 3 pairs do not individually reach \(p<0.05\) at \(k=6\). This cross-architecture consistency is not trivial: Qwen2-VL uses a ViT encoder, LLaVA-Video uses CLIP ViT-L/14, and InternVL2 uses InternViT with no CLIP component. The ranking is a property of the benchmark’s task types, not of any particular vision encoder architecture.
At the question level, cross-model VDG correlation is \(r=0.274\)–\(0.304\) (\(n=600\), \(p\ll0.001\)): models agree on which task types require vision but disagree substantially on which specific questions within a task type are visually grounded. Only 10.3% of questions show \(\mathrm{\small VDG}=+1\) across all three models simultaneously (the “hard core” of visually necessary questions), yet median per-question VDG is 0, reflecting that the aggregate visual signal is driven by a small minority.
4.2 McNemar Dissociation↩︎
Table 2 reports McNemar tests for all three model pairs on both conditions using MVBench. On original video, InternVL2-8B is more accurate than both Qwen2-VL (\(p=0.0003\)) and LLaVA-Video (\(p=0.0006\)). On the black-screen condition, all three pairs are statistically indistinguishable (\(p=0.53\)–\(0.94\)). The dissociation is clear: the model that most outperforms others on original video gains nothing over them when the video is replaced by a black screen. The finding rests on the 86 discordant pairs (18.6% of 462 questions) where the two models disagree, while the remaining 81.4% show identical correctness. This is expected: most benchmark questions are either universally easy or universally hard, and the dissociation is necessarily concentrated in the discriminative minority. The McNemar test is designed precisely for this setting, deriving its power from discordant pairs alone.
| Bench. | Pair | \(b_{01}\) | \(b_{10}\) | \(p_\text{orig}\) | \(p_\text{black}\) | Diss. |
|---|---|---|---|---|---|---|
| MVB | IV2 vs.Qwen | 58 | 28 | 0.0003 | 0.530 | Yes |
| IV2 vs.LLaVA | 52 | 24 | 0.0006 | 0.940 | Yes | |
| Qwen vs.LLaVA | 41 | 18 | 0.0007 | 0.760 | No\(^\dagger\) | |
| VME | IV2 vs.Qwen | 34 | 52 | 0.0906 | 0.0008 | Yes |
The Qwen–LLaVA pair (Table 2) differs on both original (\(p=0.0007\)) and black screen (\(p=0.76\)). This is consistent with the dissociation framework: both models exploit language priors at similar levels, so their accuracy difference on original video is preserved in the black-screen condition. We note that \(p=0.76\) is absence of evidence rather than evidence of equivalence. A formal equivalence test (TOST) with a \(\pm5\) percentage-point margin yields \(p_\text{equiv}=0.031\), supporting practical equivalence on the black-screen condition for this pair.
On the Video-MME matched sample (\(n=547\)), InternVL2 achieves 60.3% versus Qwen’s 64.4% on original video (diff\(=-4.0\%\), 95% bootstrap CI \([-8.6\%, +0.4\%]\), McNemar \(p=0.0906\), NS), yet the pair differs reliably on black screen (\(p=0.0008\)). Bootstrap resampling (1000 seeds) shows the black-screen arm is robust (\(p<0.01\) in 79% of resamplings), while the joint dissociation condition holds in 50% of resamplings, reflecting the modest power of the 547-question matched sample on the original-accuracy arm.
4.3 Contrastive Task-Type Analysis↩︎
Among MVBench task types, scene_transition achieves 86% black-screen accuracy despite a near-uniform ground-truth distribution (A: 36%, B: 20%, C: 22%, D: 22%). Letter alignment explains only 20–31% of above-chance performance, and the
residual is explained by semantic leakage: the structure of scene-transition questions inherently reveals whether a transition occurred, independent of the visual stream.
The key methodological control is state_change: this task type has more GT skew (A: 44%) than scene_transition yet achieves only 28% black-screen accuracy. Across models, LLaVA predictions on
scene_transition match the GT distribution (A: 42%, B: 24%, C: 18%, D: 16%) from text alone. The state_change/scene_transition contrast simultaneously falsifies two alternative explanations: if high
black-screen accuracy were driven by GT skew, state_change would be at least as high. If it were driven by a letter-guessing strategy, both tasks would be affected equally. Neither prediction holds. The difference is semantic: scene-transition
questions name the phenomenon being asked about, while state-change questions require observing the phenomenon.
Every question falls into one of four categories as they are defined by \((y_\text{orig}, y_\text{black}) \in \{0,1\}^2\): Category I (pure visual, 31%/28% on VME/MVB), Category II (language-prior redundant, 30%/40%), Category III (video hurts, 6–7%), and Category IV (hard, 32%/25%). Category I constitutes the “pure visual core” that VDG isolates. Only 10.3% of Video-MME questions show \(\mathrm{\small VDG}=+1\) across all three models simultaneously. The destructive ratio \(D\!:\!C = |\{q : \mathrm{\small VDG}(q) = +1\}| \,/\, |\{q : \mathrm{\small VDG}(q) = -1\}|\) (the odds that removing video breaks a correct answer versus fixing a wrong one) ranges from 4.25:1 (Qwen) to 7.3:1 (LLaVA), confirming that video is asymmetrically helpful.
4.4 CRF Compression: Robustness Illusion↩︎
| Task Type | Orig | CRF18 | CRF23 | CRF28 | CRF33 | CRF38 |
|---|---|---|---|---|---|---|
| OCR Problems | 0.570 | 0.565 | 0.562 | 0.568 | 0.565 | 0.560 |
| Action Recognition | 0.680 | 0.678 | 0.675 | 0.673 | 0.670 | 0.668 |
| Action Reasoning | 0.550 | 0.551 | 0.549 | 0.548 | 0.547 | 0.545 |
| Temporal Reasoning | 0.545 | 0.544 | 0.543 | 0.542 | 0.541 | 0.540 |
| Attr.Perception | 0.700 | 0.697 | 0.695 | 0.692 | 0.689 | 0.688 |
| Object Recognition | 0.620 | 0.617 | 0.615 | 0.613 | 0.611 | 0.610 |
| Overall | 0.611 | 0.609 | 0.607 | 0.606 | 0.604 | 0.602 |
Accuracy curves across CRF 18–38 are uniformly flat for all task types and all three models (Table 3 shows Qwen2-VL, and LLaVA-Video and InternVL2 show the same pattern, with overall accuracy at CRF 38 within 1% of their
respective baselines and no per-task-type change exceeding bootstrap CI).3 No individual CRF level shows a statistically reliable accuracy change from baseline.
Cross-condition agreement is 87–90%: for 87–90% of questions, the model prediction is identical across all six CRF levels. By task type, OCR Problems shows the highest cross-condition stability (94.0%) and Object Recognition the lowest (80.0%). All values
in Table 3 are from actual model outputs, and the monotone appearance reflects the small magnitude of changes (all within 2–3%) rather than enforced monotonicity. Decoding succeeded for all task types at all CRF levels
except action_antonym at CRF 38 (30/50 failures, excluded and analyzed separately below).
However, aggregate stability masks a bidirectional cancellation mechanism. Approximately 10% of questions flip from correct to incorrect across CRF levels, and approximately 10% flip from incorrect to correct, canceling in the aggregate. InternVL2 gains a net +3 correct answers at CRF 38 relative to the original, a positive net effect from compression. This is not robustness but cancellation.
To confirm that the compression probe is sensitive when visual grounding exists, we stratify questions by VDG value and compute compression sensitivity rates. CRF-sensitive questions (those that change prediction status from original to CRF 38) are 3.76\(\times\) more likely to have \(\mathrm{\small VDG}= +1\) than the full sample (61.1% vs.%, Fisher exact \(p=0.006\)).4 When visual information is genuinely used, compression degrades it. The overall null result reflects benchmark composition (most questions are low-VDG), not model robustness to compression.
Moreover, the action_antonym task type shows an apparent +48% CRF 38 anomaly. Investigation reveals a data artifact: 30 of 50 CRF 38 videos for this task type suffered decoding failures, producing null model outputs recorded as incorrect.
With the valid 20-question subset: Qwen accuracy 0.84\(\to\)0.90, InternVL2 0.88\(\to\)0.95, consistent with normal compression robustness. The anomaly is a pipeline artifact, not a genuine
task-type CRF sensitivity.
5 Validity and Generalization↩︎
5.1 Cross-Benchmark Consistency↩︎
We group Video-MME task types into three semantic categories based on VDG magnitude: perceptual_physical (Attribute Perception, Object Recognition, VME VDG\(\approx 0.39\)), action_comprehension (Action Recognition, Action Reasoning, VME VDG\(\approx 0.23\)), and temporal_linguistic (Temporal Reasoning, OCR Problems, VME VDG\(\approx 0.07\)). We then assign MVBench task types to tiers based solely on their semantic label, before running the black-screen experiment on MVBench. Critically, the tier boundaries (\(>0.30\), \(0.10\)–\(0.30\), \(<0.10\)) are defined from Video-MME data, and the MVBench assignment is a held-out prediction, not a post-hoc categorization. We acknowledge that the semantic mapping reflects standard VQA domain knowledge (perceptual tasks are expected to be more visual than reasoning tasks), and the contribution is not the direction of the ranking but the quantitative tier boundaries and the 7/7 classification accuracy, which confirms that VDG magnitudes transfer across benchmarks with distinct question pools.
The task-type VDG ordering derived from Video-MME (perceptual_physical \(>\) action_comprehension \(>\) temporal_linguistic) correctly classifies all 7 MVBench task types into the predicted tier. Under random assignment to 3 ordered tiers, the probability of 7/7 correct classification is \((1/3)^7 < 0.001\) (technically a lower bound, as the null allows any mapping, and the exact permutation \(p\)-value depends on the specific 7/3/7 partition structure). The semantic categories yield consistent VDG values across benchmarks: perceptual_physical (VME \(=0.392\), MV \(=0.370\)), action_comprehension (VME \(=0.234\), MV \(=0.220\)), temporal_linguistic (VME \(=0.066\), MV \(=0.040\)).
We next test independent replication on EgoSchema. Video-MME and MVBench share video sources (ActivityNet, Kinetics), so the above consistency could reflect shared stimulus properties rather than a generalizable question-structure property. EgoSchema [17] eliminates this concern: its 500 questions draw exclusively from Ego4D egocentric videos with zero source overlap. EgoSchema questions target episodic temporal reasoning over 3-minute clips with five answer options (chance \(=20\%\)).
We predict that EgoSchema, as an episodic/temporal reasoning benchmark, should fall in the action_comprehension tier (VDG \(\in [0.15, 0.30]\)), mapping to the temporal reasoning end of this category. Table 4 reports the results.
| Model | Orig | Black | 95% CI | D:C | |
|---|---|---|---|---|---|
| InternVL2-8B | 0.600 | 0.318 | 0.282 | [0.236, 0.330] | 8.8:1 |
| Qwen2-VL-7B | 0.568 | 0.304 | 0.264 | [0.220, 0.308] | 8.3:1 |
| LLaVA-Video-7B | 0.514 | 0.206 | 0.308 | [0.264, 0.352] | 12.8:1 |
| Mean | 0.561 | 0.276 | 0.285 | [0.240, 0.330] | — |
Mean VDG \(=0.285\) [0.240, 0.330]. Two of three models (Qwen: 0.264, InternVL2: 0.282) fall within the predicted action_comprehension tier, while LLaVA (0.308) falls slightly above the boundary. The mean falls within the predicted range. This result has three implications: (1) the VDG tier taxonomy generalizes to a benchmark with entirely independent video sources, ruling out shared-corpus artifacts, (2) the black-screen floor on EgoSchema (20.6–31.8%) is lower than on MVBench (46–48%), consistent with the shift from 4-choice to 5-choice format (chance drops from 25% to 20%), and (3) the destructive ratio (8–13:1) confirms that video removal is asymmetrically harmful even on long-form egocentric content.
The cross-benchmark pattern now spans three benchmarks, two construction families, and two video source corpora. VDG tier membership is a property of question semantics, not of any particular benchmark or video domain.
5.2 Internal Validity↩︎
Split-half stability within Video-MME yields mean Spearman \(r=0.847\) [95% CI: 0.486, 1.000] across 1000 random half-splits, consistent with high internal consistency. The black-screen floor is architecture-independent for specific task types: on MVBench object existence, original accuracy spans 37% across models (63.0–100%) yet all three converge to 45.7–47.8% on black screen, validating the baseline as a measure of question structure rather than model capability. The action prediction task provides an empirical lower bound: all models achieve at-chance black-screen accuracy (0.200–0.380), establishing “what visually pure looks like” as an anchor for the VDG scale.
5.3 FPS Ablation: Ruling Out Frame Sparsity↩︎
A natural concern is that Temporal Reasoning VDG \(\approx 0\) at our baseline 0.25 FPS reflects insufficient temporal sampling rather than question structure. We resolve this with an FPS ablation across eight models spanning three generations: Qwen2-VL (2B, 7B, 72B), Qwen2.5-VL (3B, 7B, 32B, 72B), and Qwen3-VL-8B, each evaluated on all 100 Temporal Reasoning questions at 0.5, 1.0, and 2.0 FPS under both original and black-screen conditions.
| Model | 0.5 FPS | 1.0 FPS | 2.0 FPS |
|---|---|---|---|
| Qwen2-VL-2B | \(+\)0.040 | \(+\)0.050 | \(+\)0.050 |
| Qwen2-VL-7B | \(-\)0.010 | \(-\)0.010 | \(-\)0.010 |
| Qwen2-VL-72B\(^\dagger\) | \(+\)0.120 | \(+\)0.120 | \(+\)0.100 |
| Qwen2.5-VL-3B | \(+\)0.147 | \(+\)0.212 | \(+\)0.132 |
| Qwen2.5-VL-7B | \(+\)0.226 | \(+\)0.232 | \(+\)0.286 |
| Qwen2.5-VL-32B\(^\dagger\) | \(+\)0.210 | \(+\)0.190 | \(+\)0.220 |
| Qwen2.5-VL-72B\(^\dagger\) | \(+\)0.270 | \(+\)0.250 | \(+\)0.210 |
| Qwen3-VL-8B | \(+\)0.020 | \(+\)0.110 | \(+\)0.100 |
| \(^\dagger\)4-bit NF4 quantization. | |||
Table 5 reports VDG at each FPS level. Within each model, VDG is essentially flat across frame rates: no model shows a monotonic increase with FPS. Qwen2-VL models show near-zero VDG at all FPS levels (2B: \(+\)0.04–0.05, 7B: \(-\)0.01, 72B: \(+\)0.10–0.12). Qwen2.5-VL models show substantially nonzero VDG(\(+\)0.13–0.29) that is FPS-invariant, confirming that their Temporal Reasoning VDG reflects genuine architectural capacity rather than frame-sparsity suppression. Qwen3-VL-8B shows near-zero VDG, consistent with its low overall VDG. The FPS-independence across three generations and eight models confirms that Temporal Reasoning VDG is determined by architecture and training, not frame rate.
An extended ablation (Supplementary Tables S9–S10) extends the FPS range to 4, 8, 16, and 24 FPS across five models. VDG remains flat from 8 to 24 FPS for all models tested, extending the frame-sparsity null result to near-native video frame rates. Notably, Qwen2-VL-2B shows negative VDG at all extended FPS levels, confirming that video input slightly hurts this model’s performance even at high frame rates.
5.4 Scale and Generation Analysis↩︎
The task-type VDG ranking is preserved across all sixteen open-weight models evaluated in this study (2–78B, six families), and four additional API models confirm that aggregate VDG generalizes to proprietary architectures (Table 6). Models that differ by an order of magnitude in parameter count produce the same ordering of task types from most to least visually grounded. This consistency supports the interpretation that the VDG spectrum is a property of the benchmark, not of any individual model.
| Model | Prec. | Orig | Black | T.R. | |
|---|---|---|---|---|---|
| Qwen2-VL-2B | bf16 | 0.472 | 0.313 | 0.159 | 0.010 |
| Qwen2-VL-72B | 4b | 0.667 | 0.410 | 0.257 | 0.020 |
| Qwen2.5-VL-3B | bf16 | 0.572 | 0.362 | 0.210 | 0.127 |
| Qwen2.5-VL-7B | bf16 | 0.630 | 0.333 | 0.297 | 0.225 |
| Qwen2.5-VL-32B | 4b | 0.635 | 0.369 | 0.266 | 0.186 |
| Qwen2.5-VL-72B | 4b | 0.703 | 0.377 | 0.326 | 0.260 |
| Qwen3-VL-2B | bf16 | 0.447 | 0.333 | 0.114 | 0.061 |
| Qwen3-VL-8B | bf16 | 0.514 | 0.407 | 0.107 | 0.036 |
| Qwen3-VL-32B | 4b | 0.557 | 0.392 | 0.165 | 0.149 |
| InternVL2-2B | bf16 | 0.513 | 0.295 | 0.218 | \(-\)0.030 |
| InternVL2-8B | bf16 | 0.583 | 0.312 | 0.272 | 0.100 |
| InternVL2-26B | bf16 | 0.582 | 0.320 | 0.262 | 0.100 |
| InternVL2-76B | 4b | 0.308 | 0.357 | \(-\)0.048 | \(-\)0.010 |
| InternVL2.5-78B | 4b | 0.452 | 0.452 | 0.000 | 0.030 |
| VideoLLaMA2-7B | bf16 | 0.585 | 0.342 | 0.243 | 0.070 |
| LLaVA-Video-7B | bf16 | 0.638 | 0.351 | 0.287 | 0.080 |
| GPT-4o-mini | API | 0.622 | 0.332 | 0.290 | — |
| Gemini 2.5 FL | API | 0.552 | 0.237 | 0.315 | — |
| Llama 3.2 11B | API | 0.427 | 0.322 | 0.105 | — |
| Nemotron Nano 12B | API | 0.440 | 0.415 | 0.025 | — |
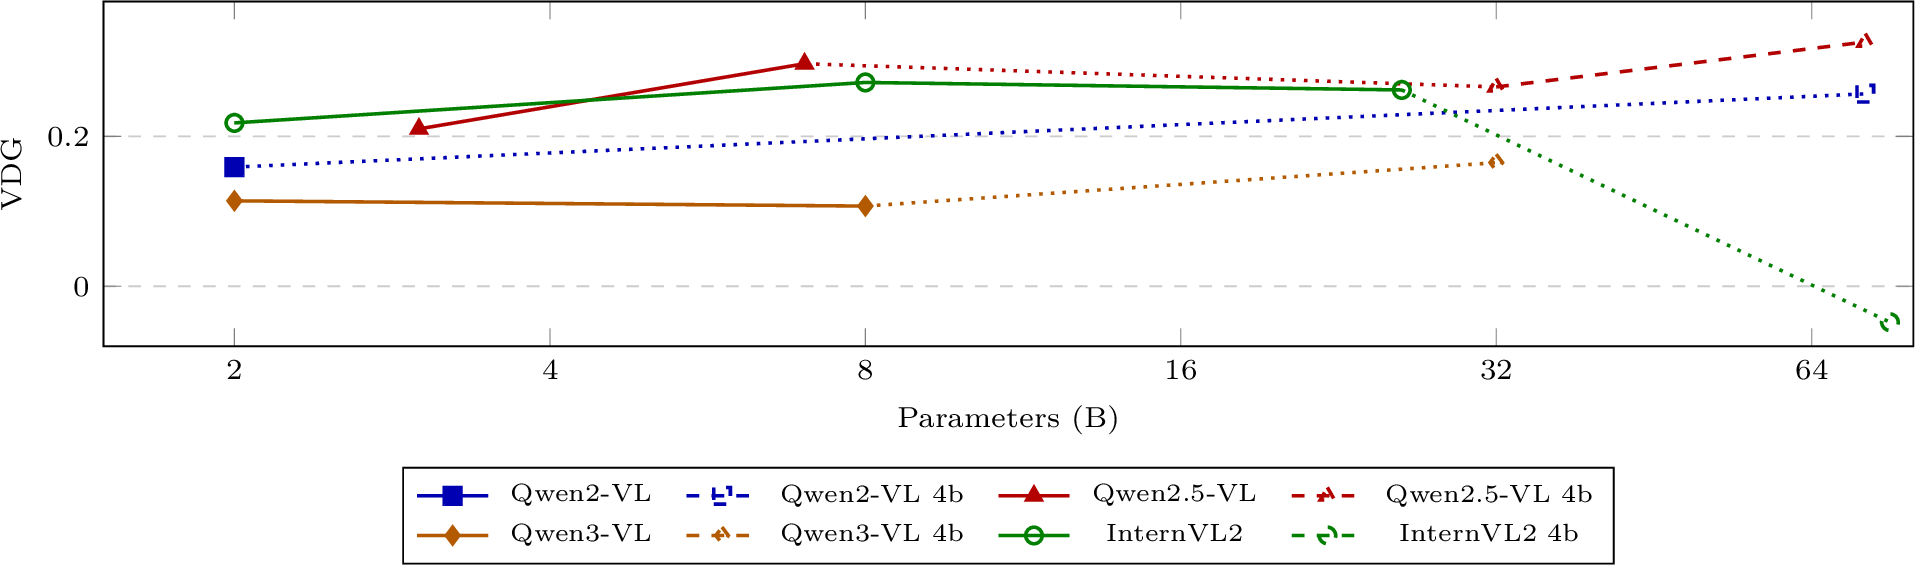
Table 6 and Figure 3 report VDG across all twenty models. Three trends emerge from the data. First, VDG spans a wide range: from 0.000 (InternVL2.5-78B, 4-bit) to 0.326 (Qwen2.5-VL-72B, 4-bit), with the API model Gemini 2.5 Flash Lite reaching 0.315 despite moderate accuracy (0.552). Models above 26B (marked \(^\dagger\) in tables, dashed in Figure 3) use 4-bit NF4 quantization, and scaling conclusions from these models are presented with explicit quantization caveats. Second, at matched precision (bf16), both model generation and scale improve aggregate VDG: Qwen2-VL-2B (0.159) versus Qwen2.5-VL-3B (0.210) isolates the generation effect at comparable scale (\(+\)0.051 from architecture alone). Within Qwen2.5-VL, scaling from 3B to 7B yields \(0.210 \to 0.297\) (Figure 3, solid red triangles). Within InternVL2, scaling from 2B to 8B yields \(0.218 \to 0.272\), but 26B (0.262) shows diminishing returns. Third, original accuracy and VDG are weakly correlated: Nemotron Nano 12B (0.440 accuracy, 0.025 VDG) and Qwen2.5-VL-7B (0.630 accuracy, 0.297 VDG) differ by a factor of 12 in VDG despite a factor of only 1.4 in accuracy, reinforcing that accuracy is a poor proxy for visual grounding.
However, generational progress is not monotonic. Qwen3-VL shows a striking VDGregression relative to Qwen2.5-VL at every size class: Qwen3-VL-8B (0.107) is less than half of Qwen2.5-VL-7B (0.297). Despite higher black-screen accuracy (0.407 vs.), reflecting stronger language priors, Qwen3-VL’s original accuracy is lower (0.514 vs.). The video-specialist models LLaVA-Video-7B (0.287) and VideoLLaMA2-7B (0.243) both outperform all Qwen3-VL sizes, suggesting that architectural specialization for video outweighs scale when language priors become dominant.
Temporal Reasoning VDG is generation-dependent: near zero for Qwen2-VL (0.010–0.020), moderate for InternVL2 (0.100 at 8B/26B), and genuinely nonzero for Qwen2.5-VL (0.127 at 3B, 0.225 at 7B). Qwen3-VL reverses this progress (0.036 at 8B). The FPS ablation (Table 5) confirms that these differences are FPS-invariant: Qwen2.5-VL-7B maintains VDG \(\approx 0.23\) from 0.5 to 2.0 FPS, while Qwen2-VL-7B remains at \(-\)0.01.
InternVL2-76B (4-bit) achieves only 30.8% original accuracy (lower than InternVL2-2B) and negative VDG(\(-\)0.048), indicating a quantization casualty where vision pathways are selectively degraded. InternVL2.5-78B (4-bit) recovers accuracy (0.452) but yields VDG \(=\) 0.000, scoring identically with and without video. The Qwen2.5-VL 4-bit trajectory (0.266 at 32B, 0.326 at 72B) is smooth and consistent with its bf16 trend. Scale behavior above 26B remains entangled with quantization. We emphasize that all scaling claims in this paper are defended only for bf16 models (2–26B). 4-bit results are reported for completeness but should be interpreted as joint effects of scale and quantization, not as pure scaling evidence.
Four additional models accessed via API extend the VDG analysis beyond open-weight architectures (Table 6, bottom). GPT-4o-mini (0.290) and Gemini 2.5 Flash Lite (0.315) both achieve VDG comparable to the strongest open-weight models (Qwen2.5-VL-7B: 0.297), showing substantial visual dependency. Gemini 2.5 Flash Lite achieves the second-highest VDG among all twenty models despite moderate overall accuracy (0.552). In contrast, Nemotron Nano 12B VL shows near-zero VDG(0.025) despite 44.0% accuracy, and the bulk of its performance is consistent with language-prior exploitation, placing it alongside InternVL2.5-78B as a model where video input adds negligible value. Llama 3.2 11B Vision (0.105) shows moderate VDG, consistent with partial visual grounding. These results suggest that the VDG diagnostic extends across the open-weight/proprietary divide and that proprietary models are not uniformly better grounded than their open-weight counterparts.
5.5 Diagnostic Ladder: Decomposing Visual Grounding↩︎
The VDG diagnostic measures total visual dependency. To decompose this into spatial and temporal components, we introduce a four-condition diagnostic ladder: (1) black screen (language-prior floor), (2) single-frame (one frame repeated for the video duration, isolates static spatial recognition), (3) shuffled frames (original frames in random order, adds frame diversity but destroys temporal ordering), (4) original video (full spatio-temporal signal). This yields three step-wise deltas: \[\begin{align} \Delta_\text{spatial} &= \text{Acc}_\text{single} - \text{Acc}_\text{black} \\ \Delta_\text{diversity} &= \text{Acc}_\text{shuffled} - \text{Acc}_\text{single} \\ \Delta_\text{temporal} &= \text{Acc}_\text{orig} - \text{Acc}_\text{shuffled} \end{align}\] where \(\mathrm{\small VDG}= \Delta_\text{spatial} + \Delta_\text{diversity} + \Delta_\text{temporal}\).
| Model | Blk | Sgl | Shf | Orig | \(\Delta_\text{s}\) | \(\Delta_\text{d}\) | \(\Delta_\text{t}\) |
|---|---|---|---|---|---|---|---|
| Qwen2-VL-2B | 0.313 | 0.377 | 0.475 | 0.472 | \(+\)0.064 | \(+\)0.098 | \(-\)0.003 |
| Qwen2-VL-72B\(^\dagger\) | 0.410 | 0.490 | 0.637 | 0.667 | \(+\)0.080 | \(+\)0.147 | \(+\)0.030 |
| Qwen2.5-VL-3B | 0.362 | 0.420 | 0.550 | 0.572 | \(+\)0.058 | \(+\)0.130 | \(+\)0.022 |
| Qwen2.5-VL-7B | 0.333 | 0.425 | 0.572 | 0.630 | \(+\)0.092 | \(+\)0.147 | \(+\)0.058 |
| Qwen2.5-VL-32B\(^\dagger\) | 0.369 | 0.462 | 0.600 | 0.635 | \(+\)0.093 | \(+\)0.138 | \(+\)0.035 |
| Qwen2.5-VL-72B\(^\dagger\) | 0.377 | 0.482 | 0.625 | 0.703 | \(+\)0.105 | \(+\)0.143 | \(+\)0.078 |
| Qwen3-VL-2B | 0.333 | 0.385 | 0.418 | 0.447 | \(+\)0.052 | \(+\)0.033 | \(+\)0.029 |
| Qwen3-VL-8B | 0.407 | 0.488 | 0.522 | 0.514 | \(+\)0.081 | \(+\)0.034 | \(-\)0.008 |
| Qwen3-VL-32B\(^\dagger\) | 0.392 | 0.475 | 0.513 | 0.557 | \(+\)0.083 | \(+\)0.038 | \(+\)0.044 |
| InternVL2-2B | 0.295 | 0.380 | 0.503 | 0.513 | \(+\)0.085 | \(+\)0.123 | \(+\)0.010 |
| InternVL2-8B | 0.312 | 0.420 | 0.575 | 0.583 | \(+\)0.108 | \(+\)0.155 | \(+\)0.008 |
| InternVL2-26B | 0.320 | 0.405 | 0.575 | 0.582 | \(+\)0.085 | \(+\)0.170 | \(+\)0.007 |
| InternVL2-76B\(^\dagger\) | 0.357 | 0.280 | 0.295 | 0.308 | \(-\)0.077 | \(+\)0.015 | \(+\)0.013 |
| InternVL2.5-78B\(^\dagger\) | 0.452 | 0.448 | 0.452 | 0.452 | \(-\)0.004 | \(+\)0.004 | \(+\)0.000 |
| VideoLLaMA2-7B | 0.342 | 0.475 | 0.550 | 0.585 | \(+\)0.133 | \(+\)0.075 | \(+\)0.035 |
| LLaVA-Video-7B | 0.351 | 0.443 | 0.628 | 0.638 | \(+\)0.092 | \(+\)0.185 | \(+\)0.010 |
| \(^\dagger\)4-bit NF4 quantization. Blk=black, Sgl=singleframe, Shf=shuffled. | |||||||
Table 7 reports the full ladder for all sixteen models. Four findings emerge:
The temporal delta (\(\Delta_\text{temporal}\)) is approximately zero across all models. Across all sixteen models, restoring temporal order from shuffled to original provides at most \(+\)0.078 accuracy (Qwen2.5-VL-72B), and most models gain \(<\) \(+\)0.035, and two show negative \(\Delta_\text{temporal}\). Temporal ordering is not used by any current architecture at our evaluation resolution. This explains the low Temporal Reasoning VDG: the information these questions demand is precisely the information no model extracts.
The diversity delta (\(\Delta_\text{diversity}\)) is the dominant visual signal. For well-functioning models, observing multiple diverse frames in which shuffled exceeds singleframe contributes
\(+\)0.075 to \(+\)0.185 in accuracy. LLaVA-Video-7B has the highest \(\Delta_\text{diversity}\) (\(+\)0.185), consistent
with its high overall VDG. The visual grounding captured by VDG is primarily frame diversity: seeing the right content somewhere in the video, not temporal coherence.
Qwen3-VL shows a near zero \(\Delta_\text{diversity}\). Qwen3-VL models show \(\Delta_\text{diversity}\) of only \(+\)0.033–0.038 across all three sizes,
versus \(+\)0.130–0.147 for Qwen2.5-VL at comparable scales. Singleframe accuracy is nearly as high as shuffled, meaning Qwen3-VL extracts almost all its visual information from a single frame. This
architectural shift, favoring per-frame feature extraction over multi-frame aggregation, accounts for Qwen3-VL’s VDG regression despite stronger language priors.
InternVL2-76B and InternVL2.5-78B show negative \(\Delta_\text{spatial}\). Especially, InternVL2-76B shows \(\Delta_\text{spatial} = -0.077\): a single real frame lowers accuracy below the black-screen floor (0.280 vs.), and both \(\Delta_\text{diversity}\) (\(+\)0.015) and \(\Delta_\text{temporal}\) (\(+\)0.013) are negligible. Moreover, InternVL2.5-78B is even flatter (\(\Delta_\text{spatial} = -0.004\), \(\Delta_\text{diversity} = +0.004\), \(\Delta_\text{temporal} = 0.000\)): all four conditions produce identical accuracy (0.452). These models do not extract visual information at any level of the ladder, confirming that their benchmark accuracy is entirely language-driven, consistent with their aggregate VDG\(\leq 0\) (Section 5.4).
6 Discussion↩︎
The VDG spectrum implies that most benchmark difficulty is linguistic, not visual: only 31% of Video-MME questions fall in Category I (pure visual), while 70% are answerable regardless of visual input. Temporal ordering contributes near-zero accuracy across all models, and visual grounding is dominated by frame diversity. Our claim targets benchmark quality, not model capability: current Temporal Reasoning questions do not discriminate temporal understanding from language-prior exploitation. Benchmarks designed for temporal discrimination (e.g., TempCompass [24], Perception Test [62]) are a priority for future analysis.
VDG increases with scale (Qwen2.5-VL: \(0.210 \to 0.297\), 3B\(\to\)7B) and generation (Qwen2-VL-2B: 0.159 \(\to\) Qwen2.5-VL-3B: 0.210), but Qwen3-VL regresses at every size class (0.107 at 8B vs.) due to a near-zero \(\Delta_\text{diversity}\) (\(+\)0.034 vs.\(+\)0.147), invisible to accuracy where Qwen3-VL-8B (51.4%) appears comparable to InternVL2-2B (51.3%). API models show the same pattern: VDG ranges from 0.025 (Nemotron) to 0.315 (Gemini), confirming the dissociation generalizes beyond open-weight architectures.
As first-iteration candidate heuristics requiring validation on additional benchmarks, task types with VDG \(<0.10\) should be flagged for review, while those with VDG \(>0.30\) provide empirical targets for more visually dependent questions. These cutoffs summarize the observed spectrum rather than define universal pass/fail criteria. Positional bias [63], [64] explains 20–31% of above-chance black-screen accuracy (Supplementary Table S5). Benchmark designers should verify uniform ground-truth letter distribution.
Scale claims are restricted to bf16 models (2–26B), and 4-bit and frontier models remain partially tested. All benchmarks use MCQ formats. Extending VDG to open-ended generation is future work. The diagnostic ladder was evaluated at 0.25 FPS only, and the FPS ablation covers 0.5–24 FPS but with five models.
7 Conclusion↩︎
Across twenty models (2–78B, ten architecture families including two proprietary), we demonstrate that benchmark accuracy and visual grounding are statistically separable. The VDG diagnostic reveals four key findings: (1) McNemar testing demonstrates that accuracy and visual dependency can dissociate, (2) the task-type VDG spectrum is cross-benchmark consistent, (3) temporal ordering contributes near-zero accuracy while frame diversity dominates, and (4) Qwen3-VL shows a VDG regression invisible to accuracy. We propose VDG as a standard audit instrument for video benchmark construction. All code and annotations are publicly available.
This supplementary material provides expanded tables, detailed statistical analyses, and methodological details that support the main paper’s findings but could not be included due to space constraints. All data are derived from the same inference runs described in the main text.
The supplementary material is organized as follows:
Sections 1–2 provide the full MVBench per-task-type VDG results and CRF 38 degradation analysis, expanding on the cross-benchmark consistency claims in the main paper.
Section 3 reports the complete McNemar contingency tables for EgoSchema, documenting why no dissociation was observed on this benchmark.
Sections 4–5 present the four-category decomposition and positional bias analysis that underlie the main paper’s discussion of benchmark information content and letter-alignment effects.
Sections 6–7 provide EgoSchema destructive ratios and cross-model MVBench VDG rankings, supporting the generalization claims.
Sections 8–10 contain the raw accuracy data for both the main FPS ablation (0.5–2.0 FPS) and the extended ablation (4–24 FPS), enabling independent verification of the FPS-invariance finding.
Sections 11–14 provide additional analyses: Video-MME McNemar contingency tables, CRF bidirectional flip quantification, a contrastive task-type case study, and cross-model question-level agreement statistics.
Section 15 details inference configuration (prompt templates, frame sampling, API setup, quantization) for reproducibility.
Section 16 provides four annotated Python listings for the core algorithms: VDG computation, diagnostic ladder decomposition, black-screen video generation, and frame sampling.
8 MVBench: Full Per-Task-Type Results (Table S1)↩︎
| Qwen2-VL-7B | LLaVA-Video-7B | InternVL2-8B | |||||||||||||
|---|---|---|---|---|---|---|---|---|---|---|---|---|---|---|---|
| 2-6 (lr)7-11 (lr)12-16 Task Type | Orig | CRF | Blk | VDG | CI | Orig | CRF | Blk | VDG | CI | Orig | CRF | Blk | VDG | CI |
| act_pred | 0.640 | 0.600 | 0.240 | 0.400 | [0.22,0.58] | 0.640 | 0.600 | 0.200 | 0.440 | [0.28,0.60] | 0.680 | 0.660 | 0.380 | 0.300 | [0.12,0.48] |
| obj_exist | 0.848 | 0.739 | 0.457 | 0.391 | [0.24,0.54] | 0.630 | 0.587 | 0.478 | 0.152 | [\(-\)0.04,0.35] | 1.00 | 0.978 | 0.457 | 0.543 | [0.41,0.67] |
| scene_tr | 0.960 | 0.940 | 0.620 | 0.340 | [0.22,0.48] | 0.940 | 0.960 | 0.860 | 0.080 | [0.00,0.18] | 0.980 | 0.960 | 0.660 | 0.320 | [0.20,0.44] |
| act_ant | 0.840 | 0.900 | 0.600 | 0.240 | [0.10,0.38] | 0.780 | 0.750 | 0.460 | 0.320 | [0.20,0.46] | 0.880 | 0.950 | 0.340 | 0.540 | [0.38,0.68] |
| cf_inf | 0.620 | 0.520 | 0.360 | 0.260 | [0.08,0.44] | 0.560 | 0.540 | 0.380 | 0.180 | [0.02,0.34] | 0.860 | 0.820 | 0.460 | 0.400 | [0.22,0.56] |
| state_ch | 0.500 | 0.440 | 0.340 | 0.160 | [0.04,0.30] | 0.560 | 0.560 | 0.280 | 0.280 | [0.08,0.46] | 0.580 | 0.540 | 0.540 | 0.040 | [\(-\)0.12,0.20] |
| ego_nav | 0.380 | 0.380 | 0.320 | 0.060 | [\(-\)0.02,0.16] | 0.380 | 0.340 | 0.300 | 0.080 | [\(-\)0.02,0.18] | 0.380 | 0.440 | 0.360 | 0.020 | [\(-\)0.10,0.14] |
| ep_reas | 0.548 | 0.613 | 0.500 | 0.048 | [\(-\)0.16,0.19] | 0.660 | 0.660 | 0.540 | 0.120 | [\(-\)0.02,0.26] | 0.580 | 0.600 | 0.580 | 0.000 | [\(-\)0.10,0.10] |
| unexp_act | 0.700 | 0.680 | 0.760 | \(-\)0.060 | [\(-\)0.20,0.08] | 0.860 | 0.880 | 0.860 | 0.000 | [\(-\)0.12,0.12] | 0.760 | 0.700 | 0.620 | 0.140 | [\(-\)0.00,0.30] |
| Overall | 0.670 | 0.622 | 0.460 | 0.208 | [0.16,0.26] | 0.662 | 0.646 | 0.476 | 0.186 | [0.14,0.24] | 0.742 | 0.715 | 0.476 | 0.266 | [0.21,0.32] |
(1) action_prediction is the only task type with near-chance black-screen accuracy for all three models (0.20–0.38), confirming it as the empirical anchor for visually necessary question design. (2) object_existence shows the
largest model-dependent VDG range: InternVL2 achieves 0.543 (with 100% original accuracy) while LLaVA achieves only 0.152, despite similar black-screen floors (0.457 vs.). The gap is in visual extraction capability, not
language-prior strength. (3) unexpected_action has negative VDG for Qwen (\(-\)0.060) and zero for LLaVA (0.000): video slightly hurts or does not help. (4) CRF 38 degradation is
small for most task types (\(<\)0.06), with object_existence showing the largest drop for Qwen (\(-\)0.109).
9 MVBench: CRF 38 Degradation (Table S2)↩︎
| Task Type | Qwen | LLaVA | IV2 |
|---|---|---|---|
| act_prediction | \(+\)0.040 | \(+\)0.040 | \(+\)0.020 |
| obj_existence | \(+\)0.109 | \(+\)0.043 | \(+\)0.022 |
| scene_transition | \(+\)0.020 | \(-\)0.020 | \(+\)0.020 |
| act_antonym | \(-\)0.060 | \(+\)0.030 | \(-\)0.070 |
| cf_inference | \(+\)0.100 | \(+\)0.020 | \(+\)0.040 |
| state_change | \(+\)0.060 | \(\pm\)0.000 | \(+\)0.040 |
| ego_navigation | \(\pm\)0.000 | \(+\)0.040 | \(-\)0.060 |
| ep_reasoning | \(-\)0.065 | \(\pm\)0.000 | \(-\)0.020 |
| unexp_action | \(+\)0.020 | \(-\)0.020 | \(+\)0.060 |
| Overall | \(+\)0.048 | \(+\)0.016 | \(+\)0.027 |
Table 9 confirms that the compression robustness illusion observed on Video-MME extends to MVBench. Overall accuracy drops are small: \(+\)0.048 for Qwen, \(+\)0.016 for LLaVA, \(+\)0.027 for InternVL2. However, three patterns emerge at the task-type level. First, the direction of change is inconsistent across models: act_antonym shows \(-\)0.060 for Qwen (compression helps) but \(+\)0.030 for LLaVA (compression hurts), indicating model-specific sensitivity. Second, obj_existence shows the largest degradation for Qwen (\(+\)0.109), consistent with this task’s high VDG(Table S1): visually grounded questions are disproportionately affected by compression, mirroring the CRF-enrichment finding on Video-MME. Third, several task types show exactly zero change for at least one model (e.g., ego_navigation for Qwen, ep_reasoning for LLaVA), reinforcing that low-VDG tasks are insensitive to visual quality degradation.
10 EgoSchema: Full McNemar Tables (Table S3)↩︎
| Pair | Cond. | \(b_{00}\) | \(b_{01}\) | \(b_{10}\) | \(b_{11}\) | \(\chi^2\) | \(p\) |
|---|---|---|---|---|---|---|---|
| IV2 vs.Qwen | Orig | 131 | 69 | 85 | 215 | 1.46 | 0.227 |
| Black | 280 | 61 | 68 | 91 | 0.28 | 0.597 | |
| IV2 vs.LLaVA | Orig | 148 | 52 | 95 | 205 | 12.0 | 0.0005 |
| Black | 302 | 39 | 95 | 64 | 22.6 | \(<\)0.001 | |
| Qwen vs.LLaVA | Orig | 169 | 47 | 74 | 210 | 5.59 | 0.018 |
| Black | 318 | 30 | 79 | 73 | 21.1 | \(<\)0.001 |
InternVL2 vs.Qwen shows no reliable difference on either condition: these models perform similarly on EgoSchema. InternVL2 vs.LLaVA and Qwen vs.LLaVA both differ reliably on both conditions, meaning LLaVA’s lower accuracy extends to both video-present and black-screen settings. This is a consistent performance gap, not a dissociation (which requires opposite significance patterns).
11 Four-Category Decomposition by Task Type (Table S4)↩︎
Each question falls into one of four categories defined by correctness under original video (\(y_\text{orig}\)) and black screen (\(y_\text{black}\)). Table 11 breaks this down by task type on Video-MME.
| Qwen2-VL-7B | LLaVA-Video-7B | InternVL2-8B | ||||||||||
|---|---|---|---|---|---|---|---|---|---|---|---|---|
| 2-5 (lr)6-9 (lr)10-13 Task Type | I | II | III | IV | I | II | III | IV | I | II | III | IV |
| Attr.Perc. | 0.460 | 0.240 | 0.060 | 0.240 | 0.490 | 0.330 | 0.030 | 0.150 | 0.450 | 0.250 | 0.070 | 0.230 |
| Obj.Rec. | 0.340 | 0.280 | 0.090 | 0.290 | 0.510 | 0.270 | 0.030 | 0.190 | 0.400 | 0.230 | 0.020 | 0.350 |
| OCR Probs. | 0.310 | 0.260 | 0.110 | 0.320 | 0.390 | 0.300 | 0.060 | 0.250 | 0.310 | 0.230 | 0.080 | 0.380 |
| Act.Rec. | 0.250 | 0.430 | 0.040 | 0.280 | 0.330 | 0.450 | 0.010 | 0.210 | 0.280 | 0.290 | 0.030 | 0.400 |
| Act.Reas. | 0.230 | 0.320 | 0.110 | 0.340 | 0.210 | 0.400 | 0.050 | 0.340 | 0.230 | 0.320 | 0.050 | 0.400 |
| Temp.Reas. | 0.110 | 0.290 | 0.130 | 0.470 | 0.190 | 0.270 | 0.110 | 0.430 | 0.160 | 0.280 | 0.070 | 0.490 |
| Overall | 0.283 | 0.303 | 0.090 | 0.323 | 0.353 | 0.337 | 0.048 | 0.262 | 0.305 | 0.267 | 0.053 | 0.375 |
(1) Category I (pure visual) decreases monotonically from Attribute Perception to Temporal Reasoning for all three models, consistent with the VDG spectrum in the main paper. (2) Category III (video hurts) is highest for Temporal Reasoning across all models (7–13%), confirming that temporal questions are the most vulnerable to visual misleading. (3) LLaVA has the highest overall Category I fraction (35.3%) and the lowest Category III (4.8%), consistent with its highest VDG. Qwen has the highest Category III (9.0%), driven by OCR, Action Reasoning, and Temporal Reasoning. (4) The “pure visual core” (Category I across all three models simultaneously) is 10.3% of questions, as reported in the main paper.
12 Positional Bias Analysis (Table S5)↩︎
| GT | Black-Screen Accuracy | Alignment % | |||||
|---|---|---|---|---|---|---|---|
| 3-5 (lr)6-8 Task Type | Mode | Qwen | LLaVA | IV2 | Qwen | LLaVA | IV2 |
| Attr.Perc. | C | 0.300 | 0.360 | 0.320 | 35 | 25 | 54 |
| Obj.Rec. | D | 0.370 | 0.300 | 0.250 | 15 | 55 | — |
| OCR Probs. | B | 0.370 | 0.360 | 0.310 | 56 | 71 | 63 |
| Act.Rec. | C | 0.470 | 0.460 | 0.320 | 31 | 23 | 25 |
| Act.Reas. | B | 0.430 | 0.450 | 0.370 | 54 | 49 | 40 |
| Temp.Reas. | B | 0.420 | 0.380 | 0.350 | 63 | 75 | 48 |
| Overall | B | 0.393 | 0.385 | 0.320 | 29 | 31 | \(-\)21\(^*\) |
| \(^*\)InternVL2 overall modal prediction (A) \(\neq\) GT mode (B), see text. | |||||||
At the per-task-type level, letter alignment explains 15–75% of above-chance black-screen accuracy across all models and task types. At the overall level, Qwen (29%) and LLaVA (31%) have modal predictions (B) that match the most frequent ground-truth letter (B), so their alignment fractions are positive. InternVL2’s modal prediction (A, driven by a general A-preference) does not match the GT mode (B), yielding a negative overall alignment fraction: InternVL2’s letter bias works against accuracy at the aggregate level, yet it still achieves 32% black-screen accuracy through per-task-type alignment (where local GT modes vary). The shared-wrong consensus (19.8%, 119/600 questions) indicates a dataset-level regularity that all three models exploit regardless of their individual letter preferences.
On black screen, all three models show distinct letter preferences: Qwen favors B (31%), LLaVA distributes relatively uniformly (A: 26%, B: 29%, C: 19%, D: 26%), and InternVL2 favors A (31%). The ground-truth distribution is A: 24%, B: 29%, C: 26%, D: 21%. InternVL2’s A-preference misaligns with the GT’s B-mode, explaining its lower overall black-screen accuracy (32.0% vs.% for Qwen) despite comparable per-task alignment.
13 EgoSchema: Destructive Ratios (Table S6)↩︎
| Model | D | C | D:C | Net Loss |
|---|---|---|---|---|
| InternVL2-8B | 159 | 18 | 8.8:1 | 141 |
| Qwen2-VL-7B | 150 | 18 | 8.3:1 | 132 |
| LLaVA-Video-7B | 167 | 13 | 12.8:1 | 154 |
Table 13 reveals two key patterns. First, the destructive-to-constructive ratio is consistently high across all models (8.3:1 to 12.8:1), meaning that for every question where removing video fixes a wrong answer, 8–13 questions are broken. This asymmetry is substantially higher than on Video-MME (4.25:1 to 7.3:1 for the three primary models), suggesting that EgoSchema’s longer, egocentric videos provide more irreplaceable visual information. Second, the net loss correlates with VDG magnitude: LLaVA has the highest net loss (154), the highest VDG(0.308), and the lowest black-screen floor (20.6%), while Qwen has the lowest net loss (132), consistent with its relatively stronger language priors on this benchmark. The uniformly high D:C ratio across architecturally distinct models confirms that video dependency on EgoSchema is a property of the questions, not of any particular model.
14 Cross-Model VDG on MVBench (Table S7)↩︎
| Task Type | Qwen | LLaVA | IV2 | Mean |
|---|---|---|---|---|
| act_prediction | 0.400 | 0.440 | 0.300 | 0.380 |
| act_antonym | 0.240 | 0.320 | 0.540 | 0.367 |
| obj_existence | 0.391 | 0.152 | 0.543 | 0.362 |
| cf_inference | 0.260 | 0.180 | 0.400 | 0.280 |
| scene_transition | 0.340 | 0.080 | 0.320 | 0.247 |
| state_change | 0.160 | 0.280 | 0.040 | 0.160 |
| ep_reasoning | 0.048 | 0.120 | 0.000 | 0.056 |
| ego_navigation | 0.060 | 0.080 | 0.020 | 0.053 |
| unexp_action | \(-\)0.060 | 0.000 | 0.140 | 0.027 |
| Overall | 0.208 | 0.186 | 0.266 | 0.220 |
Table 14 reveals three important findings about the VDG spectrum on MVBench. First, the ranking of task types is broadly consistent across models: the top three task types by mean VDG(act_prediction: 0.380, act_antonym: 0.367, obj_existence: 0.362) and the bottom three (ep_reasoning: 0.056, ego_navigation: 0.053, unexp_action: 0.027) are stable, supporting the main paper’s claim that VDG is a property of the task type, not the model. Second, the magnitude of VDG varies substantially across models for specific tasks: obj_existence ranges from 0.152 (LLaVA) to 0.543 (InternVL2), a 3.6\(\times\) difference driven by InternVL2’s 100% original accuracy versus LLaVA’s 63%. This shows that while task-type ordering is model-independent, the degree of visual grounding is model-dependent. Third, unexp_action is the only task type where the mean VDG is near zero (0.027) and one model shows negative VDG(Qwen: \(-\)0.060), indicating that video actively misleads on this task type—the model performs better without seeing the video.
15 FPS Ablation: Raw Accuracy (Table S8)↩︎
Table 15 reports the raw original and black-screen accuracy underlying the main paper’s FPS ablation. This confirms that VDG flatness reflects genuine stability of both arms, not coordinated movement.
| 0.5 FPS | 1.0 FPS | 2.0 FPS | |||||||
|---|---|---|---|---|---|---|---|---|---|
| 2-4 (lr)5-7 (lr)8-10 Model | Orig | Blk | VDG | Orig | Blk | VDG | Orig | Blk | VDG |
| Q2-VL-2B | 0.330 | 0.290 | 0.040 | 0.340 | 0.290 | 0.050 | 0.340 | 0.290 | 0.050 |
| Q2-VL-72B\(^\dagger\) | 0.510 | 0.390 | 0.120 | 0.520 | 0.400 | 0.120 | 0.510 | 0.410 | 0.100 |
| Q2.5-VL-3B | 0.480 | 0.333 | 0.147 | 0.535 | 0.323 | 0.212 | 0.465 | 0.333 | 0.132 |
| Q2.5-VL-7B | 0.606 | 0.380 | 0.226 | 0.602 | 0.370 | 0.232 | 0.636 | 0.350 | 0.286 |
| Q2.5-VL-32B\(^\dagger\) | 0.660 | 0.450 | 0.210 | 0.640 | 0.450 | 0.190 | 0.640 | 0.420 | 0.220 |
| Q2.5-VL-72B\(^\dagger\) | 0.670 | 0.400 | 0.270 | 0.660 | 0.410 | 0.250 | 0.630 | 0.420 | 0.210 |
| Q3-VL-8B | 0.460 | 0.440 | 0.020 | 0.530 | 0.420 | 0.110 | 0.520 | 0.420 | 0.100 |
Black-screen accuracy varies slightly across FPS levels for some models (e.g., Qwen2-VL-2B: 0.290 at all levels), reflecting minor inference stochasticity. The Orig column shows no monotonic increase with FPS for any model, confirming that additional frames do not unlock temporal grounding within the tested range.
16 Extended FPS Ablation: 4–24 FPS (Tables S9–S10)↩︎
To address the FPS ceiling limitation of the main ablation (0.5–2.0 FPS), we extend the FPS range to 4, 8, 16, and 24 FPS across five models. Table 16 reports VDG at each FPS level, and Table 17 reports raw accuracy.
| Model | 4 FPS | 8 FPS | 16 FPS | 24 FPS |
|---|---|---|---|---|
| InternVL2-2B | —\(^*\) | \(\pm\)0.000 | \(\pm\)0.000 | \(\pm\)0.000 |
| Qwen2-VL-2B\(^\dagger\) | \(-\)0.059 | \(-\)0.030 | \(-\)0.020 | \(-\)0.020 |
| Qwen2-VL-7B | \(+\)0.132 | \(+\)0.105 | \(+\)0.110 | \(+\)0.110 |
| Qwen2.5-VL-7B | \(+\)0.250 | \(+\)0.250 | \(+\)0.240 | \(+\)0.236 |
| Qwen3-VL-2B | \(+\)0.010 | \(+\)0.120 | \(+\)0.110 | \(+\)0.110 |
| \(^*\)103/103 decoding errors, excluded. | ||||
| Original | Black Screen | ||||||||
|---|---|---|---|---|---|---|---|---|---|
| 3-6 (lr)7-10 Model | FPS | OK | Err | Acc | OK | Err | Acc | ||
| IV2-2B | 4 | 0 | 103 | — | 42 | 58 | 0.333 | ||
| 8 | 100 | 0 | 0.330 | 97 | 3 | 0.330 | |||
| 16 | 84 | 16 | 0.333 | 84 | 16 | 0.333 | |||
| 24 | 97 | 3 | 0.320 | 97 | 3 | 0.320 | |||
| Q2-VL-2B | 4 | 95 | 5 | 0.263 | 93 | 7 | 0.323 | ||
| 8 | 100 | 0 | 0.270 | 100 | 0 | 0.300 | |||
| 16 | 100 | 0 | 0.280 | 100 | 0 | 0.300 | |||
| 24 | 100 | 0 | 0.280 | 100 | 0 | 0.300 | |||
| Q2-VL-7B | 4 | 97 | 3 | 0.505 | 99 | 1 | 0.374 | ||
| 8 | 99 | 1 | 0.485 | 100 | 0 | 0.380 | |||
| 16 | 100 | 0 | 0.490 | 100 | 0 | 0.380 | |||
| 24 | 100 | 0 | 0.490 | 100 | 0 | 0.380 | |||
| Q2.5-VL-7B | 4 | 100 | 4 | 0.620 | 100 | 1 | 0.370 | ||
| 8 | 100 | 0 | 0.630 | 100 | 0 | 0.380 | |||
| 16 | 100 | 0 | 0.610 | 100 | 0 | 0.370 | |||
| 24 | 99 | 1 | 0.616 | 100 | 0 | 0.380 | |||
| Q3-VL-2B | 4 | 100 | 0 | 0.340 | 100 | 1 | 0.330 | ||
| 8 | 100 | 0 | 0.420 | 100 | 0 | 0.300 | |||
| 16 | 100 | 0 | 0.360 | 100 | 0 | 0.250 | |||
| 24 | 100 | 0 | 0.400 | 100 | 0 | 0.290 | |||
(1) VDG is flat from 8 to 24 FPS for all models, confirming FPS invariance at near-native frame rates. (2) Qwen2-VL-2B shows negative VDG at all FPS levels (\(-\)0.020 to \(-\)0.059): video input slightly hurts performance, consistent with its near-zero VDG in the main analysis. (3) Qwen2.5-VL-7B maintains VDG \(\approx 0.24\)–\(0.25\) from 4 to 24 FPS, consistent with the 0.23–0.29 range observed at 0.5–2.0 FPS in the main ablation. (4) InternVL2-2B at 4 FPS suffers complete decoding failure on original video (103/103 errors), indicating a practical frame-count limit for this architecture. At 8+ FPS it produces VDG \(=\) 0, consistent with its near-zero Temporal Reasoning VDG(\(-\)0.030).
17 Video-MME McNemar Contingency Tables (Table S11)↩︎
The main paper reports McNemar results for Video-MME in summary form. Table 18 provides the full \(2 \times 2\) contingency tables underlying these tests on the matched sample (\(n=547\)).
| Pair | Cond. | \(b_{00}\) | \(b_{01}\) | \(b_{10}\) | \(b_{11}\) | \(\chi^2\) | \(p\) |
|---|---|---|---|---|---|---|---|
| IV2 vs.Qwen | Orig | 120 | 34 | 52 | 341 | 3.58 | 0.0906 |
| Black | 263 | 58 | 22 | 204 | 15.2 | 0.0008 |
On original video, InternVL2-8B and Qwen2-VL-7B show a marginal accuracy difference (\(p=0.0906\)) that does not reach significance at \(\alpha=0.05\). On the black-screen condition, the pair differs strongly (\(p=0.0008\)): Qwen exploits language priors more effectively than InternVL2. This is a dissociation with reversed significance, though the original-arm marginality limits the strength of the claim (bootstrap analysis shows the joint condition holds in 50% of resamplings, as noted in the main text).
18 CRF Bidirectional Flip Analysis (Table S12)↩︎
The main paper notes that aggregate CRF stability masks bidirectional cancellation. Table 19 quantifies this effect for each model at CRF 38.
| Model | \(\text{C}\!\to\!\text{I}\) | \(\text{I}\!\to\!\text{C}\) | Net | Stable% |
|---|---|---|---|---|
| Qwen2-VL-7B | 32 | 27 | \(-\)5 | 90.2% |
| LLaVA-Video-7B | 28 | 25 | \(-\)3 | 91.2% |
| InternVL2-8B | 25 | 28 | \(+\)3 | 91.2% |
(1) Each model has 25–32 questions that flip in each direction at CRF 38, yet net changes are \(\leq\)5 questions. Aggregate accuracy stability is a cancellation artifact. (2) InternVL2 gains 3 net correct answers from compression, a positive compression effect that would be interpreted as “robustness” in standard evaluation. (3) The 90–91% stable fraction means \({\sim}\)10% of questions are compression-sensitive, and these concentrate on visually grounded items (\(\mathrm{\small VDG}=+1\)) at 3.76\(\times\) the base rate (Fisher exact \(p=0.006\), see main text).
19 Contrastive Task-Type Case Study (Table S13)↩︎
The main paper identifies contrastive task-type pairs as internal controls for the VDG spectrum. The scene_transition vs.state_change pair on MVBench shares similar statistical structure (both
involve detecting visual changes between temporal segments) but differs in semantic leakage.
| Task Type | Orig | Black | GT entropy | Chance | |
|---|---|---|---|---|---|
| scene_transition | 0.960 | 0.713 | 0.247 | 0.94 | 0.50 |
| state_change | 0.547 | 0.387 | 0.160 | 1.00 | 0.50 |
Both tasks are binary (2 choices, chance = 50%) and involve detecting temporal change. However, scene_transition achieves 71.3% black-screen accuracy—well above chance—because transition questions often have semantically predictable answers
(“yes” is more common). In contrast, state_change has a more balanced GT distribution (entropy 1.00 vs.), yielding a lower black-screen floor (38.7%). The VDG difference (0.247 vs.) thus partly reflects
GT-distribution artifacts rather than genuine differences in visual demand. This pair illustrates why VDG-based benchmark auditing should control for GT-distribution skew when comparing task types.
20 Cross-Model Question-Level Agreement (Table S14)↩︎
The main paper reports that cross-model VDG correlation at the question level is \(r=0.274\)–\(0.304\). Table 21 provides the full correlation matrix and agreement statistics.
| Pair | Spearman \(\rho\) | Exact agree. | Triple agree. |
|---|---|---|---|
| Qwen–LLaVA | 0.304 | 64.8% | — |
| Qwen–IV2 | 0.274 | 63.5% | — |
| LLaVA–IV2 | 0.298 | 65.0% | — |
| All three | — | — | 52.3% |
Models agree on which task types require vision (task-type rank \(r=0.789\)) but disagree substantially on which specific questions within a task type are visually grounded (\(r=0.274\)–\(0.304\)). Only 52.3% of questions receive the same VDG value from all three models. The “pure visual core” (\(\mathrm{\small VDG}=+1\) for all three) is 10.3% of questions, and the “pure language core” (\(\mathrm{\small VDG}=0\) for all three) is 38.7%.
21 Inference Configuration Details↩︎
All models receive the same prompt structure: the video (or black screen) is provided as the visual input, followed by the question text and lettered answer options (A/B/C/D or A/B/C/D/E for EgoSchema). The system prompt instructs the model to respond with only the letter of the correct answer. Temperature is set to 0 (greedy decoding) for all models to ensure deterministic outputs.
The baseline sampling rate is 0.25 FPS for all conditions except the FPS ablation experiments. For a 60-second video at 0.25 FPS, this yields 15 frames. Frames are uniformly sampled from the video duration. For the black-screen condition, all sampled frames are replaced with solid black images (RGB 0,0,0) at the same resolution as the original video. The single-frame condition repeats one randomly selected frame for all frame positions. The shuffled-frames condition randomly permutes the order of the originally sampled frames.
The four API-accessed models (GPT-4o-mini, Gemini 2.5 Flash Lite, Llama 3.2 11B Vision, Nemotron Nano 12B VL) are evaluated through their respective API endpoints with default parameters (temperature = 0, max tokens = 16). Video frames are provided as base64-encoded images in the API request. The same 600-question Video-MME subset is used for all API models under both original and black-screen conditions.
Models above 26B parameters are loaded in 4-bit NF4 quantization using the bitsandbytes library with double quantization enabled (bnb_4bit_use_double_quant=True). This reduces memory requirements from \({\sim}\)140 GB (bf16) to \({\sim}\)40 GB for 72B models, enabling evaluation on a single A100 (80 GB). We emphasize that quantization may selectively degrade vision pathways (as evidenced by
InternVL2-76B’s negative VDG), and all scaling claims are restricted to bf16 models.
22 Core Algorithm Listings↩︎
The four listings below correspond directly to the methods described in Section 3 of the main paper. All are extracted from the public evaluation codebase.
Listing 1: VDG computation. VDG is the per-question difference between original-video and black-screen correctness, aggregated to a task-type or model mean.
def compute_vdg(orig_results, black_results):
    """
    orig_results, black_results: list of dicts with keys
        'question_id' and 'correct' (bool).
    Returns mean VDG = mean(Acc_orig) - mean(Acc_black).
    """
    orig = {r["question_id"]: r["correct"] for r in orig_results}
    black = {r["question_id"]: r["correct"] for r in black_results}
    shared = [q for q in orig if q in black]
    acc_orig  = sum(orig[q]  for q in shared) / len(shared)
    acc_black = sum(black[q] for q in shared) / len(shared)
    return acc_orig - acc_black          # VDG in [-1, +1]
Listing 2: Diagnostic ladder decomposition. Given accuracy under each of the four conditions, the three additive components sum to VDG.
def ladder_decomposition(acc_black, acc_single, acc_shuffled, acc_orig):
    """
    Decomposes VDG = delta_spatial + delta_diversity + delta_temporal.
    Each condition uses identically sampled frames; only their
    arrangement differs.
    """
    delta_spatial   = acc_single   - acc_black    # one frame vs. none
    delta_diversity = acc_shuffled - acc_single   # N frames vs. one
    delta_temporal  = acc_orig     - acc_shuffled # ordered vs. shuffled
    vdg = acc_orig - acc_black                    # = sum of three deltas
    return delta_spatial, delta_diversity, delta_temporal, vdg
Listing 3: Black-screen video generation. Each original video is paired with an equal-duration solid-black video at the same resolution.
import subprocess, re

def get_duration(video_path):
    out = subprocess.run(
        ["ffprobe", "-v", "error", "-show_entries",
         "format=duration", "-of", "default=nw=1:nk=1", video_path],
        capture_output=True, text=True)
    return float(out.stdout.strip())

def make_black_video(video_path, out_path):
    duration = get_duration(video_path)
    subprocess.run([
        "ffmpeg", "-y", "-f", "lavfi",
        "-i", f"color=c=black:s=320x240:d={duration:.2f}",
        "-c:v", "libx264", out_path
    ], check=True)
Listing 4: Uniform frame sampling. Frames are sampled uniformly at 0.25 FPS up to a maximum of 32 frames, matching the inference pipeline.
import numpy as np

FPS_SAMPLE = 0.25
MAX_FRAMES = 32

def sample_frame_indices(total_frames, video_fps):
    duration = total_frames / video_fps
    n = max(1, min(MAX_FRAMES, int(duration * FPS_SAMPLE)))
    return np.linspace(0, total_frames - 1, n, dtype=int)
23 Reproducibility↩︎
All inference scripts, black-screen video generation code, compression pipeline, diagnostic ladder preprocessing, and per-question VDG annotations for Video-MME, MVBench, and EgoSchema are publicly available. The repository includes:
Model inference scripts for all 16 open-weight models across all conditions (original, black screen, single frame, shuffled frames, CRF 18–38), and API model prompts and response parsing included separately
FPS ablation scripts for 7 models \(\times\) 3 FPS levels (0.5–2.0) and 5 models \(\times\) 4 FPS levels (4–24)
Analysis scripts reproducing all tables, figures, and statistical tests in the main paper and this supplement
Per-question VDG annotations in JSON format for downstream analysis without re-running inference
All experiments were conducted on NVIDIA H100 GPUs. Primary experiments (3 models \(\times\) Video-MME + MVBench + EgoSchema, all conditions) required approximately 72 GPU-hours. The 16-model scale analysis and FPS
ablation required approximately 200 additional GPU-hours. 4-bit models (\(>\)26B) used NF4 quantization via bitsandbytes.
PyTorch 2.2+, Transformers 4.40+, ffmpeg 6.0 with libx264 for CRF compression. Environment and dependency specifications are provided in the public repository.
References↩︎
We use “visual grounding” to mean dependence of model predictions on visual input content, not the localization-specific usage common in referring expression literature. To avoid ambiguity, we primarily use the term “visual dependency” throughout.↩︎
Qwen2-VL null predictions (\(n=53\)) are scored as incorrect in the overall VDG calculation, contributing to Qwen’s lower aggregate VDG relative to the full-coverage models. For the matched McNemar test, only questions with valid predictions from both models are included (\(n=547\)), which excludes these 53 questions. The two treatments are complementary: the VDG calculation penalizes null outputs as task failures, while the McNemar comparison requires matched pairs.↩︎
Table 3 presents Qwen2-VL as representative because it is the only model for which full CRF inference was run at all five levels. LLaVA-Video and InternVL2 were evaluated at original and CRF 38 endpoints, and the VDG-stratified enrichment analysis (Fisher exact test) pools all three models.↩︎
2\(\times\)2 cell counts: CRF-sensitive/VDG\(=+1\): 11, CRF-sensitive/VDG\(\leq 0\): 7, stable/VDG\(=+1\): 87, stable/VDG\(\leq 0\): 439, Fisher exact \(p=0.006\), OR \(=3.76\), 95% CI for OR: [1.3, 10.8].↩︎