Breaking Déjà Vu: Independent Auditing of Visual Place Recognition through Vision-Language Reasoning
July 14, 2026
Abstract
Visual place recognition (VPR) is a key enabler of accurate localization and long-term autonomous navigation in robotics applications, such as loop closure detection for simultaneous localisation and mapping (SLAM). However, real-world VPR deployment relies on selecting an image matching threshold that balances precision and recall. These thresholds are typically tuned using labeled validation data and fixed during deployment, making them unreliable under environmental changes where ground truth is unavailable. This is particularly problematic in safety-critical robotics, where accepting a false loop closure can corrupt the estimated trajectory and map. In this work, we introduce Visual Place Recognition Auditing, an independent post-retrieval verification framework that leverages Vision-Language Models (VLMs) to assess retrieved matches by reasoning jointly over query and candidate images. Unlike conventional verification methods, our approach performs instance-level verification without requiring architecture-specific confidence measures, dataset-dependent thresholds, or prior knowledge of the deployment environment. We evaluate our method on six benchmark datasets using five state-of-the-art VPR methods and four VLMs. Results show that VLM-based auditing improves recall@1 by 13.6% on average as compared to state-of-the-art methods while reducing false acceptance rates to 12%, maintaining precision above 95% and coverage above 75%.
1 INTRODUCTION↩︎
VPR enables robots to localize themselves by matching current visual observations to a reference database. It is a core component of loop closure detection in SLAM systems [1]–[3], where incorrect matches can corrupt the estimated trajectory and map [4]–[6], making higher verification precision a reasonable trade-off against speed [1]. For real-world deployment, VPR systems require selecting an image matching threshold that determines whether a retrieved candidate is accepted as a valid match [7]–[9]. This operating point is typically selected offline using precision-recall analysis on labeled validation data and fixed during deployment [10]. However, such thresholds may not generalize to unseen environments due to a number of appearance or environmental variations such as changes in viewpoint, illumination, weather, seasons, occlusions, and perceptual aliasing. In unknown environments where ground truth is unavailable, the system cannot determine whether its selected threshold provides an appropriate trade-off between false acceptance risk and coverage. This is particularly problematic in safety-critical applications where accepting an incorrect loop closure can be significantly more damaging than missing a valid one.
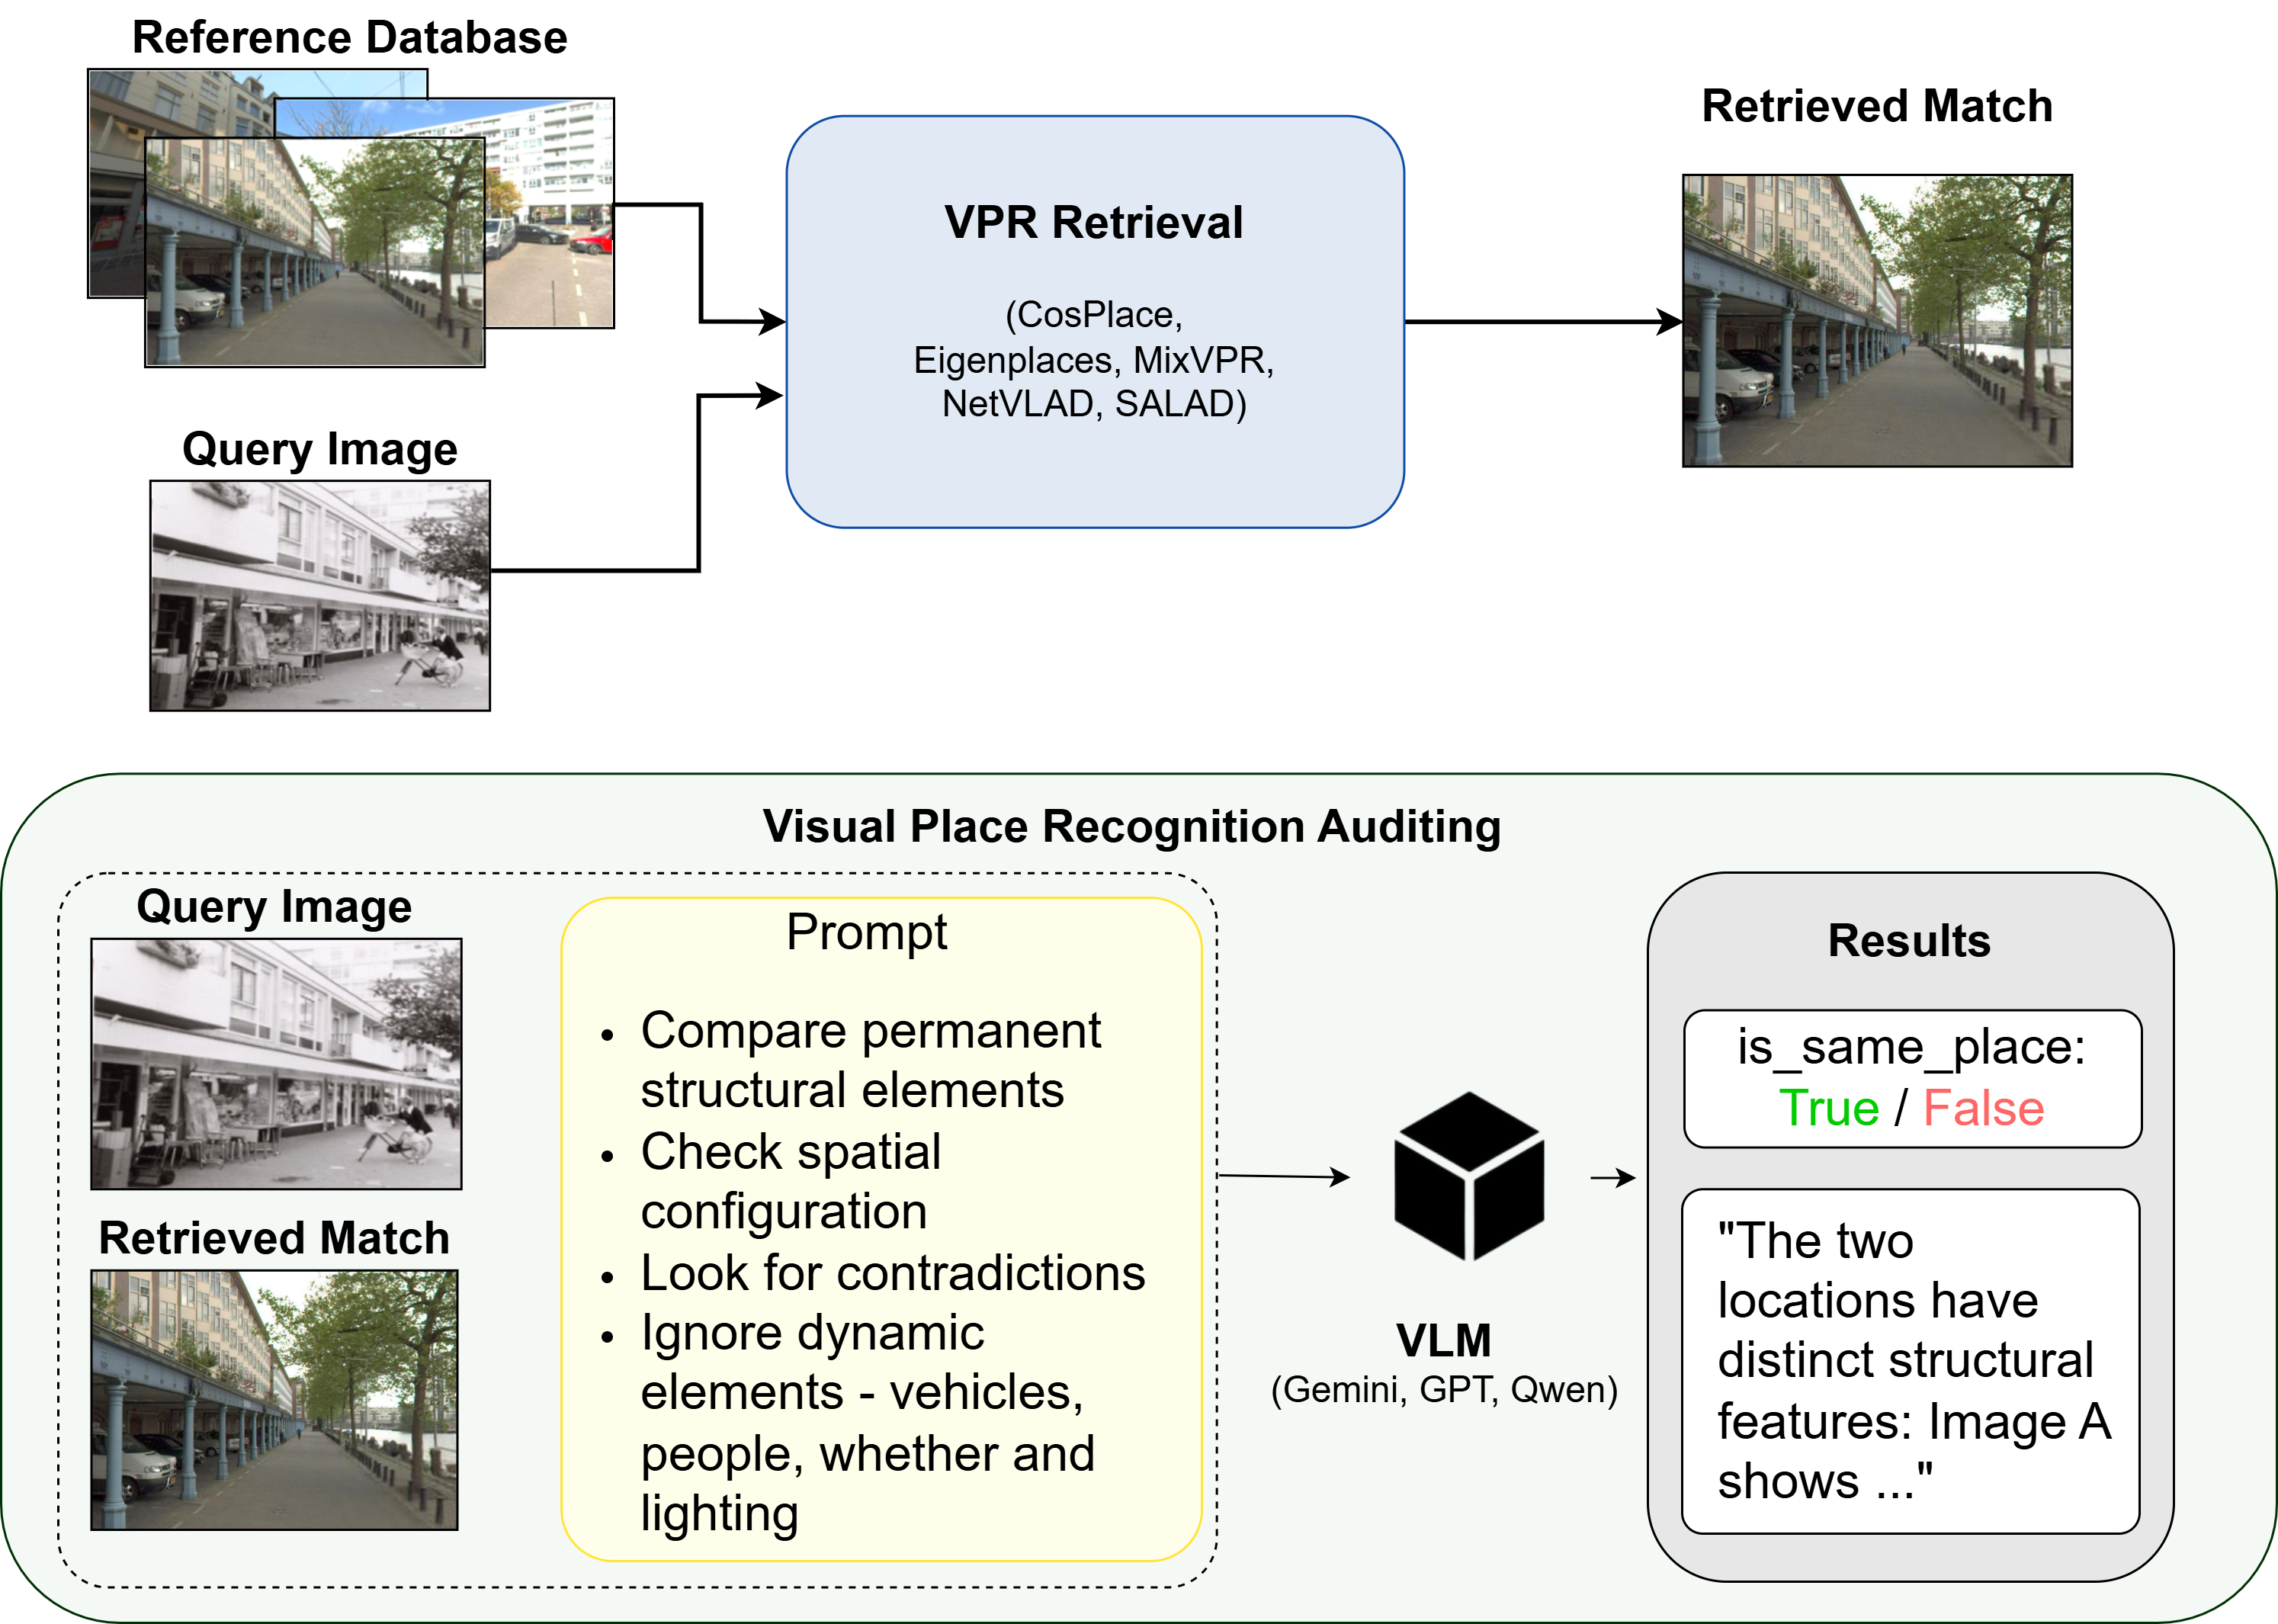
Existing approaches for mitigating false positives primarily focus on verification methods that estimate retrieved match reliability using geometric consistency or signals derived from image embeddings or similarity scores produced by the underlying VPR system [11]–[14], assuming that match correctness can be inferred from these representations. Furthermore, these methods still require selecting appropriate operating point thresholds to convert verification scores into final decisions.
To address these limitations, we introduce Visual Place Recognition Auditing, a post-retrieval verification framework that independently assesses retrieved VPR matches. Instead of relying on manually selected operating points, VPR Auditing performs instance-level verification by directly evaluating whether a query and retrieved image represent the same physical location. We leverage VLMs to reason jointly over visual content and semantic context, providing a verification signal independent of the retrieval feature space, VPR architecture, and deployment environment. This enables safer VPR operation without prior knowledge of the environment or ground truth. We evaluate our approach across six benchmark datasets, five state-of-the-art VPR methods, and four VLMs. Our framework improves recall@1 by 13.6% on average as compared to state-of-the-art methods while reducing false acceptance rates (FAR) to 12%, maintaining precision above 95% and coverage above 75%.
Our main contributions are as follows:
We introduce Visual Place Recognition Auditing, a post-retrieval verification framework that removes dependence on manually selected operating points through instance-level match verification.
We demonstrate that VLMs provide an architecture-independent verification mechanism that rejects false positives while maintaining high precision and coverage across diverse VPR methods and environments.
We show that AUC-PR can mask poor false-positive detection and propose the precision, coverage, and FAR triplet with risk-coverage analysis as deployment-oriented evaluation measures.
The remainder of this paper is organized as follows. Section 2 reviews related work in VPR, match verification, operating point selection and VLMs. Section 3 presents the proposed VPR auditing framework and evaluation metrics. Section 4 describes the experimental details of datasets, VPR methods, VLMs and the auditing protocol followed by a detailed analysis and discussion of results in Section 5. Finally, Section 6 concludes the paper.
2 RELATED WORK↩︎
VPR systems typically retrieve candidate matches using global image descriptors, with additional verification mechanisms often applied to assess retrieval reliability. Although recent advances in loss functions [15]–[17], training data [18], [19], architectures [20]–[22], and aggregation strategies [23]–[25] have significantly improved retrieval accuracy, reliably identifying correct matches remains challenging, particularly in safety-critical systems where false loop closures can corrupt downstream SLAM pipelines [4]. This has motivated verification approaches that aim to reject unreliable predictions and improve localization robustness [6]. Existing methods can be broadly categorized into retrieval-based uncertainty estimation (RUE), data-driven uncertainty estimation (DUE), spatial uncertainty estimation (SUE), and geometric verification (GV).
RUE methods estimate confidence directly from descriptor similarity, using measures such as nearest-neighbour distance or distance ratios [11], [12]. While computationally efficient, they depend strongly on the learned embedding space and may become overconfident under perceptual aliasing [6]. DUE methods instead learn uncertainty-aware representations by modeling descriptors as distributions with associated uncertainty estimates, such as Bayesian Triplet Loss (BTL) [13] and STUN [14]; however, they require specialized training and often generalize poorly across domains [26]. SUE estimates uncertainty from the spatial distribution of top-K retrieved poses [6], but requires geo-tagged reference images and assumes comparable spatial distributions between query and reference data. GV methods verify matches through local feature correspondences and geometric consistency using approaches such as SIFT [27], DELF [28], and SuperPoint [29]. However, geometric verification remains vulnerable to repetitive structures and geometric burstiness, where incorrect locations may still produce consistent local matches [6], [30]. Furthermore, these methods still require selecting an operating point to convert confidence scores into final accept/reject decisions. VPR systems typically require selecting an image matching threshold to determine whether a retrieved candidate should be accepted as a valid match. This threshold controls the trade-off between precision and recall and is commonly selected offline using labeled validation data from a specific deployment environment [9]. However, fixed operating points often fail to generalize under environmental changes where ground truth information is unavailable during deployment [9]. Recent works have explored adaptive threshold selection to address this limitation [9], [31], but these approaches still rely on environment-specific assumptions, calibration data, or prior knowledge of deployment conditions. Consequently, selecting reliable operating points remains challenging for VPR deployment in unknown environments.
VLMs have recently emerged as powerful tools leveraging large-scale vision-language pretraining to enable sophisticated scene understanding and multimodal reasoning for robotic perception, navigation, and localization [32]–[36]. Structured prompting strategies have further been explored to improve the consistency and reliability of VLM reasoning by guiding model outputs [34]. Recent efforts have also investigated efficient VLM deployment through distillation, enabling lightweight multimodal reasoning for resource-constrained robotic platforms [37]. In the context of localization, VLMs have been explored for image-based geo-localization [33], [34]; however, these approaches primarily focus on direct localization rather than verifying retrieved candidates. To the best of our knowledge, the use of VLMs as an independent post-retrieval verification mechanism for VPR remains unexplored.
3 METHODOLOGY↩︎
We propose Visual Place Recognition Auditing, a post-retrieval verification framework for reliable loop closure without relying on manually selected operating points. Unlike conventional VPR pipelines that accept retrieved matches using manually calibrated thresholds, our framework performs instance-level verification of each candidate. The framework integrates with any existing VPR pipeline as an independent post-retrieval layer, requiring no retraining or modification of the underlying model.
3.1 Problem Formulation↩︎
Let \(\mathcal{D} = \{d_1, \ldots, d_N\}\) denote a reference database and \(f\) denote a VPR retrieval function. Given a query image \(q\), \(f\) returns a top-1 candidate \(r = f(q;\,\mathcal{D})\), which is typically accepted directly as a localization estimate. While this is sufficient for many applications, safety-critical systems require additional assurance since an incorrect loop closure can introduce errors that corrupt the estimated trajectory, and compromise the entire map. In such settings, conventional VPR systems determine whether a retrieved candidate is accepted using a threshold on the confidence scores from the VPR system or external verifier This threshold is calibrated using the precision-recall analysis on labeled validation data and does not generalize well to unseen environments. To address this limitation, we introduce a post-retrieval verifier which independently assesses whether the retrieved candidate represents the same physical location. \[V:(q,r) \mapsto \{\textit{accept},\,\textit{reject}\},\] Existing verification methods typically estimate match correctness from the same representation used for retrieval. Formally, if the retrieval network computes descriptors:
\[\mathbf{z}_q = f(q), \qquad \mathbf{z}_r = f(r),\] then confidence estimators operate on: \[g(\mathbf{z}_q,\mathbf{z}_r),\] where \(g\) represents descriptor distance or uncertainty estimates. Consequently, their decision is conditioned on the information retained by the retrieval representation. Since global descriptors intentionally compress visual observations into low-dimensional embeddings optimized for retrieval rather than verification, discriminative scene information discarded during compression cannot be recovered downstream. In contrast, a VLM reasons directly over the original image pair \((q,r)\), allowing it to exploit semantic, structural, and relational cues that may not be preserved in descriptor space. This independence from the retrieval representation enables architecture-agnostic verification without environment-specific calibration or retraining.
3.2 VPR Verification using Vision-Language Models↩︎
We implement \(V\) using a Vision-Language Model (VLM), which receives the query image \(q\) and the retrieved image \(r\) and is prompted to determine whether both images depict the same physical place. As illustrated in Fig. 1, the VLM performs joint reasoning over the image pair, evaluating semantic and structural consistency, specifically including scene layout, architectural elements, street geometry, and distinctive landmarks.
The VLM is prompted using a conservative verification strategy, where it is instructed to assume that the images represent different locations unless strong evidence supports a match. This decision strategy reflects the requirements of safety-critical robotics where accepting an incorrect loop closure can corrupt the map, whereas rejecting a valid match merely misses a loop closure that can be recovered later. The VLM replaces fixed operating point selection with adaptive decisions, enabling deployment in environments where ground truth information is unavailable. The VLM returns a structured response containing a binary accept/reject decision and an explanation for its decision.
| Dataset | Challenge | #DB | #Q | Eval. |
|---|---|---|---|---|
| Pitts250k | Perceptual aliasing: repetitive urban structures and similar layouts | 83,952 | 8,280 | \(\leq\)25 m |
| St Lucia | Perceptual aliasing: weakly distinctive suburban scenes | 1,464 | 1,464 | \(\leq\)25 m |
| Tokyo 24/7 | Appearance variation: day-night and weather changes | 75,984 | 315 | \(\leq\)25 m |
| San Fran | Appearance/viewpoint variation: illumination and viewpoint changes | 27,191 | 1,000 | \(\leq\)25 m |
| Nordland | Seasonal variation: severe appearance change across seasons | 3,066 | 3,066 | 1:1 |
| AmsterTime | Temporal variation: construction, structural changes, illumination shifts | 1,231 | 1,231 | 1:1 |
2pt
3.3 Proposed Evaluation Framework↩︎
Match verification methods are commonly evaluated using AUC-PR values. We argue that AUC-PR alone is insufficient for evaluating post-retrieval verification systems for two reasons. First, AUC-PR aggregates performance across all possible decision thresholds, whereas conventional verification systems operate at a single selected operating point during deployment. Therefore, practical deployment performance depends on whether the chosen operating point achieves sufficiently low risk while maintaining adequate coverage. Second, AUC-PR does not directly measure whether a verifier can reject false positives. When baseline retrieval precision, \(p_0\), is already high, false positives represent only a small fraction of all retrieved matches. Consequently, a verifier that accepts nearly all candidates has PR curve that is approximately flat at \(p_0\), yielding a high AUC-PR value (\(\approx p_0\)) despite providing limited false-positive detection.
The false acceptance rate (FAR) directly captures this failure mode by measuring the fraction of false matches that are accepted. A verifier may therefore achieve high AUC-PR while having FAR close to 1.0, indicating that it provides little protection against false loop closures. To better characterize system reliability, we evaluate verification methods using a novel precision, coverage, and FAR triplet together with risk-coverage curves.
3.3.1 Precision-Coverage-FAR Triplet↩︎
Let \(\text{TP}_\tau\), \(\text{FP}_\tau\), \(\text{TN}_\tau\), and \(\text{FN}_\tau\) denote true positives, false positives, true negatives, and false negatives at a fixed operating threshold, \(\tau\), and let \(N\) be the total number of query-candidate pairs. We define:
\[\begin{align} \mathcal{P}_\tau &= \text{TP}_\tau / (\text{TP}_\tau + \text{FP}_\tau), \tag{1} \\[3pt] \mathcal{C}_\tau &= (\text{TP}_\tau + \text{FP}_\tau) / N, \tag{2} \\[3pt] \text{FAR}_\tau &= \text{FP}_\tau / (\text{FP}_\tau + \text{TN}_\tau) \tag{3} \end{align}\]
Precision measures the correctness of accepted matches. Coverage measures the fraction of queries for which the system provides an accepted match, preventing methods from achieving high precision by rejecting almost all candidates. FAR measures the proportion of false positives that are accepted, penalising methods that achieve high coverage by accepting matches indiscriminately. No single metric captures all aspects of system reliability. Together, precision, coverage, and FAR characterize both safety (precision and FAR) and availability (coverage).
To enable comparison across methods, we define a composite score using the harmonic mean of precision \(\mathcal{P}\), coverage \(\mathcal{C}\), and \((1-\text{FAR})\):
\[\mathcal{S} = \frac{3}{\dfrac{1}{ \mathcal{P}_\tau} + \dfrac{1}{\mathcal{C}_\tau} + \dfrac{1}{1 - \text{FAR}_\tau}}. \label{eq:score}\tag{4}\]
This formulation penalizes poor performance in any dimension and reduces the influence of extreme values.
3.3.2 Risk-Coverage Curves↩︎
Risk-coverage curves are constructed by varying the decision threshold \(\tau\) and plotting risk \(\mathcal{R}_\tau.\) against coverage \(\mathcal{C}_\tau.\), where: \[\begin{align} \mathcal{R} = 1-\mathcal{P}_\tau \end{align}\] A lower risk-coverage curve indicates lower false acceptance rates for a given level of system availability.
This framework exposes failure modes missed by AUC-PR, distinguishing methods that genuinely reject false loop closures from those that achieve high precision through indiscriminate acceptance or rejection.
4 EXPERIMENTAL SETUP↩︎
This section outlines the datasets, VPR methods, VLM model configurations, auditing protocol, and evaluation metrics used throughout the experiments for reliable loop closure without environment-specific threshold calibration.
4.1 Datasets↩︎
We evaluate the proposed auditing framework on six widely used VPR benchmarks covering diverse deployment challenges, including perceptual aliasing, appearance variation, and long-term distribution shift. Table 1 summarizes the datasets, their challenges, and evaluation protocols.
4.2 Visual Place Recognition Methods↩︎
To evaluate generalization across retrieval pipelines, we consider five state-of-the-art VPR architectures spanning global descriptor learning, aggregation-based methods, and transformer-based approaches: EigenPlaces, MixVPR, CosPlace, NetVLAD, and SALAD. For each method, we follow the standard evaluation protocol and use the top-1 retrieved image as the candidate match.
4.3 Vision-Language Models↩︎
We evaluate four VLMs spanning proprietary and open-weight families, covering different model scales and training paradigms. All models use a unified inference pipeline to ensure comparability and avoid confounding effects from prompt design or implementation. Closed-source models. We include OpenAI GPT-4.1 (gpt-4.1) and Google’s Gemini-3-Flash-Preview (gemini-3-flash-preview) due to their strong multimodal reasoning capabilities. Open-weight models. We evaluate Alibaba’s Qwen2.5-VL family, including Qwen2.5-VL-7B-Instruct and Qwen2.5-VL-32B-Instruct (Qwen/Qwen2.5-VL-7B-Instruct and Qwen/Qwen2.5-VL-32B-Instruct on Hugging Face), using publicly available checkpoints and inference code for reproducibility.
All experiments were conducted in March 2026. Since GPT-4.1 and Gemini-3-Flash-Preview are provider-managed model aliases rather than fixed snapshots, their behaviour may change over time. Results for Qwen models are reproducible from the cited checkpoints.
4.4 Prompting and Decision Protocol↩︎
The auditing decision is obtained by prompting the VLM with the query and candidate image. The prompt is designed to encourage structured reasoning and discourage reliance on superficial visual similarity. Specifically, the VLM is instructed to: (i) identify permanent structural elements in both images, (ii) compare their spatial configuration, and (iii) actively search for inconsistencies. Dynamic elements such as vehicles, pedestrians, lighting, and weather conditions are explicitly ignored. The prompt does not provide dataset-specific calibration information, the VLM directly produces an instance-level verification decision based on the semantic and structural evidence present in each image pair.
The VLM outputs a structured JSON response containing:
{
"is_same_place": true or false,
"reasoning": "Both images show ....."
}
The final auditing decision is derived directly from the binary is_same_place field, while the reasoning field provides interpretable justification for qualitative analysis. In rare occurrences where the VLM refuses to answer or produces an invalid response, the retrieved match is retained and treated as accepted by the auditor.
4.5 Evaluation Metrics↩︎
We evaluate all verification methods using Recall@1, the precision-coverage-FAR triplet, and risk-coverage curves defined in Section 3. For VLM-based auditing, the binary decision is derived directly from the is_same_place field and requires no threshold calibration, validation data, or environment-specific tuning. For baseline methods producing confidence scores, we evaluate two operating points, a fixed threshold of 0.5 after normalization, and a threshold that maximises the harmonic mean of precision and coverage using ground-truth labels as an optimistic estimate achievable through manual calibration.
1.5pt
l|l|cc|cc|cc|cc|cc|cc & & & & & & &
(lr)3-14 & & Base & +VLM & Base & +VLM & Base & +VLM & Base & +VLM
& Base & +VLM & Base & +VLM
& Gemini & & 0.73 & & 0.95 & & 0.96 & & 1.00 & & 0.98 & & 0.91
& GPT & & 0.72 & & 0.95 & & 0.94 & & 1.00 & & 0.97 & & 0.93
& Qwen-7b & & 0.74 & & 0.97 & & 0.97 & & 1.00 & & 0.99 & & 1.00
& Qwen-32b & & 0.62 & & 0.95 & & 0.94 & & 0.99 & & 0.98 & & 0.99
& Gemini & & 0.71 & & 0.96 & & 0.97 & & 1.00 & & 0.98 & & 0.92
& GPT & & 0.71 & & 0.96 & & 0.94 & & 1.00 & & 0.96 & & 0.94
& Qwen-7b & & 0.73 & & 0.97 & & 0.97 & & 1.00 & & 0.99 & & 1.00
& Qwen-32b & & 0.62 & & 0.96 & & 0.95 & & 1.00 & & 0.97 & & 1.00
& Gemini & & 0.71 & & 0.96 & & 0.96 & & 1.00 & & 0.96 & & 0.92
& GPT & & 0.71 & & 0.96 & & 0.95 & & 1.00 & & 0.94 & & 0.94
& Qwen-7b & & 0.75 & & 0.97 & & 0.98 & & 1.00 & & 0.99 & & 1.00
& Qwen-32b & & 0.61 & & 0.96 & & 0.94 & & 1.00 & & 0.96 & & 0.98
& Gemini & & 0.62 & & 0.92 & & 0.95 & & 0.94 & & 0.96 & & 0.72
& GPT & & 0.69 & & 0.91 & & 0.92 & & 0.94 & & 0.97 & & 0.77
& Qwen-7b & & 0.74 & & 0.94 & & 0.95 & & 0.93 & & 0.98 & & 0.97
& Qwen-32b & & 0.57 & & 0.92 & & 0.92 & & 0.84 & & 0.98 & & 0.98
& Gemini & & 0.78 & & 0.96 & & 0.98 & & 1.00 & & 1.00 & & 0.95
& GPT & & 0.76 & & 0.96 & & 0.96 & & 1.00 & & 0.99 & & 0.96
& Qwen-7b & & 0.74 & & 0.98 & & 0.99 & & 1.00 & & 1.00 & & 1.00
& Qwen-32b & & 0.70 & & 0.97 & & 0.97 & & 1.00 & & 1.00 & & 1.00
5 RESULTS↩︎
We evaluate VLM auditing from three perspectives: improvement in Recall@1 compared with VPR and verification baselines (Sec. 5.1), safety–availability trade-offs using precision, coverage, and FAR (Sec. 5.2, 5.3), and the limitations of AUC-PR as a verification metric (Sec. 5.4).
5.1 Recall@1 Comparison↩︎
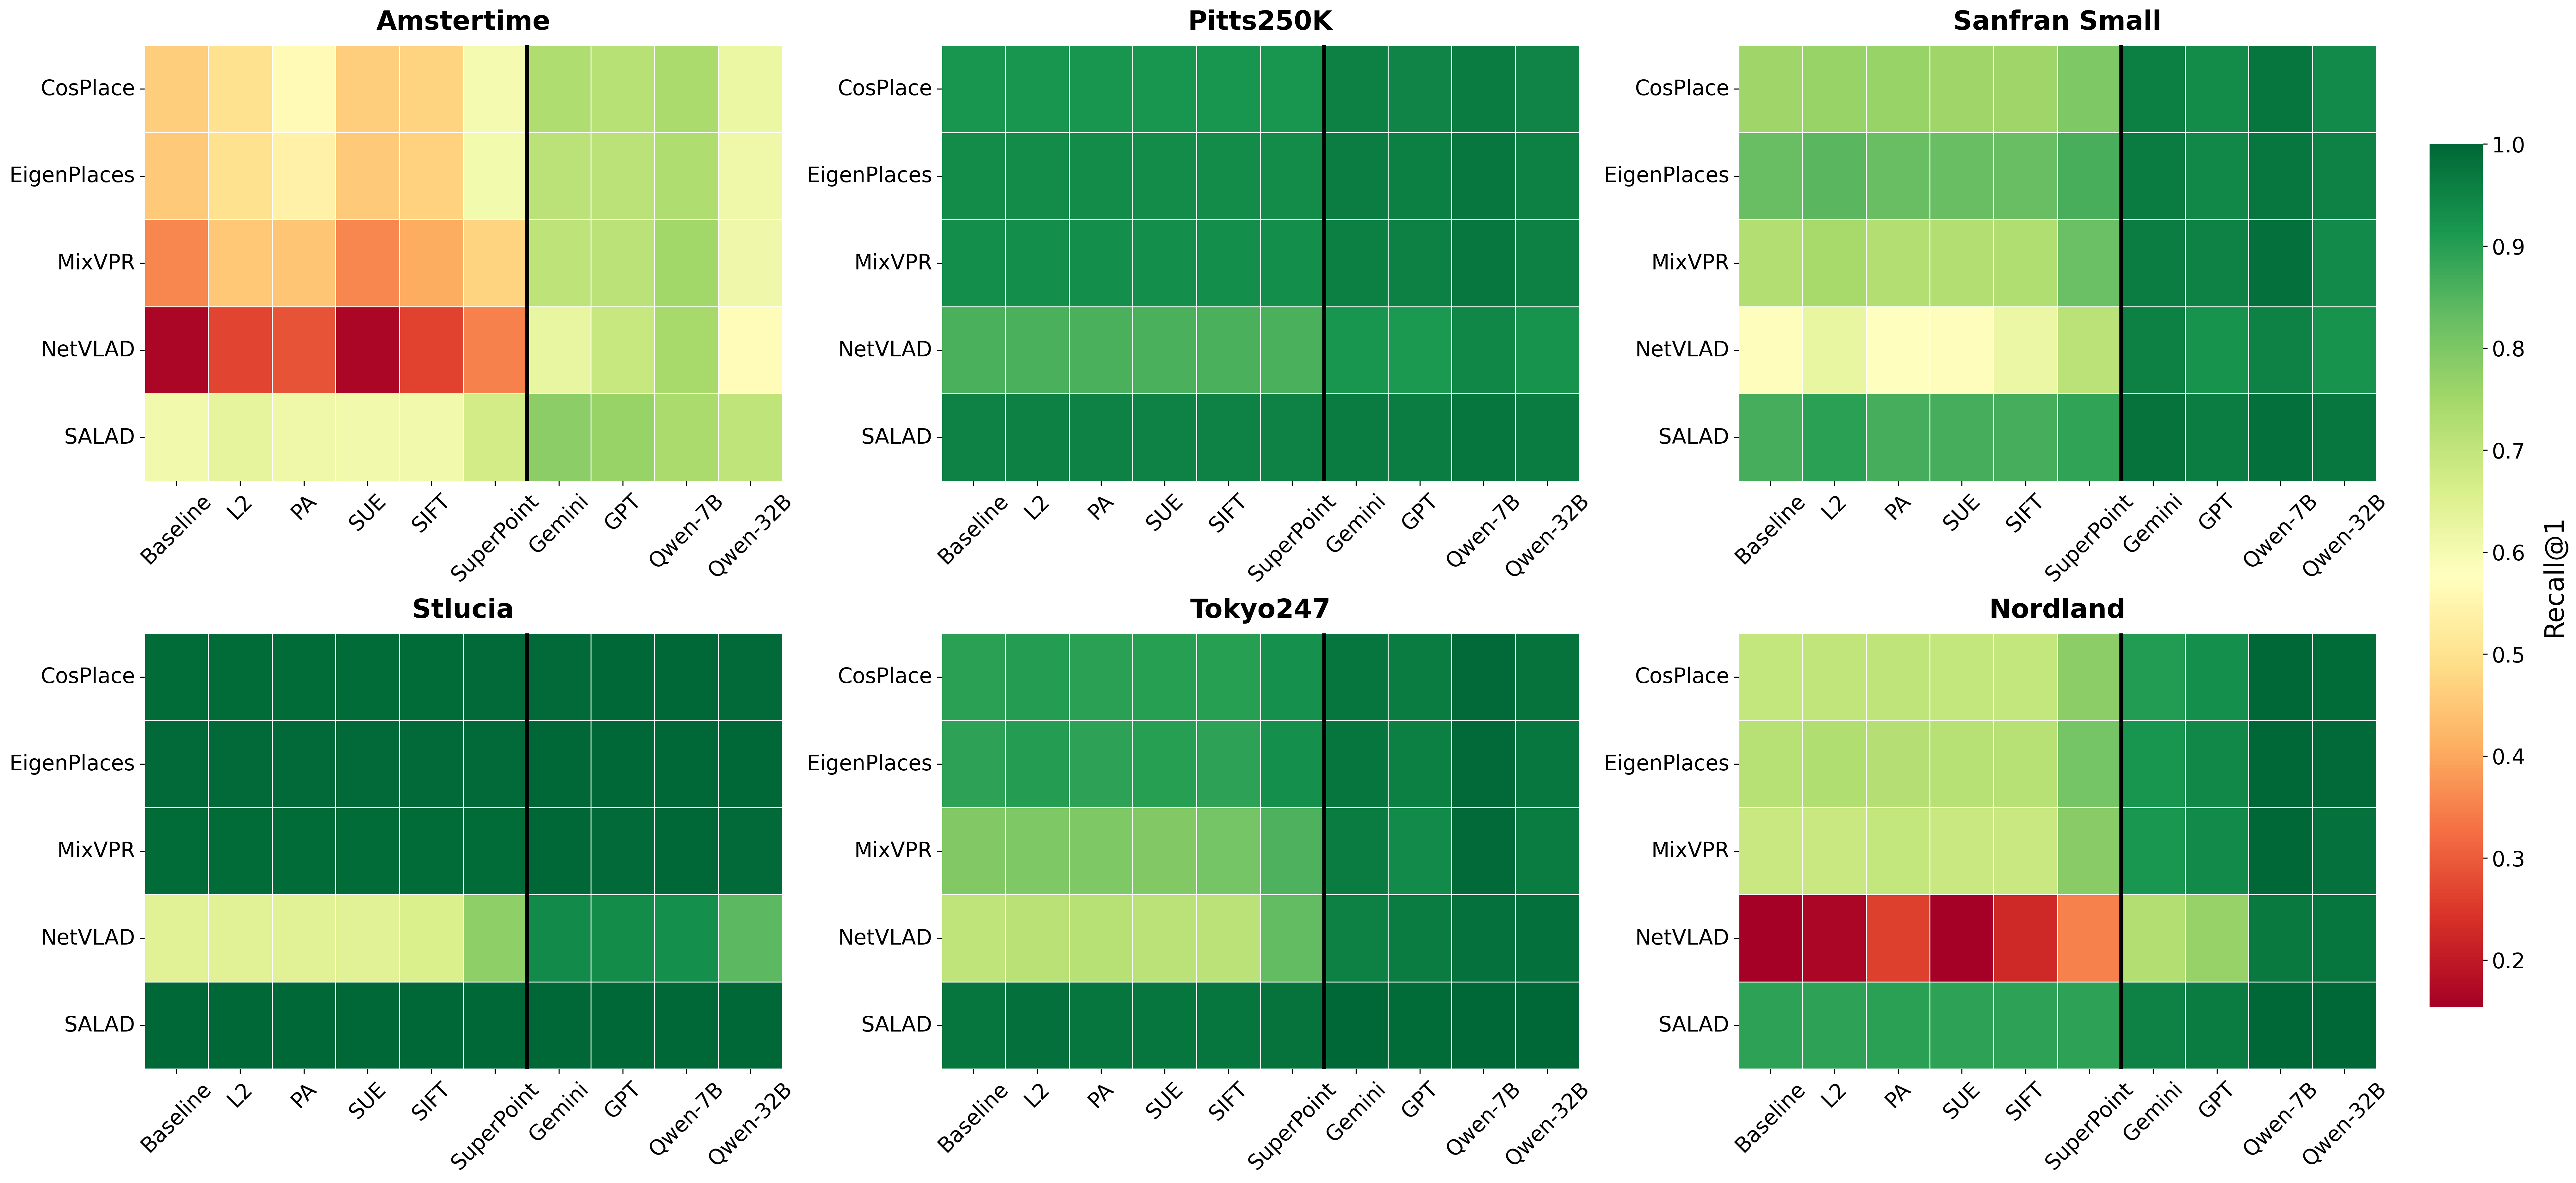
We report results across six benchmark datasets and five VPR backbones, using four VLMs (GPT-4.1, Gemini-3-Flash-Preview, Qwen-32b and Qwen-7b) and five baseline verification methods (L2 distance, PA score, SIFT, SuperPoint, and SUE). Table ¿tbl:tab:vpr95vlm95results? compares recall@1 for baseline VPR and VLMs. On average VLMs improve recall@1 by 13.6%, with the largest gains on challenging datasets: AmsterTime improves from 0.16–0.61 to 0.62–0.78, while Nordland from 0.15–0.89 to 0.91–1.00.
Beyond the baseline VPR methods, we compare VLM auditing against conventional verification methods. Fig. 2 shows Recall@1 for each verifier at its selected operating point. VLMs consistently outperform all verification baselines. SuperPoint, the strongest conventional baseline, improves Recall@1 by only 0–13% over the VPR baselines (0 on Pitts250k, 13% on AmsterTime), whereas VLM verification provides 5–36% improvements on the same datasets (5% on Pitts250k, 33% on Amstertime).
AmsterTime represents the most challenging dataset, with baseline Recall@1 ranging from 0.16 to 0.61, whereas Pitts250k and StLucia already achieve 0.92 average Recall@1. Datasets with already-high baseline recall@1 provide little room for verification method analysis based on improvements in recall@1 alone, making FAR the primary discriminating metric on those datasets in Sec. 5.2.
| Datasets \(\rightarrow\) | AmsterTime | Pitts250k | SanFran | StLucia | Tokyo247 | Nordland | |||||||||||||||||||
|---|---|---|---|---|---|---|---|---|---|---|---|---|---|---|---|---|---|---|---|---|---|---|---|---|---|
| Method \(\downarrow\) | \(\mathcal{P}\) | \(\mathcal{C}\) | FAR | \(\mathcal{S}\) | \(\mathcal{P}\) | \(\mathcal{C}\) | FAR | \(\mathcal{S}\) | \(\mathcal{P}\) | \(\mathcal{C}\) | FAR | \(\mathcal{S}\) | \(\mathcal{P}\) | \(\mathcal{C}\) | FAR | \(\mathcal{S}\) | \(\mathcal{P}\) | \(\mathcal{C}\) | FAR | \(\mathcal{S}\) | \(\mathcal{P}\) | \(\mathcal{C}\) | FAR | \(\mathcal{S}\) | Avg. \(\mathcal{S}\) |
| (a) \(\tau \geq0.5\) on normalized confidence scores (label-free threshold) | |||||||||||||||||||||||||
| L2 | 0.83 | 0.06 | 0.02 | 0.16 | 0.99 | 0.11 | 0.05 | 0.28 | 0.98 | 0.38 | 0.02 | 0.64 | 0.99 | 0.58 | 0.00 | 0.80 | 0.99 | 0.28 | 0.01 | 0.54 | 0.82 | 0.25 | 0.05 | 0.48 | 0.48 |
| PA | 0.99 | 0.03 | 0.00 | 0.09 | 1.00 | 0.04 | 0.00 | 0.10 | 1.00 | 0.05 | 0.00 | 0.13 | 1.00 | 0.09 | 0.00 | 0.24 | 1.00 | 0.12 | 0.00 | 0.30 | 1.00 | 0.07 | 0.00 | 0.19 | 0.17 |
| SIFT | 0.49 | 0.65 | 0.57 | 0.51 | 0.94 | 0.92 | 0.72 | 0.52 | 0.80 | 0.86 | 0.68 | 0.55 | 0.95 | 0.91 | 0.54 | 0.69 | 0.88 | 0.90 | 0.64 | 0.59 | 0.73 | 0.63 | 0.39 | 0.65 | 0.59 |
| SUE | 0.40 | 0.07 | 0.08 | 0.18 | 0.92 | 0.97 | 0.94 | 0.16 | 0.95 | 0.28 | 0.06 | 0.53 | 0.92 | 0.93 | 0.91 | 0.23 | 0.87 | 0.87 | 0.72 | 0.51 | 0.56 | 0.14 | 0.19 | 0.30 | 0.32 |
| SuperPoint | 0.84 | 0.04 | 0.01 | 0.10 | 1.00 | 0.02 | 0.00 | 0.07 | 1.00 | 0.09 | 0.00 | 0.23 | 1.00 | 0.22 | 0.00 | 0.46 | 1.00 | 0.30 | 0.00 | 0.56 | 1.00 | 0.02 | 0.00 | 0.05 | 0.25 |
| (b) \(\tau=\) best harmonic mean of precision and coverage (ground-truth dependent) | |||||||||||||||||||||||||
| L2 | 0.47 | 0.79 | 0.72 | 0.43 | 0.92 | 1.00 | 0.99 | 0.02 | 0.77 | 0.96 | 0.85 | 0.33 | 0.92 | 1.00 | 0.88 | 0.28 | 0.86 | 0.99 | 0.88 | 0.29 | 0.63 | 0.94 | 0.93 | 0.18 | 0.26 |
| PA | 0.49 | 0.74 | 0.66 | 0.48 | 0.92 | 1.00 | 1.00 | 0.00 | 0.75 | 0.99 | 0.98 | 0.05 | 0.92 | 1.00 | 1.00 | 0.00 | 0.86 | 1.00 | 0.98 | 0.05 | 0.65 | 0.89 | 0.86 | 0.31 | 0.15 |
| SIFT | 0.44 | 0.86 | 0.82 | 0.33 | 0.92 | 1.00 | 1.00 | 0.00 | 0.76 | 0.98 | 0.95 | 0.12 | 0.93 | 0.99 | 0.99 | 0.04 | 0.86 | 0.99 | 0.97 | 0.08 | 0.64 | 0.91 | 0.90 | 0.23 | 0.13 |
| SUE | 0.41 | 1.00 | 1.00 | 0.00 | 0.92 | 1.00 | 1.00 | 0.00 | 0.75 | 1.00 | 1.00 | 0.00 | 0.92 | 1.00 | 1.00 | 0.00 | 0.86 | 1.00 | 0.97 | 0.08 | 0.63 | 1.00 | 1.00 | 0.00 | 0.01 |
| SuperPoint | 0.54 | 0.72 | 0.57 | 0.54 | 0.92 | 1.00 | 1.00 | 0.00 | 0.82 | 0.91 | 0.69 | 0.54 | 0.95 | 0.96 | 0.66 | 0.59 | 0.90 | 0.94 | 0.66 | 0.59 | 0.72 | 0.81 | 0.63 | 0.56 | 0.47 |
| Vision–Language Models (Zero-shot decision) | |||||||||||||||||||||||||
| Gemini | 0.71 | 0.55 | 0.28 | 0.65 | 0.95 | 0.95 | 0.59 | 0.66 | 0.96 | 0.77 | 0.12 | 0.86 | 0.99 | 0.93 | 0.29 | 0.86 | 0.97 | 0.87 | 0.16 | 0.89 | 0.88 | 0.68 | 0.23 | 0.77 | 0.78 |
| GPT-4.1 | 0.72 | 0.54 | 0.28 | 0.65 | 0.95 | 0.96 | 0.65 | 0.61 | 0.94 | 0.79 | 0.20 | 0.84 | 0.99 | 0.93 | 0.30 | 0.85 | 0.96 | 0.88 | 0.27 | 0.85 | 0.91 | 0.64 | 0.16 | 0.78 | 0.76 |
| Qwen-7B | 0.74 | 0.18 | 0.09 | 0.37 | 0.97 | 0.82 | 0.36 | 0.78 | 0.97 | 0.60 | 0.06 | 0.80 | 0.98 | 0.80 | 0.28 | 0.82 | 0.99 | 0.55 | 0.02 | 0.78 | 0.99 | 0.01 | 0.00 | 0.03 | 0.60 |
| Qwen-32B | 0.62 | 0.52 | 0.36 | 0.59 | 0.95 | 0.94 | 0.61 | 0.64 | 0.94 | 0.70 | 0.16 | 0.82 | 0.97 | 0.94 | 0.38 | 0.81 | 0.98 | 0.76 | 0.10 | 0.87 | 0.99 | 0.13 | 0.00 | 0.30 | 0.67 |
3.5pt 0.8pt
5.2 Precision, Coverage, and FAR Triplet↩︎
Table 2 reports precision, coverage, FAR, and the aggregate score \(\mathcal{S}\) averaged across VPR backbones. For uncertainty baselines, we report results at both a label-free threshold (confidence score\(\geq0.5\) after normalization), consistent with the paper’s deployment constraint and at \(\tau\) which maximizes the harmonic mean of precision and coverage using ground-truth labels.
The aggregate score penalizes methods that optimize only one dimension, such as achieving high precision by rejecting nearly all queries (e.g., Qwen-7B on Nordland: P = 1.00, C = 0.01) or maintaining high coverage while accepting false positives (e.g., SuperPoint on Pitts250k: C = 1.00, FAR = 1.00). VLMs achieve the strongest overall trade-off, with Gemini and GPT-4.1 obtaining average \(\mathcal{S}\) of 0.78 and 0.76 respectively. In contrast, uncertainty baselines are highly sensitive to threshold selection, with rankings changing substantially between the two thresholds. However, the avg \((\mathcal{S})\) for all uncertainty baselines remains significantly lower than VLMs indicating that retrieval embedding-based uncertainty signals provide limited verification capability.
FAR reveals a substantial safety gap between conventional verification and VLM auditing. Under label-free thresholding, uncertainty methods often achieve low FAR only by severely reducing coverage (e.g., PA and SuperPoint accept fewer than 30% of queries). Whereas under best precision-coverage threshold, these methods frequently maintain FAR between 0.7-1.0, accepting most incorrect retrievals. Conventional baselines depend heavily on the threshold-selection, whereas VLM verification has no such limitations and reduces FAR while maintaining practical precision and coverage. Gemini and GPT-4.1 achieve FAR below 0.30 across most datasets with high precision and coverage.
These results suggest that estimating retrieval correctness using statistics derived from the same representation that produced the retrieval is fundamentally limited. Methods incorporating independent geometric reasoning (SuperPoint and SIFT) perform noticeably better than embedding-based uncertainty measures, while semantic reasoning from VLMs provides the largest improvement.

5.3 Risk-Coverage Analysis↩︎
Fig. 3 shows risk-coverage curves for all datasets, with uncertainty baselines swept across all thresholds and VLM operating points plotted as fixed markers.
The curves reveal a structural limitation of conventional verification methods, uncertainty estimates are concentrated toward the upper-right region of the plots, maintaining high coverage with high risk. Uncertainty metrics can reduce risk only by sacrificing large fractions of coverage, often degenerating toward near-zero acceptance before reaching meaningful risk reductions. This behavior is evident on AmsterTime which has an unfiltered risk of 0.59. At the given point, uncertainty baselines accept 72–100% of queries at risk 0.46–0.59. They provide limited risk reduction until coverage collapses whereas VLMs achieve substantially lower risk at practical coverage levels.
Across the remaining datasets, VLMs consistently operate at lower risk than conventional baselines at comparable coverage. For example, on SanFran, Tokyo247, and StLucia, Gemini and GPT-4.1 achieve approximately 2–6\(\times\) lower risk than the strongest conventional baselines at the same coverage. Pitts250k shows smaller differences because baseline retrieval performance is already high, but VLMs still provide lower FAR at comparable coverage.
A structural asymmetry therefore emerges. Uncertainty metrics offer a tunable trade-off, allowing selecting any point along the curve, whereas VLMs provide a fixed but generally superior operating point. Very low risk can always be achieved by thresholding uncertainty metrics more aggressively, but at the cost of rejecting nearly all queries.
5.4 Limitations of AUC-PR↩︎
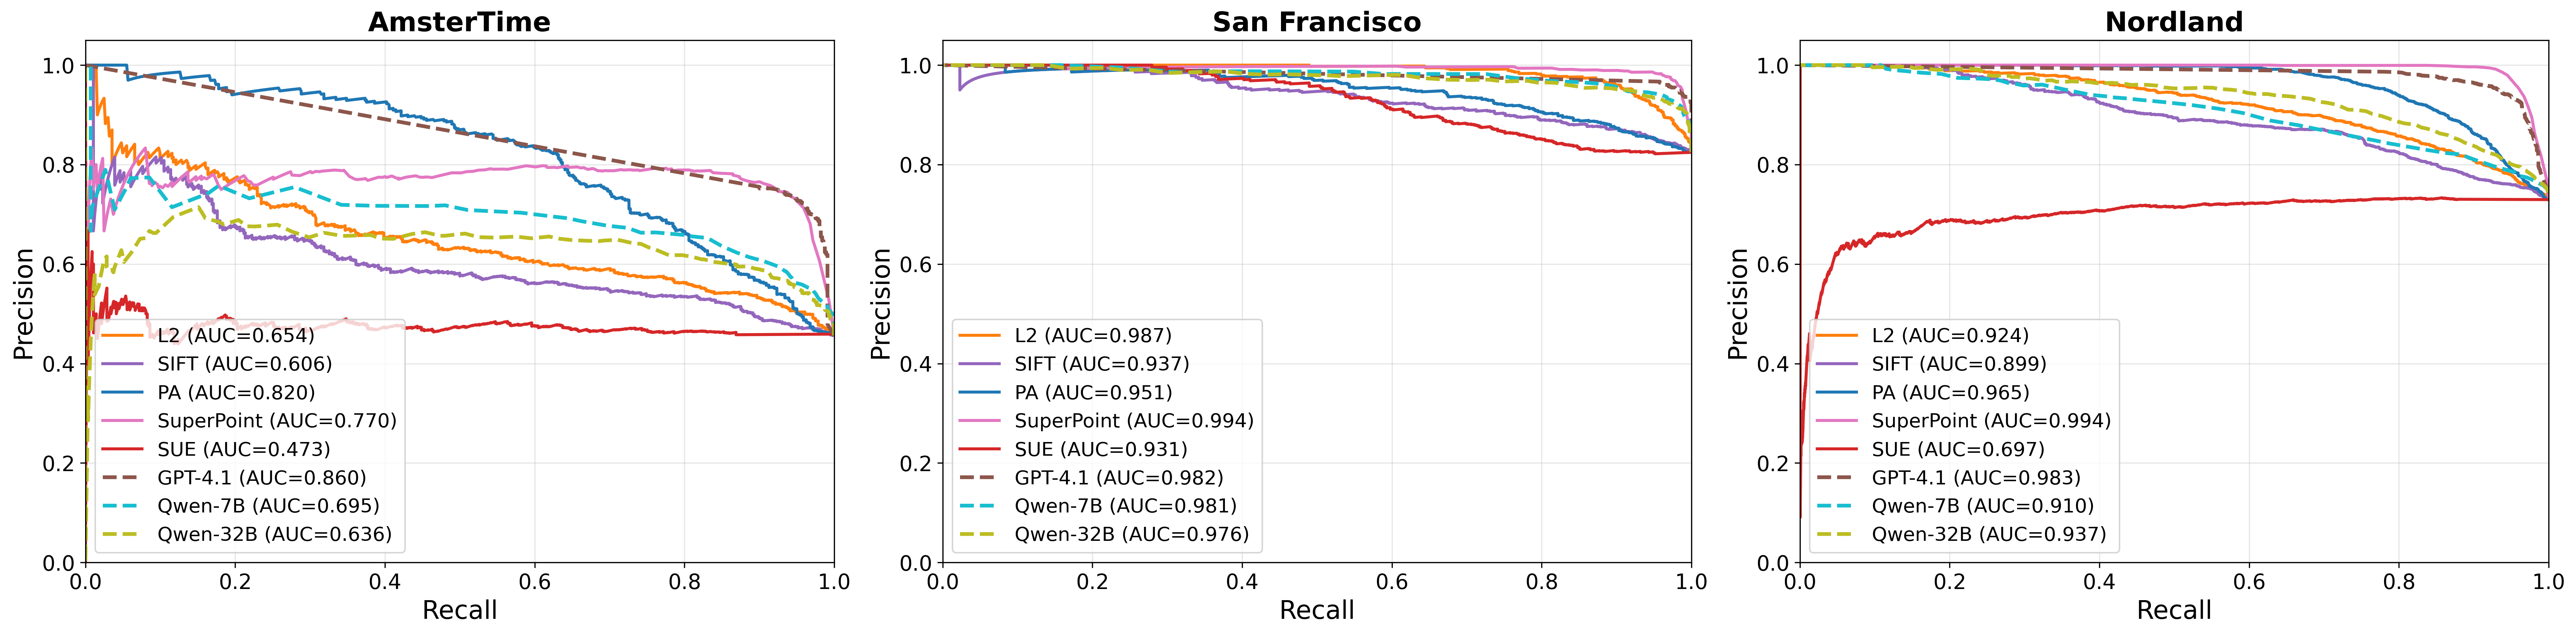
Figure 4 shows precision-recall curves for three datasets (AmsterTime, SanFran and Nordland) evaluated with EigenPlaces as the retrieval backbone. Conventional verification method curves are generated by thresholding the uncertainty scores, while VLM curves use the token-level logit probability of true as a confidence score, making the two directly comparable. Across all three datasets, VLMs achieve competitive or superior AUC-PR compared to baselines. On AmsterTime, GPT-4.1 achieves an AUC-PR of 0.86, while the best verification baseline (PA-score) reaches 0.81. On SanFran and Nordland, both VLMs and baseline methods exceed 0.91, making their performance appear largely equivalent. This apparent equivalence highlights the limitation of AUC-PR for verification task. AUC-PR aggregates performance across every confidence threshold, whereas a deployed verification system operates at a single threshold. Consequently, methods with similar AUC-PR can exhibit substantially different behavior once a threshold is selected.
On Pitts250k, where baseline Recall@1 is already approximately 92%, baseline verification methods achieve high AUC-PR values despite FAR values of 0.98–1.00, accepting nearly every false positive. Similarly, on Nordland, L2 and Qwen-7B achieve comparable AUC-PR despite fundamentally different behavior. L2 accepts almost all matches (FAR=0.93, coverage=0.94), whereas Qwen-7B rejects almost all matches (FAR=0.00, coverage=0.01). These results show that the precision-coverage-FAR triplet directly addresses AUC-PR’s blind spots.
5.5 Discussion↩︎
Our failure analysis indicates that VLMs improve verification without introducing fundamentally new failure modes. Across all experiments, 99% of VLM false-positive acceptances occur on image pairs that are also incorrectly accepted by conventional verification methods. VLMs inherit a strict subset of the image pairs that remain difficult to verify for embedding- and geometry-based approaches, while successfully rejecting many false positives that conventional methods fail to identify. The dominant remaining failure mode is therefore reduced coverage. Interestingly, the causes of false rejection differ across models. Gemini and GPT-4.1 typically reject image pairs due to structural differences introduced by viewpoint changes (e.g., differing numbers of visible railway tracks or poles), whereas Qwen frequently cites dynamic scene attributes that the prompt instructs it to ignore (e.g., snow cover or seasonal lighting changes), suggesting that reduced coverage is driven by weaker instruction following rather than visual reasoning limitations.
6 CONCLUSION↩︎
We introduced VPR Auditing, a post-retrieval verification framework that uses VLMs to independently assess the correctness of VPR matches, without relying on the descriptor space that produced them. Our results demonstrate that VLM-based auditing enables safer VPR deployment, along with achieving state-of-the-art results, and removes the need for manually selected operating points, specially in unknown environments without access to ground truth.
References↩︎
\(^{1}\)Sania Waheed and Sarvapali D. Ramchurn are with the School of Electronics and Computer Science, University of Southampton, Southampton SO17 1BJ.
(sw1m24@soton.ac.uk; sdr1@soton.ac.uk)↩︎\(^{2}\)M. Milford is with the School of Electrical Engineering and Computer Science, Queensland University of Technology, Brisbane, QLD 4000, Australia.
(michael.milford@qut.edu.au)↩︎\(^{1,3}\)Shoaib Ehsan is with the School of Electronics and Computer Science, University of Southampton, SO17 1BJ Southampton, U.K., and also with the School of Computer Science and Electronic Engineering, University of Essex, CO4 3SQ Colchester, U.K.
(s.ehsan@soton.ac.uk)↩︎