Automatic Testing of Interacting Autonomous Vehicles
July 14, 2026
Abstract
Autonomous vehicles (AVs) must be thoroughly tested to meet high safety standards and avoid endangering both AV passengers and road users. Scenario-based testing implements driving scenarios in virtual simulation environments as a cost-effective alternative to field testing. Common scenario-based testing approaches set the environment and the surrounding traffic and test a single AV. Recent studies show that the approaches that test single AVs miss critical behaviors that emerge from interactions among multiple AVs. Effective approaches to test scenarios that emerge from n-way interactions must address the combinatorial explosion that the presence of multiple AVs further exacerbates.
In this paper, we propose EVITA, an approach that leverages multi-objective optimization to generate scenarios that trigger multiple and diverse AVs interactions, while minimizing the complexity of the generated scenarios, to effectively
test multiple interacting AVs and reveal safety-critical scenarios that current approaches overlook. The experimental results that we discuss in this paper confirm that EVITA triggers a higher variety of AVs interactions than state-of-the-art
approaches, thus improving the likelihood to reveal safety-critical behaviors.
1 Introduction↩︎
Autonomous vehicles (AVs) are increasingly tested in the real world [1], both in driverless mode or with a safety driver on board [2]. At the time of writing, there are more than \(1,400\) AVs of over \(80\) manufacturers that test the vehicles across the USA [3], and \(16,000\) test licenses for autonomous vehicles issued in China [4]. The physical testing of AVs in the real world is constrained by regulatory and environmental factors, and is expensive [5]. AVs must abide by road signs (static elements) and traffic lights (dynamic elements), and must coordinate with other vehicles (reactive elements) driven by humans and other AVs, to avoid dangerous interactions [6], hazardous situations [7], [8], and large-scale disruptions, such as roadblocks [9], bbc-waymo?.
Testing of AVs in simulation has been widely adopted in academia and industry as a cost-effective alternative to field testing [10], [11] and as the only viable solution for testing AVs under conditions unlikely to be observed or too dangerous to reproduce in the real world.
Scenario-based testing creates driving scenarios that challenge the AVs under test, referred to as the ego-vehicles, to expose misbehavior that results in collisions and traffic law violations [12]. State-of-the-art scenario-based testing approaches target single AVs. They test an \(\mathit{av}\) against pre-programmed Non-Playable Characters (NPCs) that are road users, either completely non-interactive or behaving according to simplistic models ([13]–[15]). They rarely involve other scenario elements, such as traffic lights and road signs [16]. Testing a single \(\mathit{av}\) against pre-programmed NPCs does not assess the mutual reactions of multiple vehicles on the road [17] and, consequently, overlooks issues that may cause accidents that state-of-the-art approaches miss [18]. Figure 1 exemplifies the critical scenarios that emerge from the mutual interactions among AVs. Figures 1 (a) and 1 (b) show that the \(\mathit{av}\)(in red in the figures) avoids the collision with the NPC (in purple in the figures), while two AVs starting with the same initial and final positions do not avoid the collision, due to their mutual interactions (Figure 1 (c)). The example shows that the behavior of the ego-vehicle depends on its expectations about surrounding traffic behavior, and single-AV scenarios fail to capture when AVs adjust their trajectories in response to nearby vehicles. As the number and diversity of AVs on public roads steadily increase [1], [19], the chances of mutually interacting AVs that lead to hazardous situations highly increase.



Figure 1: Motivating example: Testing two vehicles with the same initial and final positions, and trajectories. a — The \(\mathit{av}\)(in red) avoids the collision with the NPC (in purple), b — The \(\mathit{av}\)(in red) avoids the collision with the NPC (in purple), c — The two AVs(in red) collide
In this paper, we address the shortcomings of single-AV scenario-based testing by introducing interaction testing, a methodology to generate critical scenarios that systematically test interactions influencing the behavior of the AVs under test. Testing AVs against system-level interactions can reveal hazards that arise from emergent behaviors triggered by a difficult-to-predict interplay among multiple influencing factors, and that would otherwise go undetected. Multi-AVs scenarios provide a more realistic approximation of traffic behavior than single-AVs scenarios, in which simple, inflexible logic controls the road users.
We introduce EVITA, EVolutionary Interaction Testing Approach, an interaction testing approach for automatically generating critical scenarios involving multiple AVs in both highway and urban traffic, with traffic lights and road
signs. EVITA leverages multi-objective optimization to generate scenarios that maximize the number and variety of interactions, while reducing scenario complexity by keeping the number of AVs to a minimum. EVITA aims to expose
safety-critical (mis-)interactions and collisions that involve multiple interacting AVs and that might be difficult to replicate using pre-programmed behaviors in single-AV scenarios.
We evaluate EVITA against two experimental setups: FrenetiX for highways and suburban roads, and Baidu Apollo for urban scenarios. FrenetiX [20] is an open-source, highly performing motion planner that we tested in scenarios using replicas of real-life highways and suburban roads. We experimented with the FrenetiX multi-agent platform [21] developed for Common``Road [22], an
established and well-maintained simulation framework widely used in research.1 Baidu Apollo [23] is an industrial-scale autonomous driving agent that we use to evaluate EVITA in complex urban scenarios featuring intersections, traffic lights, and road signs. We extend Huai et al.’s Baidu Apollo
framework [18] adopted by Doppel``Test, with additional interaction monitors, and new data analyses.
The results that we discuss in Section 5 show that EVITA consistently triggers diverse AVs interactions and identifies a broad range of critical scenarios, outperforming Doppel``Test, the
only state-of-the-art open-source approach that, to the best of our knowledge, can generate scenarios involving multiple AVs.
This paper contributes to testing AVs by
defining interaction testing, a methodology for exploring emergent behaviors resulting from the interplay of AVs and other traffic-influencing factors;
proposing
EVITA, an interaction testing approach to systematically generate scenarios that involve AVs interactions in driving simulations;presenting an extensive evaluation involving multiple simulators, AVs systems, and diverse road environments.
EVITA’s source code, data, and scripts to replicate the experiments are available in the replication package [24].
The remainder of this paper is organized as follows: Section 2 introduces background concepts to make the paper self-contained. Section 3 introduces our novel notion of
interactions, central to EVITA, which is presented in Section 4. Section 5 presents the evaluation methodology, including research questions, experimental settings,
and executed experiments. Section 6 presents the obtained results. Section 7 discusses threats to the validity of our conclusions. Section 8
reviews related work, before Section 9 concludes the paper.
2 Multi-AV CommonRoad Driving Scenarios↩︎
The COMposable benchmarks for MOtioN planning on ROADs (Common``Road) framework is an established, open-source framework that supports researchers in developing and validating motion planners, the core components of autonomous
vehicles [22]. It offers open access to a large database of synthetic and realistic traffic scenarios [25] and the possibility to import scenarios defined in other standards, such ASAM OpenScenario [26] and OpenDrive [27].

Figure 2 shows an example of a Multi-AV CommonRoad highway scenario. The colored arrows represent the initial position and direction of the AVs, whereas the colored rectangles identify the goal areas each \(\mathit{av}\) must reach. Some goal areas overlap; thus, not all goal areas are visible in the figure. Common``Road’s multi-AV scenarios comprise
a road network encoded in the Lanelet2 [28] format that describes the “drivable” areas of the map as lanelets that are polygons linked together to form the network (tiny light gray triangles indicate the direction of the traffic in the figure),
a set of obstacles representing static objects and dynamic traffic participants having geometric and kinematic properties (for instance AVs during simulation),
a set of scenario elements such as line markings, road signs, and traffic lights (not present in the figure),
a set of planning problems that encode driving tasks. Each planning problem is assigned to an \(\mathit{av}\) and specifies both the initial state \(\mathit{s}_{av}^{t_{0}}\) and the target states. States have attributes defining each \(\mathit{av}\)’s initial or expected position, rotation, velocity, and acceleration, which can be either precise values or intervals. In Figure 2, the initial states are represented as colored arrows with precise position and direction, whereas the target states are depicted as rectangles that identify intervals over longitudinal and lateral positions, with matching colors.
EVITA generates multi-AV scenarios by specifying for each \(\mathit{av}\):
the initial position, rotation, and speed as values; and
the target position and timeout as intervals.
EVITA defines a conservative timeout to complete the driving tasks (\(\mathit{max\_}\-\mathit{time\_}\-\mathit{step}\)), to avoid over-constraining the planning problems. It ensures that the AVs start on the
road and that their planning problems are satisfiable, to avoid generating invalid or irrelevant scenarios (see Section 4.5).
Common``Road works with logical time and unfolds the scenario simulations in discrete simulation steps. EVITA uses the default simulation step duration of \(0.1\) seconds. During
simulation, EVITA monitors the current state of every \(\mathit{av}\)(\(\mathit{s}_{av}^{t_{i}}\)), which includes the physical properties of the \(\mathit{av}\), position, rotation, and speed at each simulation step \(t_{i}\). By the end of the simulation, the trajectory that each \(\mathit{av}\) followed
is the sequence of its observed states, \(\mathit{trj}_{av} = [\mathit{s}_{}^{t_{0}}, \ldots, \mathit{s}_{}^{t_{N}}]_{av}\). EVITA also observes the trajectories each \(\mathit{av}\) has planned at different times. At time \(t_{i}\), the sequence of states planned by the \(\mathit{av}\) over the planning horizon \(H\) is \(\mathit{\hat{trj}}^{t_{i}}_{av} = [\mathit{\hat{s}}_{t_{i}}^{t_{i+1}}, \ldots, \mathit{\hat{s}}_{t_{i}}^{t_{i+H}}]_{av}\). EVITA identifies AVs interactions by comparing
the trajectories the AVs planned during the scenario.
3 Identifying AVs’ Interactions↩︎
Autonomous vehicles implement a sense-plan-act (SPA) closed-loop architecture to drive while continuously interacting with other vehicles and reacting to scenario elements. According to this architecture,
AVs continuously perceive their surroundings using sensors, like cameras, LiDARs, and radars, and fuse raw sensor data with map information to localize themselves and identify relevant objects around them;
based on localization and object detection data, AVs identify a path to reach a target location on the map and plan a trajectory to drive there safely; finally,
low-level controllers translate the planned trajectories into driving commands (e.g., throttle, steering) that control the vehicle’s movement.
During the SPA loop, AVs can follow the planned trajectories, adjust them to improve performance or safety, or replan them entirely in response to endogenous factors. For instance,
the \(\mathit{av}\) might simply follow its trajectory, while driving straight on an empty road,
it might adjust its trajectory to improve passenger comfort, while taking a turn,
it might promptly plan to stop, before reaching the traffic light, after sensing a red light.
EVITA privileges changes of trajectories, to systematically generate test scenarios that yield diverse interactions, and challenge the AVs in both foreseeable and unforeseen situations that may lead to dangerous outcomes and violations of
traffic rules, as in the example of Figure 1. EVITA identifies interactions among the AVs and between the AVs and other scenario elements, and quantitatively analyzes how the interactions affect the
AVs’ behavior by comparing consecutive planned trajectories (\(\mathit{\hat{trj}}\)). EVITA identifies an interaction of an \(\mathit{av}\) at time \(t_{i}\) if:
Condition C1: \(\mathit{av}\) replanned its trajectory between \(t_{i-1}\) and \(t_{i}\), and
Condition C2: the replanning is likely caused by a scenario element.
The algorithm for checking condition C1 depends on the way Apollo and FrenetiX recompute the trajectories; the algorithm for checking condition C2 depends on the obstacles in the scenarios (only cars in FrenetiX; cars, traffic lights, and road signs in Apollo).
3.1 Identifying Trajectory Replanning (Condition C1)↩︎
Apollo adopts a modular architecture, which implements sensing, planning, and control as autonomous components [29] that communicate via the message-passing middleware ROS2 [30]. The sensing component of Apollo sends messages with data about the perceived objects to the planning component. The planning component uses the data to compute new trajectories, and it sends
them to the control module. EVITA identifies a trajectory replanning in Apollo from the messages of the planning module.
FrenetiX recomputes a new trajectory at every control cycle, even when no different trajectory is necessary. EVITA identifies a trajectory replanning by comparing the trajectory \(\mathit{\hat{trj}}^{t_{i}}_{av}\) computed at time \(t_{i}\) against the trajectory \(\mathit{\hat{trj}}^{t_{i-1}}_{av}\) computed at time \(t_{i-1}\) for the same vehicle \(\mathit{av}\) as follows:
it trims the sub-trajectories with same timestamps in \(\mathit{\hat{trj}}^{t_{i-1}}_{av}\) and \(\mathit{\hat{trj}}^{t_{i}}_{av}\):
\([\mathit{\hat{s}}_{t_{i-1}}^{t_{i+1}},\) \(\ldots,\) \(\mathit{\hat{s}}_{t_{i-1}}^{t_{i+H}}]_{av}\) and \([\mathit{\hat{s}}_{t_{i}}^{t_{i+1}},\) \(\ldots,\) \(\mathit{\hat{s}}_{t_{i}}^{t_{i+H}}]_{av}\),
it computes the cumulative Euclidean distance between pairs of \(\mathit{av}\)’s predicted positions following Magdy et al. [31]: \[ED= \sum_{j=i+1}^{i+H} \left \lVert \mathit{\hat{s}}_{t_{i-1}}^{t_{j}}\text{.position} - \mathit{\hat{s}}_{t_{i}}^{t_{j}}\text{.position}] \right \rVert_2\]
it flags a significant difference between the predicted trajectories when \(ED\) exceeds the threshold \(\mathit{Th_{ED}}\).

Figure 3 illustrates how EVITA identifies a trajectory replanning for FrenetiX. The figure shows the trajectory of the AVs at time \(t_{i-1}\) in black,
respectively, and at time \(t_{i}\) in yellow and orange. EVITA does not identify a trajectory replanning for the yellow vehicle on the left (upper) lane, since the cumulative Euclidean difference between the
trajectories planned at \(t_{i-1}\) and \(t_{i}\) does not exceed the threshold \(\mathit{Th_{ED}}\). It identifies a trajectory replanning for the orange
vehicle on the right (bottom) lane, since the trajectories planned at \(t_{i-1}\) and \(t_{i}\) differ significantly and their cumulative Euclidean difference surpasses the threshold \(\mathit{Th_{ED}}\).
3.2 Identifying Scenario Elements Causing Replanning (Condition C2)↩︎
A series of consecutive trajectory replannings (C1) may indicate either a reaction of an \(\mathit{av}\) to some scenario elements or a routine replanning. Reactions to some scenario elements include situations when the ego-vehicle is approaching another vehicle like in Figure 3, a traffic light or a road sign. Routine replannings occur in normal conditions, for example, Apollo generates replanning messages while taking turns to adjust its trajectory, whereas FrenetiX replans if its reference path requires a lane change.
EVITA prunes “spurious” trajectory changes, following Tien et al.’s suggestions [15] of seeking a likely explanation for the observed
significant trajectory change. EVITA checks for the presence of obstacles, cars, traffic lights, road signs, in correspondence of a relevant trajectory change, like in the case of Figure 3.
For Baidu Apollo, EVITA relies on both Apollo’s planning and perception module. The planning module associates a decision message with the replanned trajectory to indicate the reason for replanning and the responsible scenario element or
vehicle. The perception module generates messages when it identifies obstacles (for instance, other vehicles, traffic lights, including their color, and road signs, like stop and yield signs). For FrenetiX, EVITA relies on the underlying
multi-AV Common``Road execution platform [21], which provides (ground truth) information about vehicles, traffic lights, and road
signs during the execution of the scenarios.
3.3 Classifying Interactions↩︎
EVITA classifies identified interactions as forward (F), forward-left (FL), forward-right (FR), left (L), right (R), backwards (B), backwards-left (BL), and backwards-right
(BR), depending on the relative change in the planned trajectory. It uses interaction maps (see Figure 4) that adapt the feature maps proposed by Riccio et al. [32], for assessing how many types of interaction a scenario covers.
EVITA builds the interaction map for an \(\mathit{av}\) by
extracting the last planned states having the same timestep (\([\mathit{\hat{s}}_{t_{i-1}}^{t_{i+H}}]_{av}\) and \([\mathit{\hat{s}}_{t_{i}}^{t_{i+H}}]_{av}\)) from the planned trajectories defining the interaction (\(\mathit{\hat{trj}}^{t_{i-1}}_{av}\), \(\mathit{\hat{trj}}^{t_{i}}_{av}\)),
computing the difference between the position of these states in the longitudinal and lateral directions, thereby quantifying how much the original trajectory changed due to the interaction,
classifying the difference as forward (F), forward-left (FL), forward-right (FR), left (L), right (R), backwards (B), backwards-left (BL), and backwards-right (BR), depending on the relative change in the planned trajectory,
building a two-dimensional grid whose cells capture both the type and the degree of changes resulting from the interaction.
Figure 4 (a) illustrates the nine possible changes of trajectory. Figure 4 (b) shows the interaction map resulting from the trajectory replanning of the orange vehicle in Figure 3. The interaction map is a two-dimensional grid, where the central cell represents the “no-trajectory-change”, the cells farther from the central cell identify interactions with larger effects, and the colors represent the number of times each interaction type has been observed. Light colors correspond to none (white) or few observations (yellow), whereas darker colors (black) correspond to many observations. In the figure, we observe few interactions (yellow) with the Right/FrontRight (R/FR) cell, which indicate the interactions between the two vehicles of Figure 3, caused by the change of trajectory of the orange vehicle that “challenges” the yellow vehicle on the right, front-right.
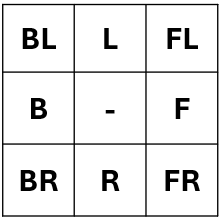
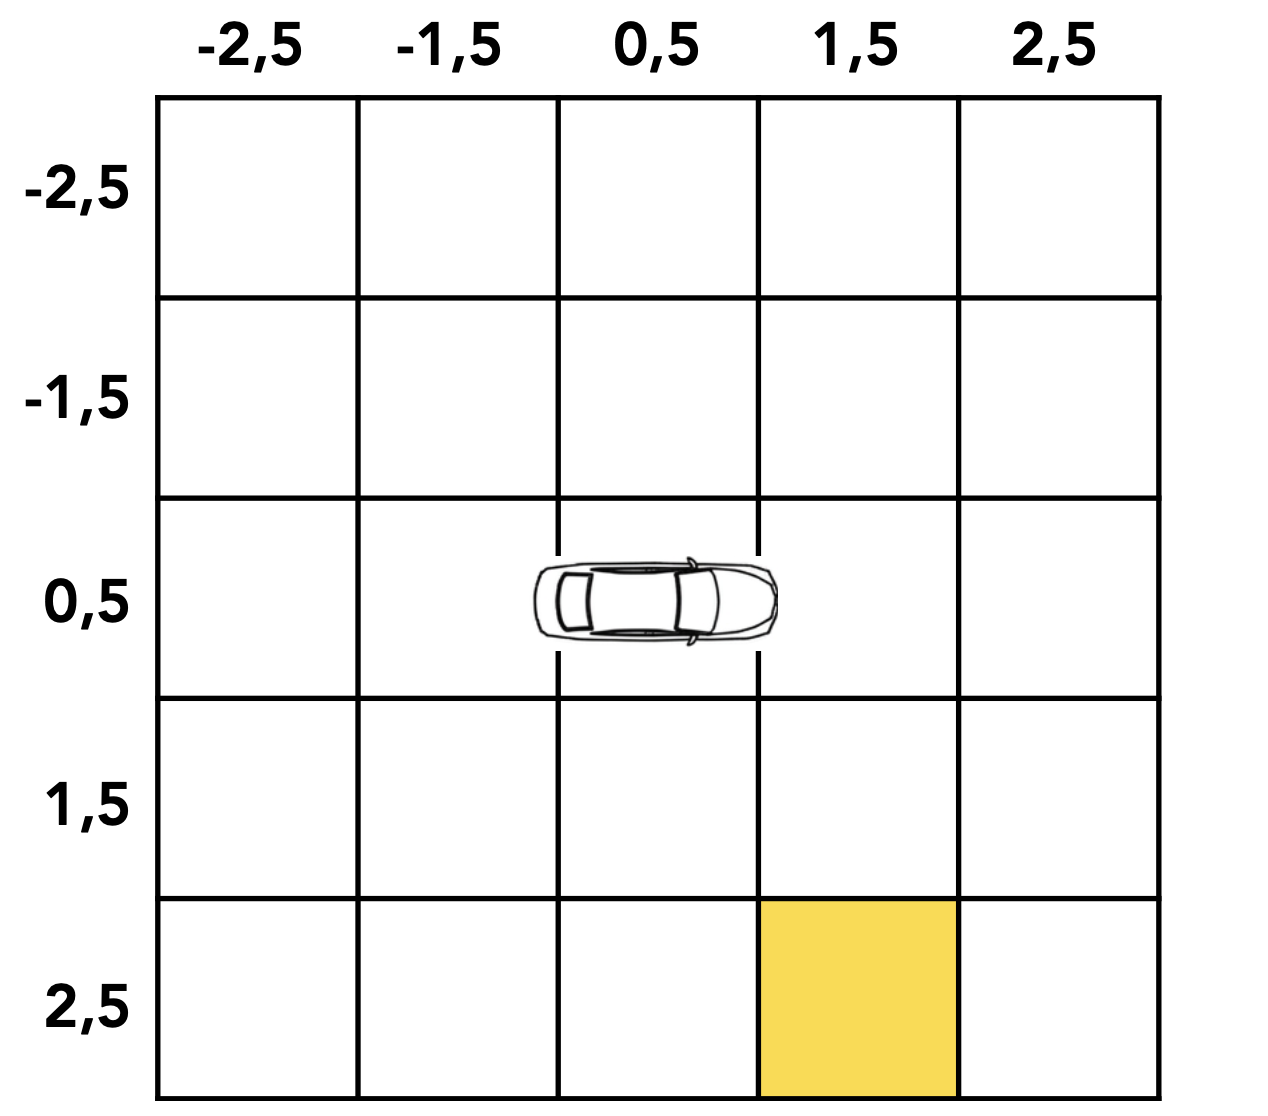
Figure 4: The interaction maps from the trajectory replanning of the orange vehicle in Figure 3. a — Possible types of change of trajectory, b — Interaction map
By mapping each interaction to a specific cell in the interaction map, EVITA measures the number of interaction types a scenario exercises and assesses its overall effect on AVs’ behavior. EVITA determines the sensitivity of
the analysis by adjusting the grid size: a larger number of cells makes the analysis more sensitive to small changes; a smaller number of cells reduces the map’s ability to distinguish scenarios that cause different interactions.
We define the interval of lateral displacement as twice the width of a standard lane (ca. \(3.70\)m) to account for lane changes and define the interval of longitudinal displacement as twice the length of a standard vehicle (ca. \(4.5\)m), based on the observation that changes in AVs’ trajectories are limited by the vehicles’ physics and common sense. We split longitudinal and lateral dimensions into a fixed number of bins (\(10\)) and add an extra bucket to account for edge cases.
4 Testing AVs’ Interactions with EVITA↩︎
EVITA generates multi-AV scenarios that expose safety-critical issues [33] in Common``Road format. EVITA’s
scenarios test multiple AVs against behaviors that emerge from the interplay between the AVs under test and other scenario elements, including dynamic traffic lights and static road signs. EVITA improves the effectiveness of testing by
generating different scenarios that systematically explore the space of possible interactions affecting the \(\mathit{av}\) behavior. This section describes how EVITA generates diverse scenarios and maximizes
both the number and types of interactions by reformulating scenario generation as a multi-objective optimization problem.
4.1 Search Algorithm↩︎
Following Tian et al.’s observation [15] that many critical scenarios are characterized by different interactions among AVs and between AVs and
other scenario elements, EVITA generates scenarios with many different interactions using a search algorithm.
EVITA generates multi-AV scenarios by configuring the timing of traffic light cycles and the autonomous vehicles for a given map. EVITA relies on Doppel``Test’s traffic lights control that ensures the correct
synchronization of traffic signals at each intersection. EVITA configures autonomous vehicles by maximizing the number and the variety of interactions while minimizing the number of AVs per scenario, thereby focusing on the AVs relevant to
testing, by adopting a multi-objective search algorithm. EVITA uses NSGA-II (Non-Dominated Sorting Genetic Algorithm II) [34], a
state-of-the-art multi-objective algorithm that finds many applications in different domains [18], [35]–[42].
In a nutshell, NSGA-II evolves a population of individuals (Section 4.2) that represent multi-AV scenarios. After creating the initial population of individuals (Section 4.3), NSGA-II iteratively
calculates the fitness functions (Section 4.6) for each individual,
ranks the individuals and calculates the crowding distance,
evolves the population by generating new individuals via crossover and mutation operators (Section 4.4).
EVITA iterates the evolution loop up to exhausting a search budget.
4.2 Individuals↩︎
As discussed in Section 2, a multi-AV Common``Road scenario consists of a road network, which may include traffic lights and road signs, and a set of planning problems that define the driving tasks for
the autonomous vehicles. EVITA maximizes the interactions by keeping the map fixed while both mutating and recombining the set of planning problems and the timing of traffic signals. EVITA encodes each individual scenario
as a sequence of attributes representing a variable number of planning problems ranging from \(2\) to \(\mathit{m}\) and a fixed number of traffic lights (between \(0\) and \(l\), as defined by the map): \(\texttt{s}= \{\texttt{p}_{\mathit{av}_1}, \ldots, \texttt{p}_{\mathit{av}_{\mathit{m}}}; \texttt{t}_{j}, \ldots,
\texttt{t}_{l}\}\)
Each planning problem \(\texttt{p}_{\mathit{av}_i}\) has attributes that define the initial position and velocity of the \(\mathit{av}\), as well as the position of the goal area.
EVITA places vehicles on the roads and computes their initial rotation based on the road curvature at the initial position, ensuring the vehicles always follow the direction of the road ahead. The initial velocity is a non-negative real
number, which corresponds to the vehicle’s initial speed in meters per second. EVITA places the goal areas at the end of the roads to maximize travel distance. EVITA relies on the Common``Road representation of goal
areas as rectangles centered in the given position and spanning the width of the underlying lane. EVITA executes a planning problem by assigning it to an \(\mathit{av}\) under test, which shall drive from the
initial position to the goal area without colliding with other vehicles, driving off-road, or violating any other traffic rule, for instance, speeding, running at a red light, or failing to stop at a stop sign.
Each traffic light \(\texttt{t}_{j}\) has attributes that define its initial color and the intervals for transitioning from one color to the next one. During the execution, the underlying simulation platform ensures that colors transition as prescribed.
4.3 Search Initialization↩︎
EVITA initializes the search by generating an initial population of \(\mathit{initial\_}\-\mathit{population\_}\mathit{size}\) random individuals. Each individual contains a random number of planning
problems ranging from \(\mathit{min\_}\-\mathit{AVs}\) to \(\mathit{max\_}\-\mathit{AVs}\), initialized by uniformly sampling the initial and target positions and the speed values.
EVITA randomly initializes the colors and the green light intervals of the traffic lights in the map. The duration of the green light ranges from \(\mathit{min\_}\-\mathit{green\_}\-\mathit{light\_}\-\mathit{duration}\) to \(\mathit{max\_}\-\mathit{green\_}\-\mathit{light\_}\-\mathit{duration}\) seconds, whereas the duration of the yellow
light has a fixed duration of \(3.0\) seconds. EVITA configures the traffic lights to wait an additional \(2.0\) seconds before turning to green to enable clearing the
intersection. To simplify the problem without loss of generality, EVITA forces all traffic lights to have the same green light duration.
Table 1 at page lists all the configurable hyperparameters of the algorithm, including \(\mathit{min\_}\-\mathit{AVs}\), \(\mathit{max\_}\-\mathit{AVs}\), \(\mathit{min\_}\-\mathit{green\_}\-\mathit{light\_}\-\mathit{duration}\), \(\mathit{max\_}\-\mathit{green\_}\-\mathit{light\_}\-\mathit{duration}\), and \(\mathit{initial\_}\-\mathit{population\_}\mathit{size}\).
4.4 Evolution↩︎
The search algorithm evolves the scenarios by incrementally mutating and recombining the planning problems \(\texttt{p}_{\mathit{av}}\) and the traffic lights configuration using mutation and crossover operations.
4.4.1 Mutation↩︎
EVITA mutates the attributes of each planning problem, the set of planning problems, and the initial color and green light duration of traffic lights. EVITA mutates the planning problem \(\texttt{p}_{\mathit{av}}\) associated to each \(\mathit{av}\) in AVs with a probability of \(1/|AVs|\) and its attributes with a probability of \(1/3\) as follows:
Initial Position:
EVITAmutates the initial position of \(\mathit{av}\) by either adding a random value in the range \([\mathit{min\_}\-\mathit{pos\_}\-\mathit{mod}, \mathit{max\_}\-\mathit{pos\_}\-\mathit{mod}]\)2 or selecting a different initial lane.Initial Velocity:
EVITAmutates the initial velocity of \(\mathit{av}\) by a random value in the range \([\mathit{min\_}\-\mathit{init\_}\-\mathit{vel},\mathit{max\_}\-\mathit{init\_}\-\mathit{vel}]\)3.Goal Area:
EVITAmutates the goal area of \(\mathit{av}\) by moving the goal area to a different lane.
EVITA adds or removes planning problems, thus autonomous vehicles, from a multi-AV scenario with a probability that depends on the number of vehicles in it:
Add AV:
EVITAadds a newly generated planning problem \(\texttt{p}_{\mathit{av}^\prime}\) to the scenario, unless the scenario contains \(\mathit{max\_}\-\mathit{AVs}\) autonomous vehicles.Remove AV:
EVITAremoves a planning problem randomly, unless the scenario contains \(\mathit{min\_}\-\mathit{AVs}\) autonomous vehicles.
EVITA mutates traffic lights attributes with a probability of \(1/2\) as follows:
Green light duration:
EVITAassigns a new random duration (between \(\mathit{min\_}\-\mathit{green\_}\-\mathit{light\_}\-\mathit{duration}\) and \(\mathit{max\_}\-\mathit{green\_}\-\mathit{light\_}\-\mathit{duration}\)) to all traffic lights’ green duration.Initial color:
EVITAchanges the initial color of all traffic lights, ensuring that colors are consistent with traffic regulations.
4.4.2 Crossover↩︎
EVITA recombines the information about planning problems between two individuals using a customized crossover operator. Given two scenarios: \[\label{eq:parents}
\{\texttt{p}^1_{\mathit{av}_1}, \ldots, \texttt{p}^1_{\mathit{av}_i}, \texttt{p}^1_{\mathit{av}_{i+1}}, \ldots, \texttt{p}^1_{\mathit{av}_{r}}
; \texttt{t}^1_{j}, \ldots, \texttt{t}^1_{m}\}
\qquad
\{\texttt{p}^2_{\mathit{av}_1}, \ldots, \texttt{p}^2_{\mathit{av}_k}, \texttt{p}^2_{\mathit{av}_{k+1}}, \ldots, \texttt{p}^2_{\mathit{av}_{s}}
; \texttt{t}^2_{j}, \ldots, \texttt{t}^2_{m}\}\tag{1}\] EVITA splits their planning problem sets at random positions (\(i\) and \(k\)) and recombines them to form
two new individuals: \[\{\texttt{p}_{\mathit{av}^1_1}, \ldots, \texttt{p}_{\mathit{av}^1_i}, \texttt{p}_{\mathit{av}^2_{k+1}}, \ldots, \texttt{p}_{\mathit{av}^2_{s}}
; \texttt{t}^1_{j}, \ldots, \texttt{t}^1_{m}\}
\qquad
\{\texttt{p}_{\mathit{av}^2_1}, \ldots, \texttt{p}_{\mathit{av}^2_k}, \texttt{p}_{\mathit{av}^1_{i+1}}, \ldots, \texttt{p}_{\mathit{av}^1_{r}}
; \texttt{t}^2_{j}, \ldots, \texttt{t}^2_{m}\}\]
Alternatively, EVITA recombines the information about traffic lights between two parent scenarios by swapping their configurations. Thus, given two scenarios as in Eq. 1 , it produces two new individuals: \[\{\texttt{p}^1_{\mathit{av}_1}, \ldots, \texttt{p}^1_{\mathit{av}_i}, \texttt{p}^1_{\mathit{av}_{i+1}}, \ldots, \texttt{p}^1_{\mathit{av}_{r}}
; \texttt{t}^2_{j}, \ldots, \texttt{t}^2_{m}\}
\qquad
\{\texttt{p}^2_{\mathit{av}_1}, \ldots, \texttt{p}^2_{\mathit{av}_k}, \texttt{p}^2_{\mathit{av}_{k+1}}, \ldots, \texttt{p}^2_{\mathit{av}_{s}}
; \texttt{t}^1_{j}, \ldots, \texttt{t}^1_{m}\}\]
4.5 Scenario Validation↩︎
EVITA relies on random individual generation and evolution, which may generate invalid and non-interesting scenarios. Invalid scenarios are situations that cannot be solved. For instance, an \(\mathit{av}\) with a goal area that is not reachable from the initial state of the \(\mathit{av}\), or two autonomous vehicles spawned in the same initial position. Not interesting scenarios are
situations irrelevant to testing. For instance, an \(\mathit{av}\) that is spawned too close or even directly inside its goal area does not contribute to the question of whether the \(\mathit{av}\) can safely drive.
Valid and interesting scenarios must meet the following conditions:
Initial Position and Velocity: The initial position of any \(\mathit{av}\) is within the road network, and its initial velocity is between \(\mathit{min\_}\-\mathit{velocity}\) and \(\mathit{max\_}\-\mathit{velocity}\).
Safety Distance: There is enough distance between any pairs of autonomous vehicles (\(\mathit{av}\), \(\mathit{av}^{\prime}\)) on the same lane to avoid a collision.
Distance to Goal: The initial position and goal area of any \(\mathit{av}\) are at least \(\mathit{min\_}\-\mathit{dist\_}\-\mathit{goal}\) units apart (longitudinally).
Goal Reachability: The goal area of any \(\mathit{av}\) is reachable from its initial positions by navigating through the road network without violating any traffic rule.
4.6 Fitness functions↩︎
EVITA executes a multi-AV scenario \(\texttt{s}\) until a global execution timeout is reached or all the autonomous vehicles reach their goal area, collide, or drive off the road. It collects the states
\(\mathit{s}_{\mathit{av}}^{t_i}\) and planned trajectories \(\mathit{\hat{trj}}^{t_{i}}_{\mathit{av}}\) of each \(\mathit{av}\in AVs\) at any timestamp
\(t_i \in \{t_1,\) \(\ldots,\) \(t_n\)} within the execution of the scenario. Based on the collected data, EVITA computes three fitness
functions (interaction fitness, interaction diversity fitness, and number of vehicles fitness) that optimizes to generate scenarios in which AVs interact frequently and in different ways while involving as few AVs as
possible.
4.6.1 Interaction Fitness (\(\nearrow\))↩︎
The interaction fitness \(\mathit{fit}_{\mathit{int}}\) accounts for the cumulative interactions observed during the execution of a scenario \(\texttt{s}\). EVITA aims to
maximize \(\mathit{fit}_{\mathit{int}}\) to incentivize
critical decisions to avoid dangerous situations such as collisions, and
strategic decisions to avoid violating traffic rules.
By doing so, EVITA creates complex interplay among AVs, aiming to increase the likelihood of exposing safety-critical issues in AVs caused by emergent behaviors.
We define \(\mathit{fit}_{\mathit{int}}\) as: \[\label{eq:fitnessInt} \mathit{fit}_{\mathit{int}}(\texttt{s}) = \sum_{\mathit{av}\in AVs} \left |\{ t_{i} \in \{t_1, \ldots, t_n\} \colon \mathit{isInteraction}(\mathit{av}, t_{i}) \} \right|\tag{2}\] where \(\mathit{isInteraction}(\mathit{av},t_{i})\) = true if \(\mathit{av}\) interacts with any other obstacle at time \(t_{i}\) according to the definition we provided in Section 3 and \(\texttt{s}\) is a scenario that lasts \(n\) time steps and involves \(AVs\) autonomous vehicles.
4.6.2 Interaction Diversity Fitness (\(\nearrow\))↩︎
EVITA generates scenarios that differ for the type of the interactions, which it quantifies in terms of changes of the trajectories of each \(\mathit{av}\) for each interaction involving the vehicle \(\mathit{av}\) at time \(t_i\) (as described in Section 3).
The interaction diversity fitness \(\mathit{fit}_{\mathit{div}}\) measures the differences between scenario \(\texttt{s}\) and the previously computed scenarios, which EVITA
aims to maximize. To compute the \(\mathit{fit}_{\mathit{div}}\) achieved in a scenario \(\texttt{s}\), EVITA records the type and number of interactions observed in \(\texttt{s}\) in a vector \(\mathit{\overline{ct}}_{\texttt{s}} = [\# BL,\) \(\#L,\) \(\ldots,\) \(\#R,
\#FR]\), and computes the minimum distance between \(\mathit{\overline{ct}}_{\texttt{s}}\) and the vectors computed for the previously generated scenarios \(\texttt{s}_1\), …, \(\texttt{s}_k\): \[\label{eq:fitnessDiv}
\mathit{fit}_{\mathit{div}}(\texttt{s}) = \min_{\texttt{s}_i \in \{\texttt{s}_1, \ldots, \texttt{s}_k\}} \| \mathit{\overline{ct}}_{\texttt{s}} - \mathit{\overline{ct}}_{\texttt{s}_i}\|_2\tag{3}\]
4.6.3 Number of Vehicles Fitness (\(\searrow\))↩︎
EVITA limits the complexity of the generated scenarios by reducing the number of planning problems to the vehicles that (directly or indirectly) participate in the interactions. Given a scenario \(\texttt{s}\) with vehicles \(AVs\), EVITA aims to minimize \[\label{eq:fitnessNumCars}
\mathit{fit}_{\mathit{numAVs}}(\texttt{s}) = |AVs|\tag{4}\]
5 Evaluation Methodology↩︎
This section presents the main research questions (Section 5.1), the metrics (Section 5.2), and the experiments we executed to collect such metrics (Section 5.3).
5.1 Research Questions↩︎
We answer the following research questions (RQs):
RQ. (Interactions exposure): Does EVITA generate multiple and different types of interactions?
This research question evaluates EVITA’s ability to generate scenarios involving multiple AVs and resulting in many interactions of different types.
RQ. (Collision exposure): Does EVITA generate scenarios with multiple and different types of collisions?
This research question evaluates whether generating scenarios that expose a wide variety of interactions also reveal collisions, thereby confirming that covering interactions is central for revealing safety-critical situations and achieving better safety
in autonomous vehicles.
RQ. (Traffic rule violation exposure): Does EVITA generate scenarios leading to traffic rule violations?
This research question complements the previous one by evaluating EVITA’s ability to expose additional AVs misbehaviors related to traffic rule violations, strengthening the importance of covering interactions in AVs testing.
RQ. (Scenario complexity): Does EVITA generate simple scenarios?
This research question checks the relevance of the generated scenarios to AVs testing and debugging, in terms of the number of AVs involved in the scenario, since scenarios that involve only a limited number of autonomous vehicles without reducing the
complexity of the interactions, make it easy both testing and debugging.
RQ. (Effectiveness of test generation): How many valid scenarios does EVITA generate?
This research question assesses the effectiveness of EVITA. Addressing this research question is important for assessing the practical applicability of EVITA, i.e., its ability to produce useful test cases in a manner comparable
to day-to-day development practices.
5.2 Evaluation Metrics↩︎
We define several metrics to experimentally answer the research questions. In the following, we present these metrics grouped by type.
5.2.1 Interaction Metrics↩︎
To address RQ1, we consider the total number of interactions (Total``Ints) and the total number of unique interactions (UniqueInts). We compute Total``Ints as per Equation 2 ,
whereas we compute UniqueInts using the interaction map described in Section 3.3. We build the interaction map using all the interactions exposed by the scenarios generated in a single run,
and compute UniqueInts as the number of cells in the interaction map that are covered by at least one interaction.
5.2.2 Test Effectiveness Metrics (Test Oracles)↩︎
A scenario might expose various issues in AVs, including collisions and traffic rule violations. To address RQ2, we consider the total number of found collisions (TotalColls) and the total number of unique collisions
(UniqueColls), whereas we consider the total number of times AVs failed to handle traffic lights (Total``FailTrafficLights) and stop signs (Total``FailStop), as well as the total number of times AVs violated the speed
limits (Total``Speeding) to address RQ3. We compute the total number of collisions (TotalColls) by checking whether the bounding boxes of two vehicles intersect. We compute the number of unique collisions UniqueColls
as the number of unique combinations of point of impact (POI), relative impact velocity (RIV), and relative impact angle (RIA) exposed in a run.
The point of impact \(\texttt{POI}\in \{\texttt{FL},\) \(\texttt{FR},\) \(\texttt{FC},\) \(\texttt{BL},\) \(\texttt{BR},\) \(\texttt{BC},\) \(\texttt{MR},\) \(\texttt{ML}\}\) identifies which part of the AVs is stroked when the
collision occurs (Front Left/Right/Center, Back Left/Right/Center, Middle Left/Right). The relative impact
velocity RIV is the relative velocity of the impact; we consider \(11\) partitions of the relative velocity (\(10\) partitions capture values between \(0\) and \(100\) Km/h, and one partition captures the edge case \(>100\) Km/h). The relative impact angle RIA is the relative angle of impact. We
consider \(10\) partitions of the range \([0, 180]\) degrees and an additional partition for the remaining cases. According to this classification, we identify \(968\) (\(8 \times 11 \times 11\)) possible types of collisions combining \((\texttt{POI}, \texttt{RIV}, \texttt{RIA})\).
We rely on the oracles defined by Huai et al. [18], to account for traffic rule violations. We identify violations related to traffic lights and
stop signs by cross-checking the recorded movement of each autonomous vehicle against the traffic lights and road signs’ positions and recorded states, whereas we determine speeding violations by verifying whether the \(\mathit{av}\)’s velocity exceeds the posted speed limit of the lane the ego-vehicle is driving on. We compute Total``FailTrafficLights, Total``FailStop, and Total``Speeding by counting the
number of oracle violations over the scenarios executed in a run.
5.2.3 Scenario Complexity and Test Generation Metric↩︎
To address RQ4, we consider the number of autonomous vehicles in each scenario (nVehicles). To answer RQ5, we consider the total number of generated scenarios (Total``Scenarios) and how many of them are valid
(Valid``Scenarios).
We compute nVehicles as the total number of vehicles simulated in all executed scenarios. We compute Total``Scenarios and Valid``Scenarios following the guidelines for evaluating test generators of the
SBFT CPS Testing Tool Competition [43]–[45]: Total``Scenarios accounts for all the generated scenarios, while Valid``Scenarios accounts for the number of valid scenarios (see Section 4.5).
5.3 Experimental Setup↩︎
All experiments generate and validate a number of scenarios, and execute the valid scenarios in a simulator against (multiple instances of) a test subject, for a given generation budget and road network. The logic that generates the scenarios may use data collected during execution to generate additional scenarios in a feedback loop.
We executed experiments that cover a wide range of experimental settings, including six road networks (Section 5.3.1) and two simulators and test subjects (Section 5.3.2), to increase the generality of our conclusions. The road networks represent highway, suburban, and urban maps; the simulators implement low- and high-fidelity simulations; and the test subjects adopt standard, yet fundamentally different, approaches to autonomous driving.
We follow the guidelines proposed by Arcuri and Briand [46], to increase the robustness of our conclusions. We repeated all experiments multiple (\(n=10\)) times, established the significance of our conclusions using statistically appropriate tests (the Mann-Whitney U test with \(\alpha = 0.05\) as the significance level), and assessed the effect size using Vargha and Delaney’s \(\hat{A}\)12.4
We compare the results with those obtained with Doppel``Test [18], a state-of-the-art approach for generating multi-AV scenarios
(Section 5.3.3), to contextualize the results achieved with EVITA. We evaluated each approach in its native execution environments and in the execution environment defined by the other approach, and
configured both environments with the same execution budget and (as much as possible) the same hyperparameters (see Table 1).
| Parameter Name | Value | Explanation | |
|---|---|---|---|
| 2-3 | Apollo | ||
| 3 hours | 24 hours | Generation budget measured in total time. | |
| 10 | 10 | Size of the initial set of scenarios for the search algorithm. | |
| 200 | 300 | Maximum duration, i.e., timeout, for each scenario execution expressed in simulation steps. | |
| 10.0 | Distance (in meters) of the goal area from the end of a lanelet. | ||
| ; | 2; 8 | 2; 5 | Minimum and maximum amount of autonomous vehicles in a scenario. |
| ; | -50; 50 | -50; 50 | Limit on the maximum variation for mutating ’ initial position along the lanelets in meters. |
| ; | 0; 25 | Limit on the maximum variation for mutating ’s initial velocity in meters per second. | |
| ; | 5; 10 | Minimum and maximum values for setting ’ initial velocity in meters per second. | |
| 5 | The maximum number of consecutive simulation steps in emergency mode before halt. | ||
| 50 | Minimum duration of the green light of traffic lights. | ||
| 150 | Maximum duration of the green light of traffic lights. | ||
5.3.1 Road Networks↩︎
We selected six road networks that replicate real-world highways, suburban roads, and urban roads, ensuring they have the necessary elements to support basic driving maneuvers, such as keeping the lane, following vehicles ahead, overtaking and cutting in, merging into traffic, taking existing ramps, and navigating controlled intersections. We included suburban roads and highways as they are underrepresented in research [16].
We sampled the five road networks reported in Figure 5 from Common``Road’s online library [25]. Those road networks replicate segments of Asian (Cho) and European (Cologne) suburban roads as well as North American highways (US101_09, US101_15, and
US101_23).
Cho is a long and almost straight single-lane road that merges into a two-lane road; thus, it forces the vehicles to tailgate each other, given the impossibility of overtaking in the narrow segment, and allows them to gain speed before
merging. Cologne features lanes with opposite traffic directions, merges and bottlenecks, and an incoming lane that can lead to extreme situations such as head-on collisions. US101_09, US101_15, and
US101_23 consist of multiple lanes, allow for high traffic flow and many opportunities for overtaking. They also feature entry and exit ramps that require AVs to negotiate and synchronize their movement.
We replicated the experiments that Huai et al. executed to validate Doppel``Test [48] using a
real-world urban street block in Sunnyvale, CA (Borregas Ave), see Figure 6. Borregas Ave includes a long straight segment connecting two four-way intersections, one controlled by
traffic lights and one governed by stop signs. This road network requires autonomous vehicles to handle traffic lights and negotiate the right-of-way at complex junctions and merging points.





Figure 5: Benchmark road networks for test subject one (FrenetiX). a — Cho, b — Cologne, c — US101_09, d — US101_15, e — US101_23
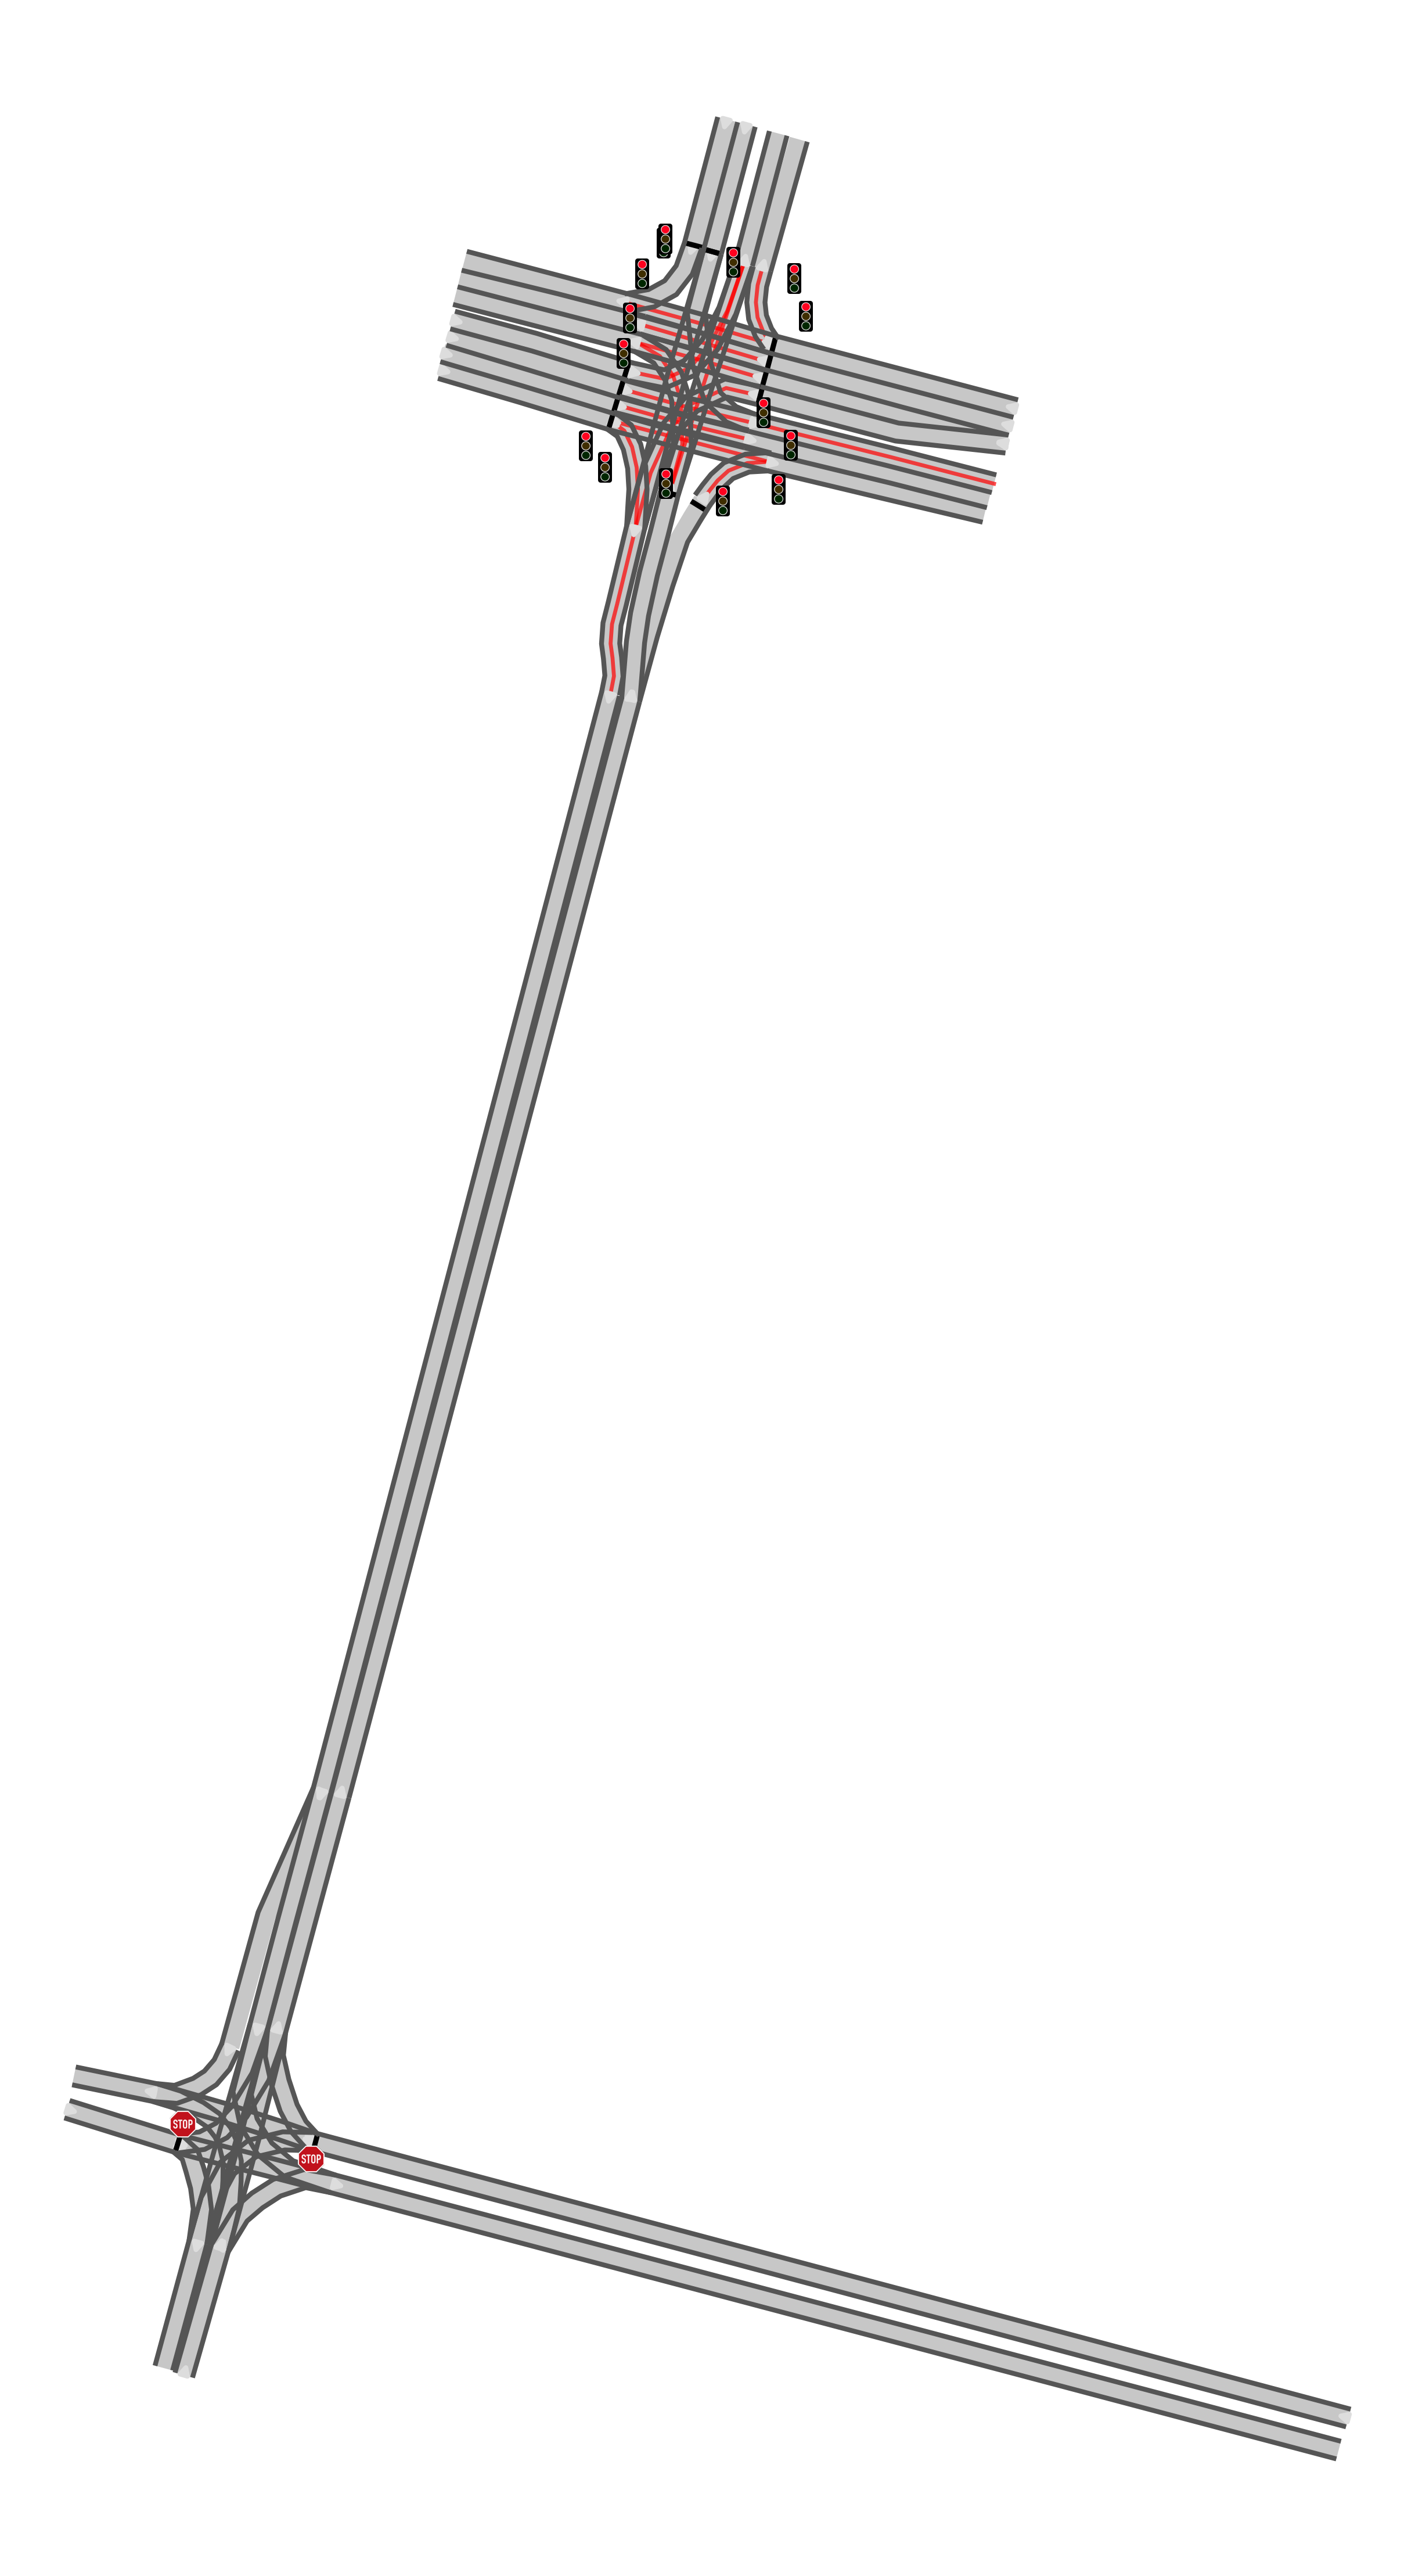
Figure 6: Benchmark road network for test subject two (Baidu Apollo). a — Borregas Ave
5.3.2 Test Subjects and Driving Simulators↩︎
We consider as test subjects two open-source AVs implementations that have been extensively used in previous research. Each of these test subjects is designed to work with a specific simulator; therefore, in our evaluation, we consider two simulation
environments: the Common``Road-based simulation framework proposed by Kaufeld et al. [21] for FrenetiX, and the Baidu Apollo-based
simulation framework proposed by Huai et al. [18] for Apollo.
5.3.2.1 FrenetiX
FrenetiX [20] is an efficient, open-source5 motion planner integrated
with Common``Road. This simulation platform combines a static global planner, called Route Planner, with a reactive local planner, called Behavioral Planner. The Route Planner generates a reference path through the entire road network for the
\(\mathit{av}\) to reach the intended destination, i.e., the goal area. The Behavioral Planner implements a sampling-based trajectory-planning cycle [49] to continuously plan trajectories that follow the reference path while optimizing safety (for instance, avoiding obstacles and driving only on allowed roads) and passenger comfort
(for instance, avoiding abrupt accelerations). FrenetiX relies on a deep learning [50] component to predict the
movement of nearby vehicles in the simulation.
5.3.2.2 Baidu Apollo
Baidu Apollo6 is an industry-level autonomous driving stack that adopts a modular architecture that integrates high-fidelity vehicle dynamics models, extensive sensing,
and accurate control over ROS [51]. We use the version of Baidu Apollo available in the replication package of Doppel``Test [48].
5.3.3 Baseline Approach↩︎
We contextualize the achieved results by comparing EVITA with Doppel``Test [18], the only state-of-the-art approach
that, to the best of our knowledge, generates multi-AV critical scenarios.
Similarly to EVITA, Doppel``Test implements a multi-objective optimization algorithm to generate scenarios involving multiple AVs in an urban context. Unlike EVITA, Doppel``Test also simulates
pedestrians and directly uses the test oracles as fitness functions, an approach also known as falsification testing [52], [53]. Doppel``Test aims to trigger as many test oracles as possible, which has the downsides of
not stressing a wide range of AVs behaviors and of discovering the same issues multiple times, instead of generating scenarios that cover interactions.
Doppel``Test original code works only for Apollo and its driving simulator, and it was tested only in urban scenarios. We extended Doppel``Test to parse maps defined in Common``Road and compute its test oracles
(see Section 5.2) from the simulation data collected by the multi-agent platform by Kaufeld et al. [21], to enable a fair comparison with EVITA across different simulators and test subjects. We make the code that extends Doppel``Test freely available and open for review in our replication
package [24]. We implemented bindings to convert Apollo maps and simulations executed on Apollo simulator back into
Common``Road, the format EVITA uses to generate scenarios (see Section 2) and evaluate their fitness (see Section 4.6). Our extensions enable the
analysis and visualization of executed scenarios, thereby supporting post-processing, reporting, and human understanding.
6 Experimental Results↩︎
This section summarizes the results we obtained by executing EVITA and Doppel``Test in the two experimental settings: against FrenetiX, on the highway and suburban scenarios shown in Figure 5, and Baidu Apollo, on the urban road layout shown in Figure 6. For all experiments, we used a Xeon Gold 6226R (16 core 2.9GHz) with 16GB of RAM.
6.1 RQ1 – Does EVITA generate multiple and different types of interactions?↩︎
RQ1 evaluates the ability of EVITA to generate scenarios that trigger interactions, which we assess by counting the total number of interactions and the number of unique interactions.
Figures 7 (a) and 7 (b) report the distribution of Total``Ints and UniqueInts obtained with EVITA and
Doppel``Test across all the lane networks used in the experimental setting with FrenetiX.
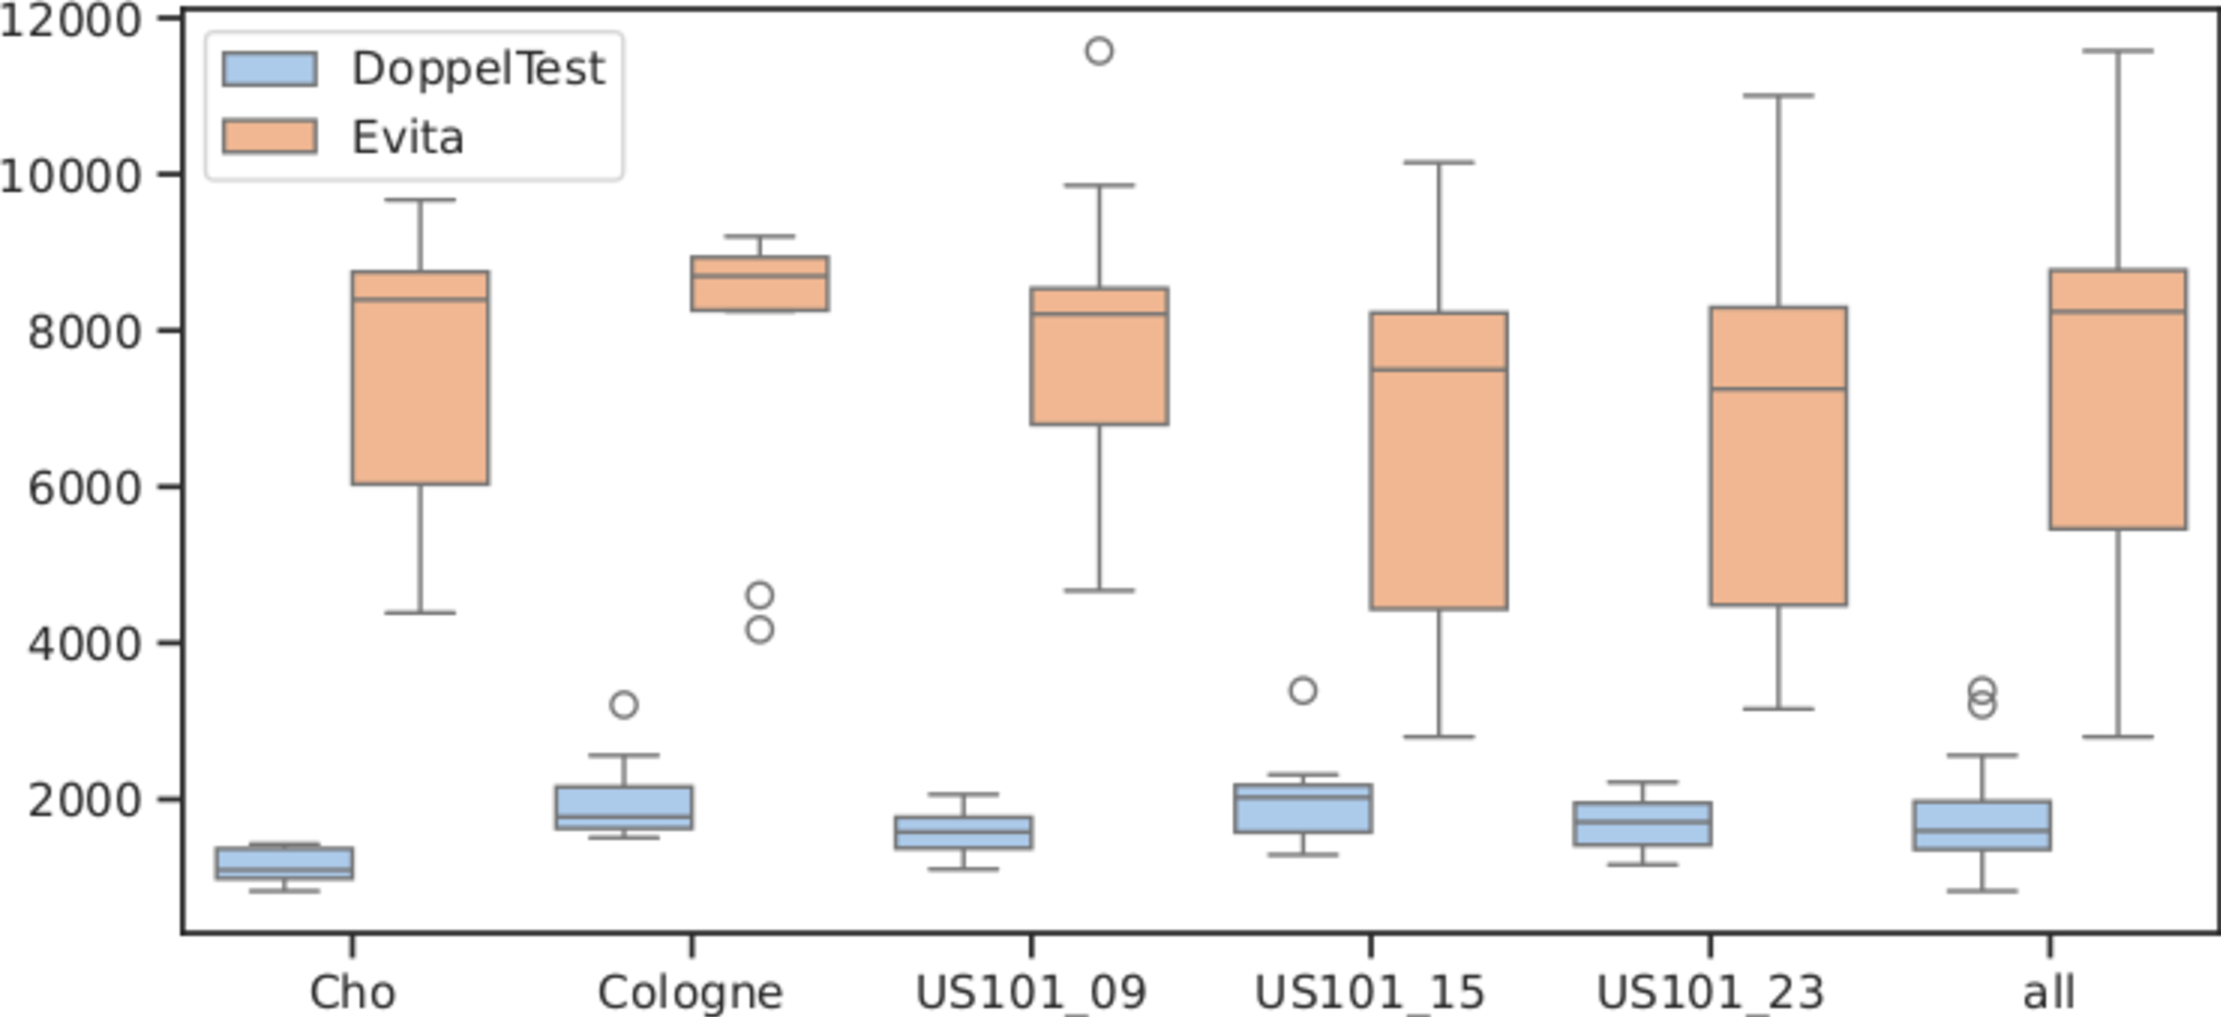
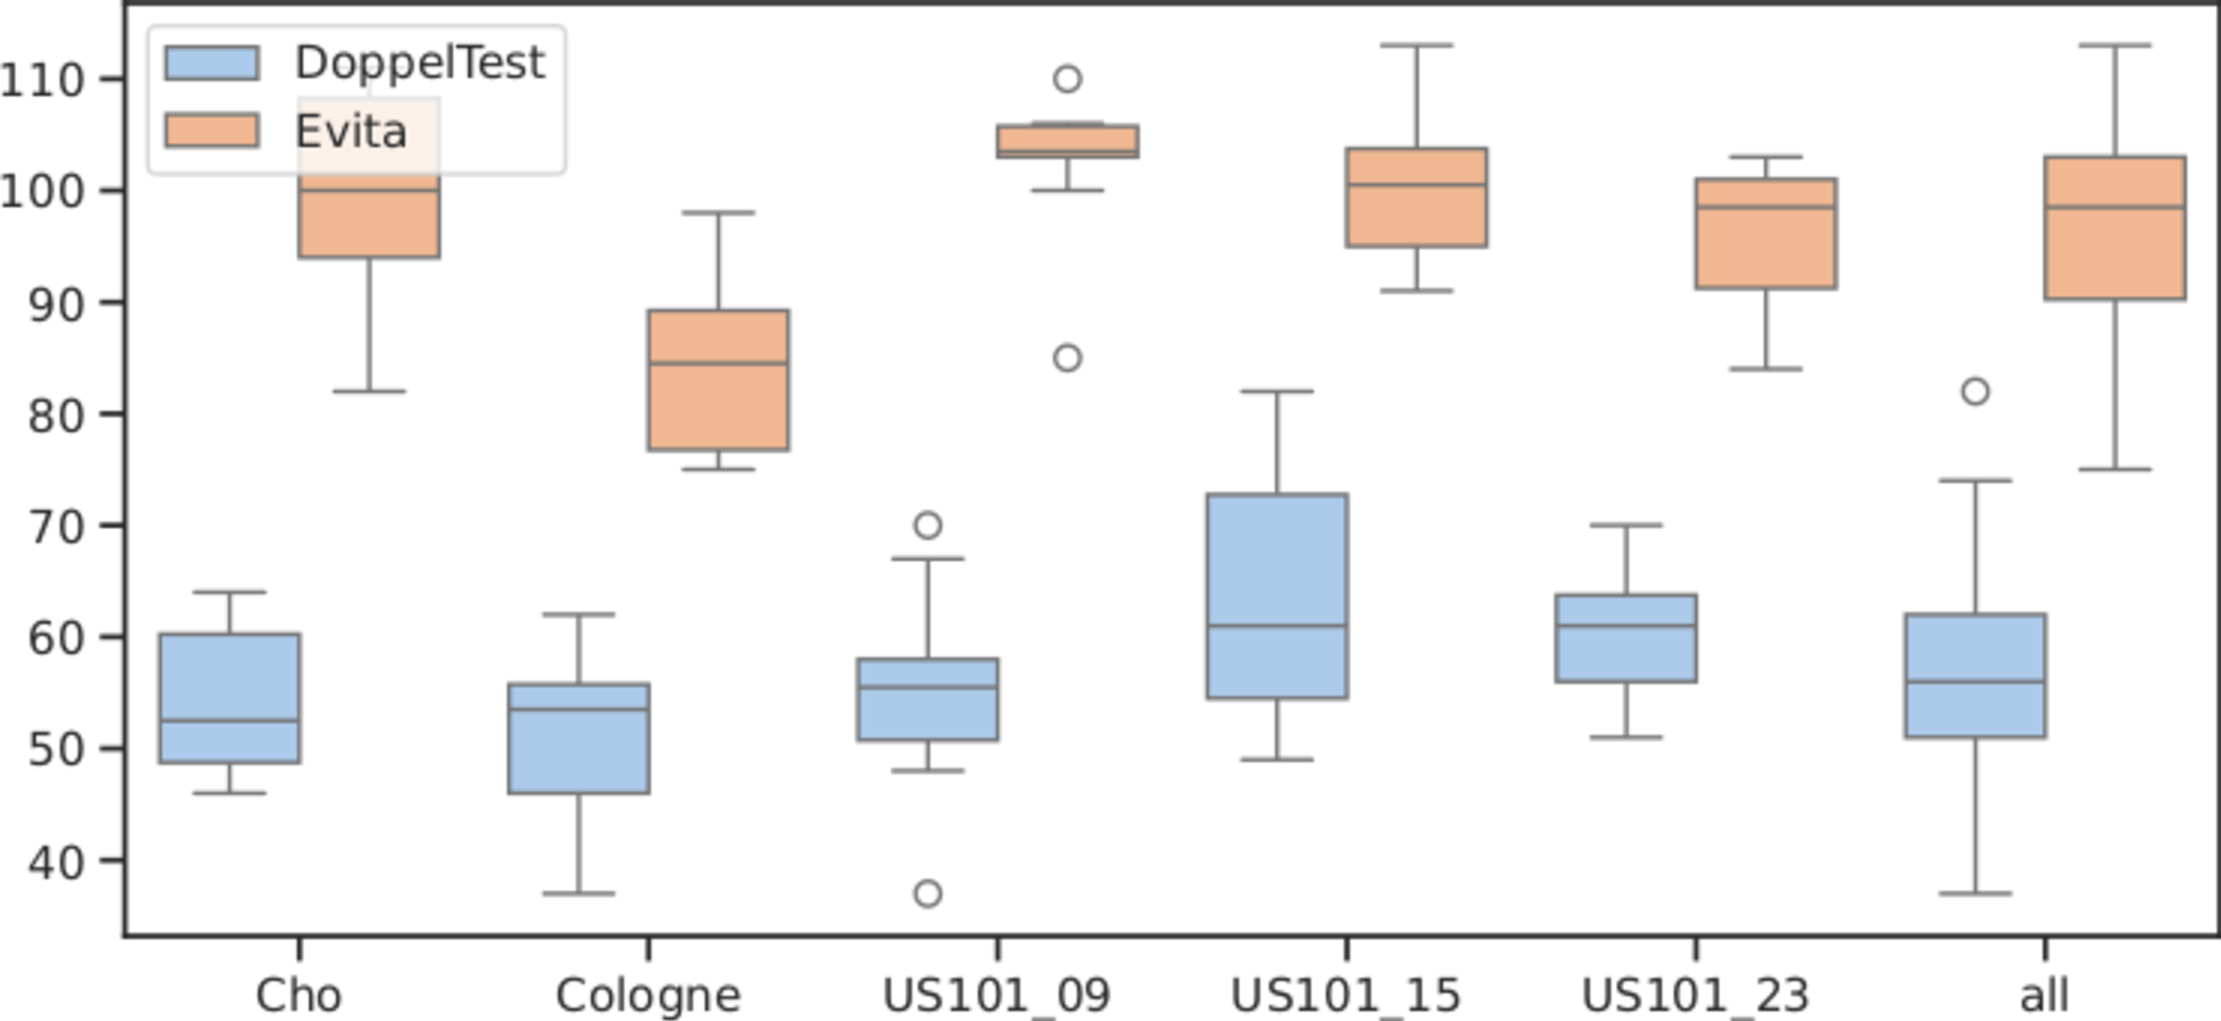
Figure 7: RQ1 – Interactions found by EVITA and Doppel``Test with FrenetiX experimental setting. a — Total number of interactions (Total``Ints), b — Unique number of interactions
(UniqueInts)
The right-most group in each plot shows the aggregated values across all the road networks. Figure 8 reports the interaction maps for each road network and approach.
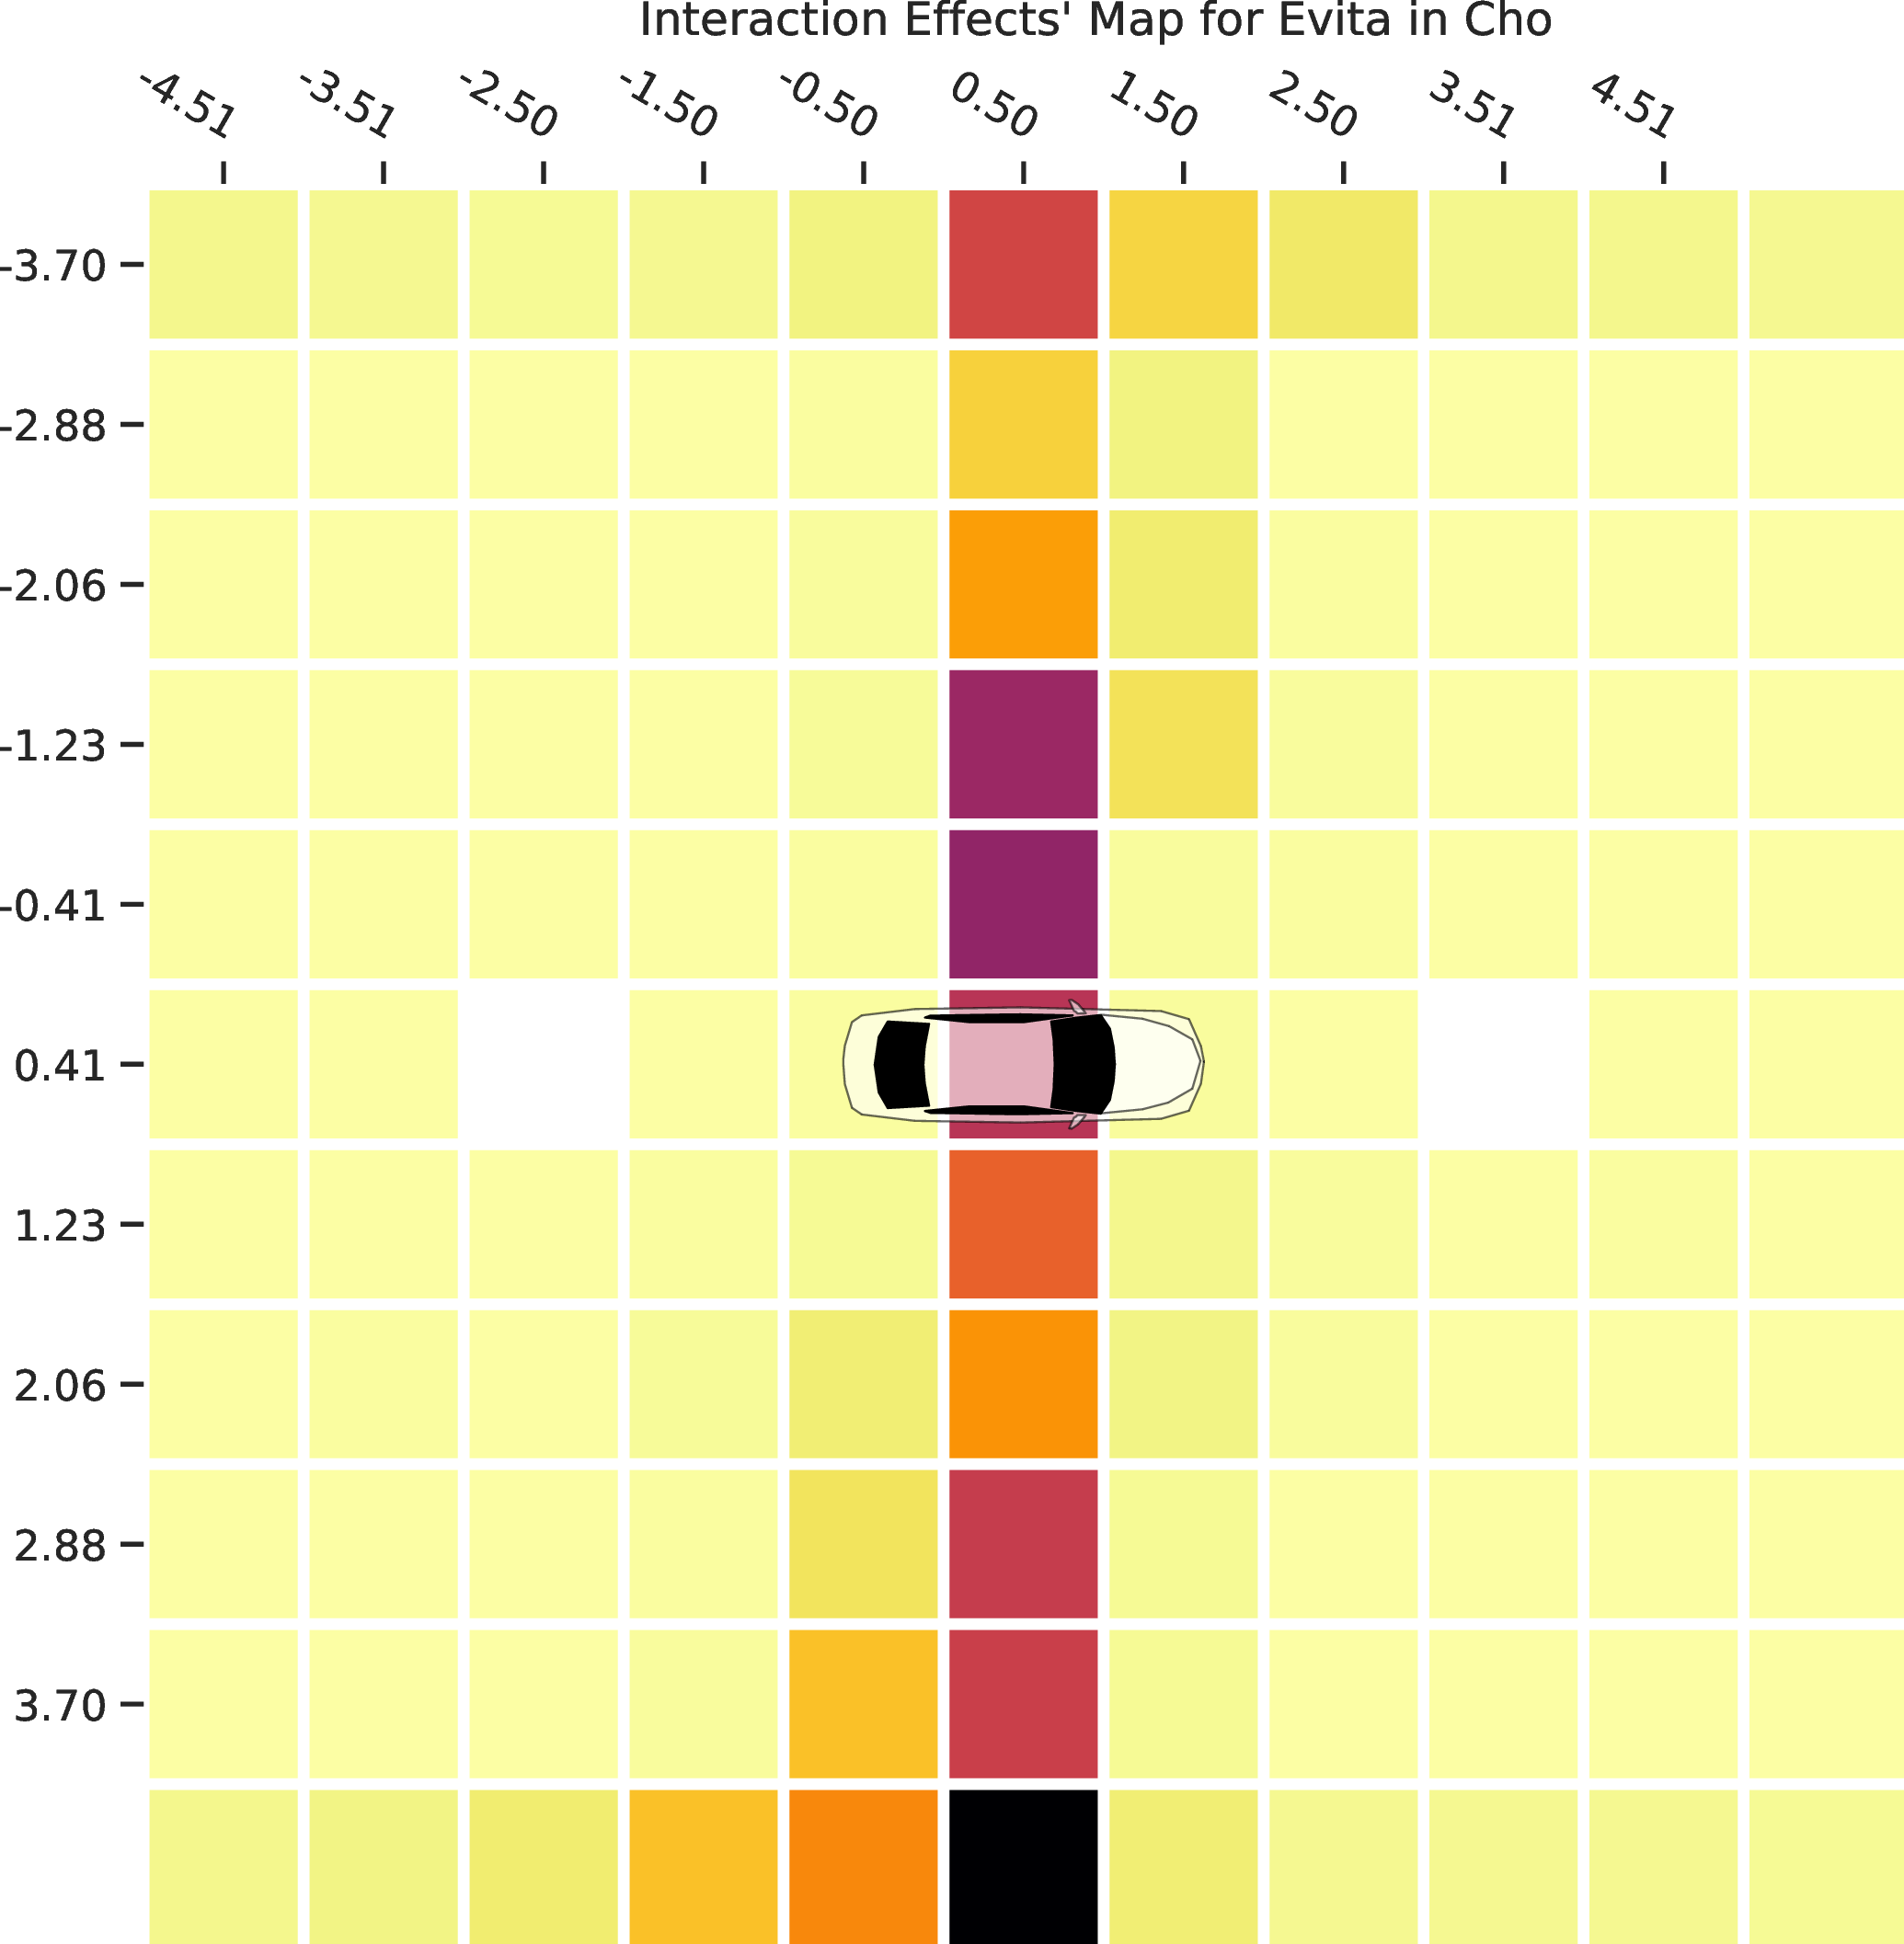
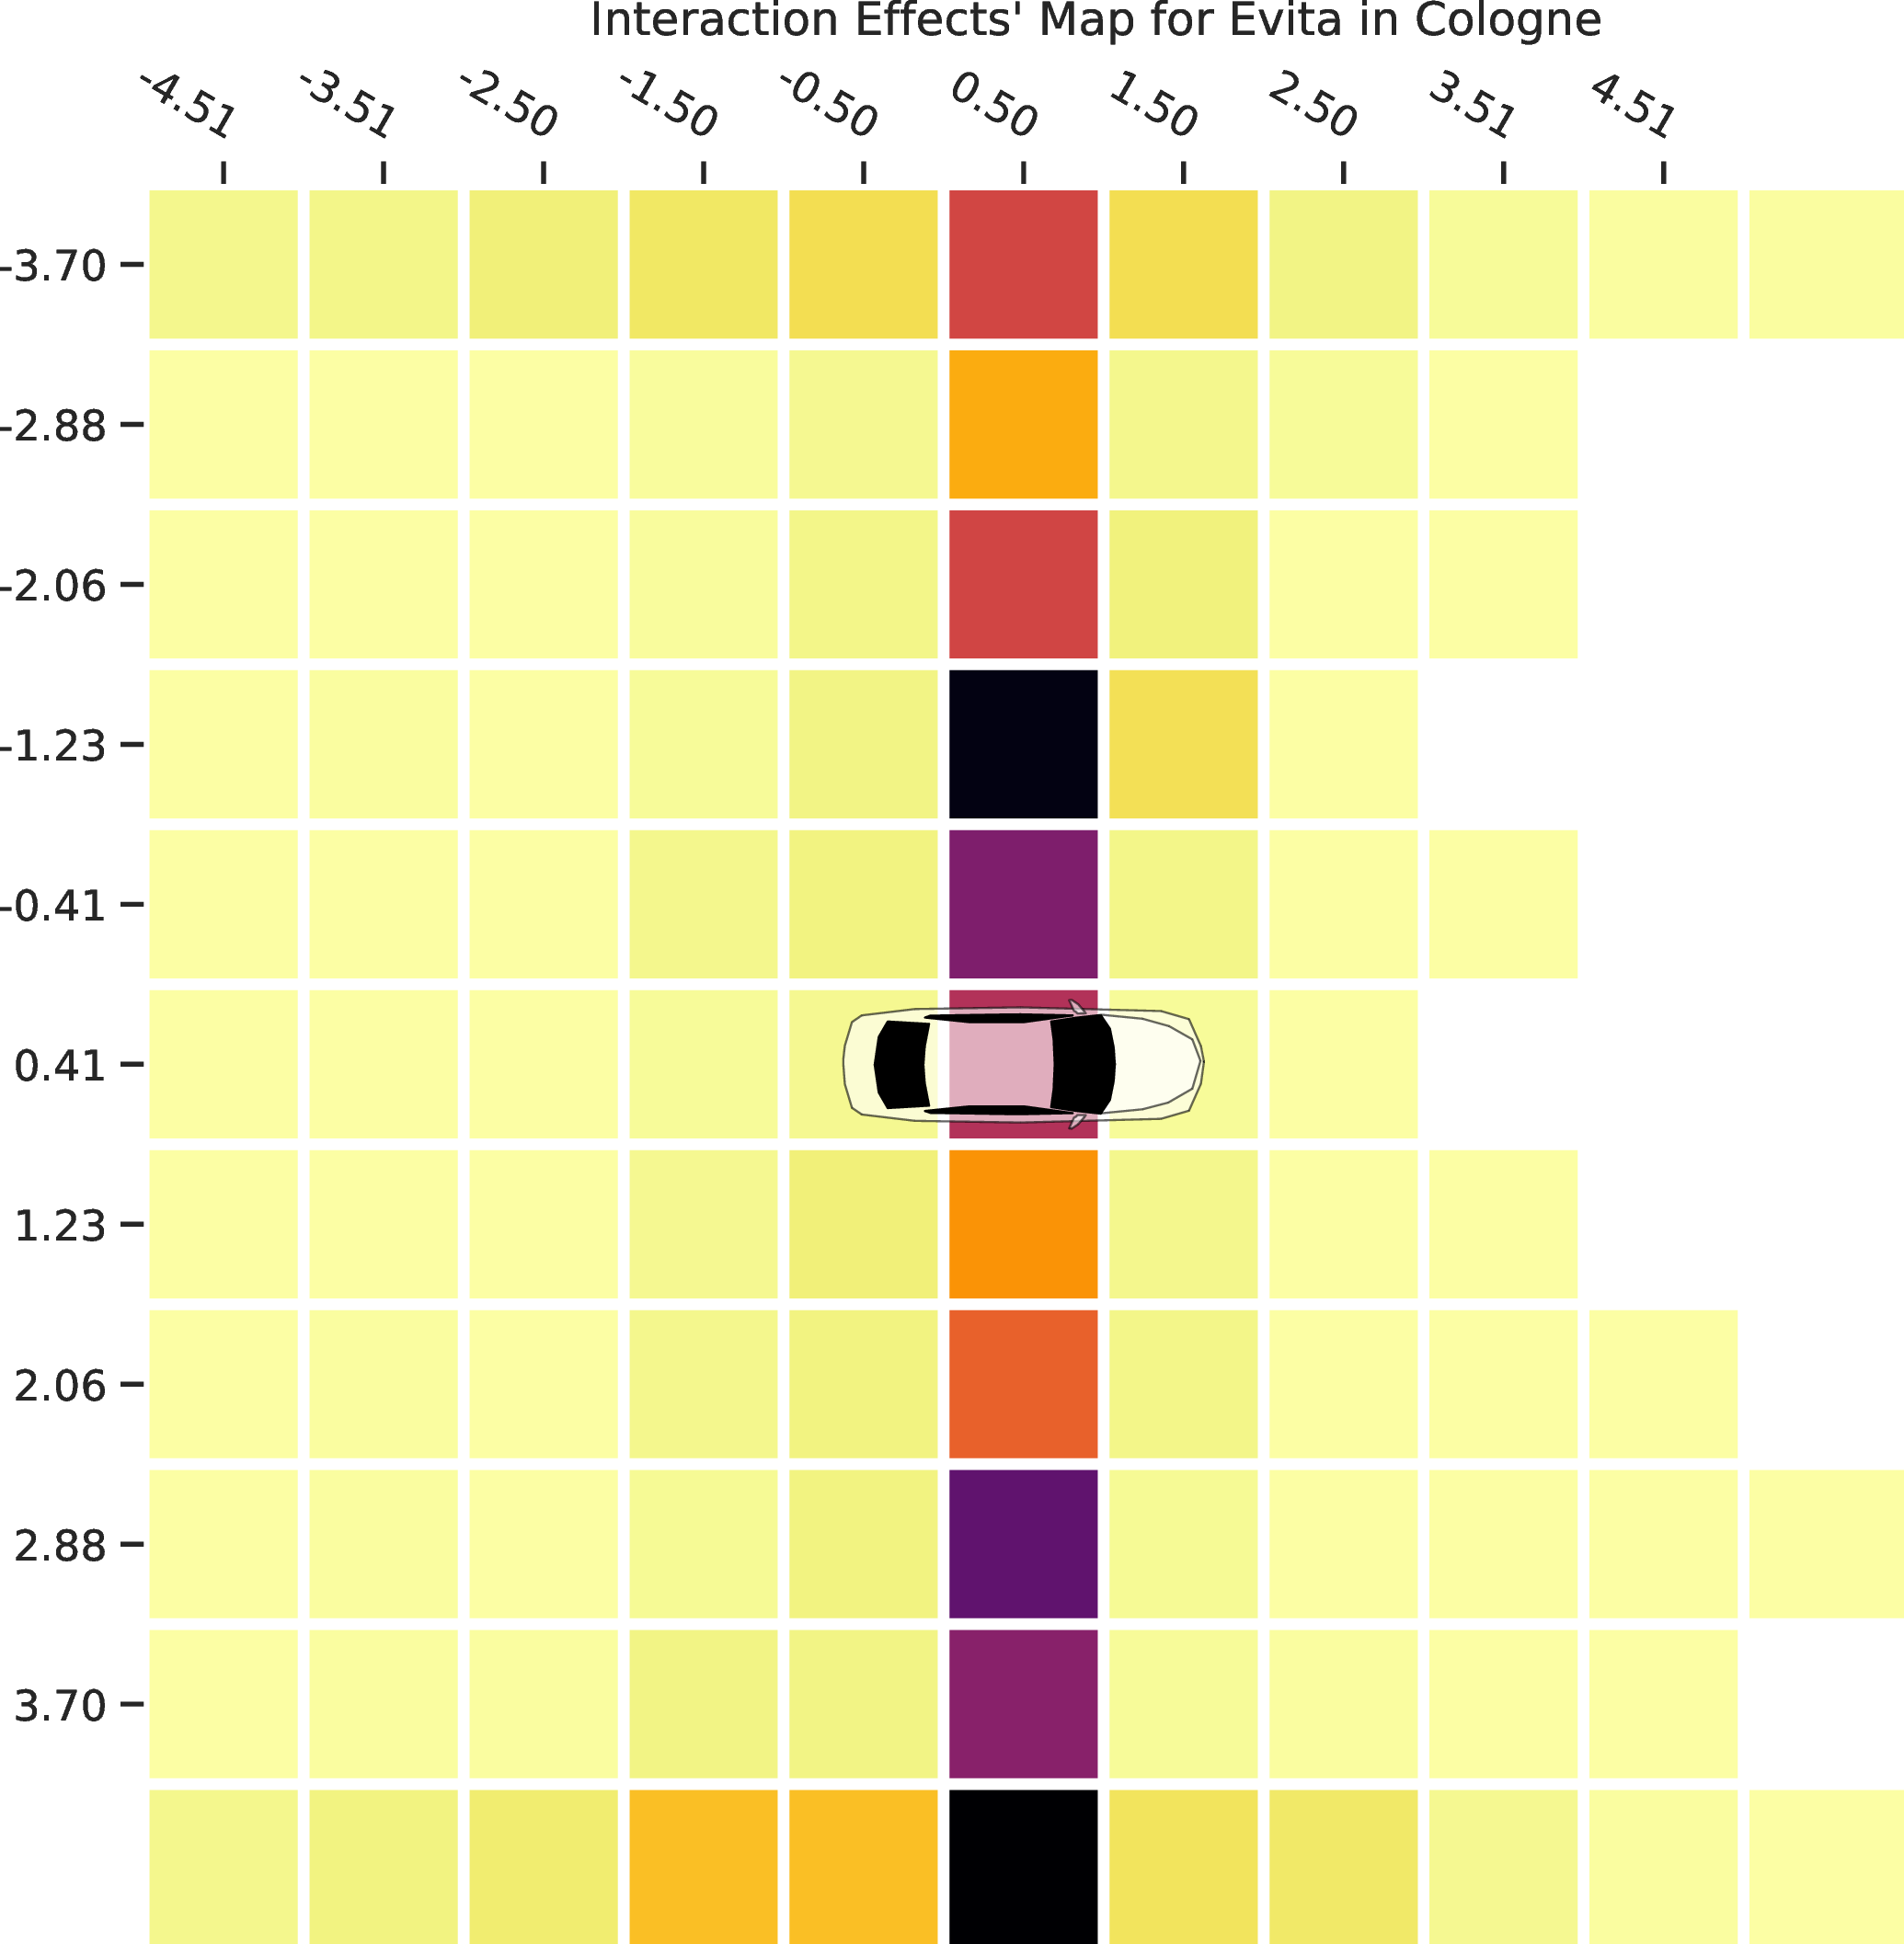
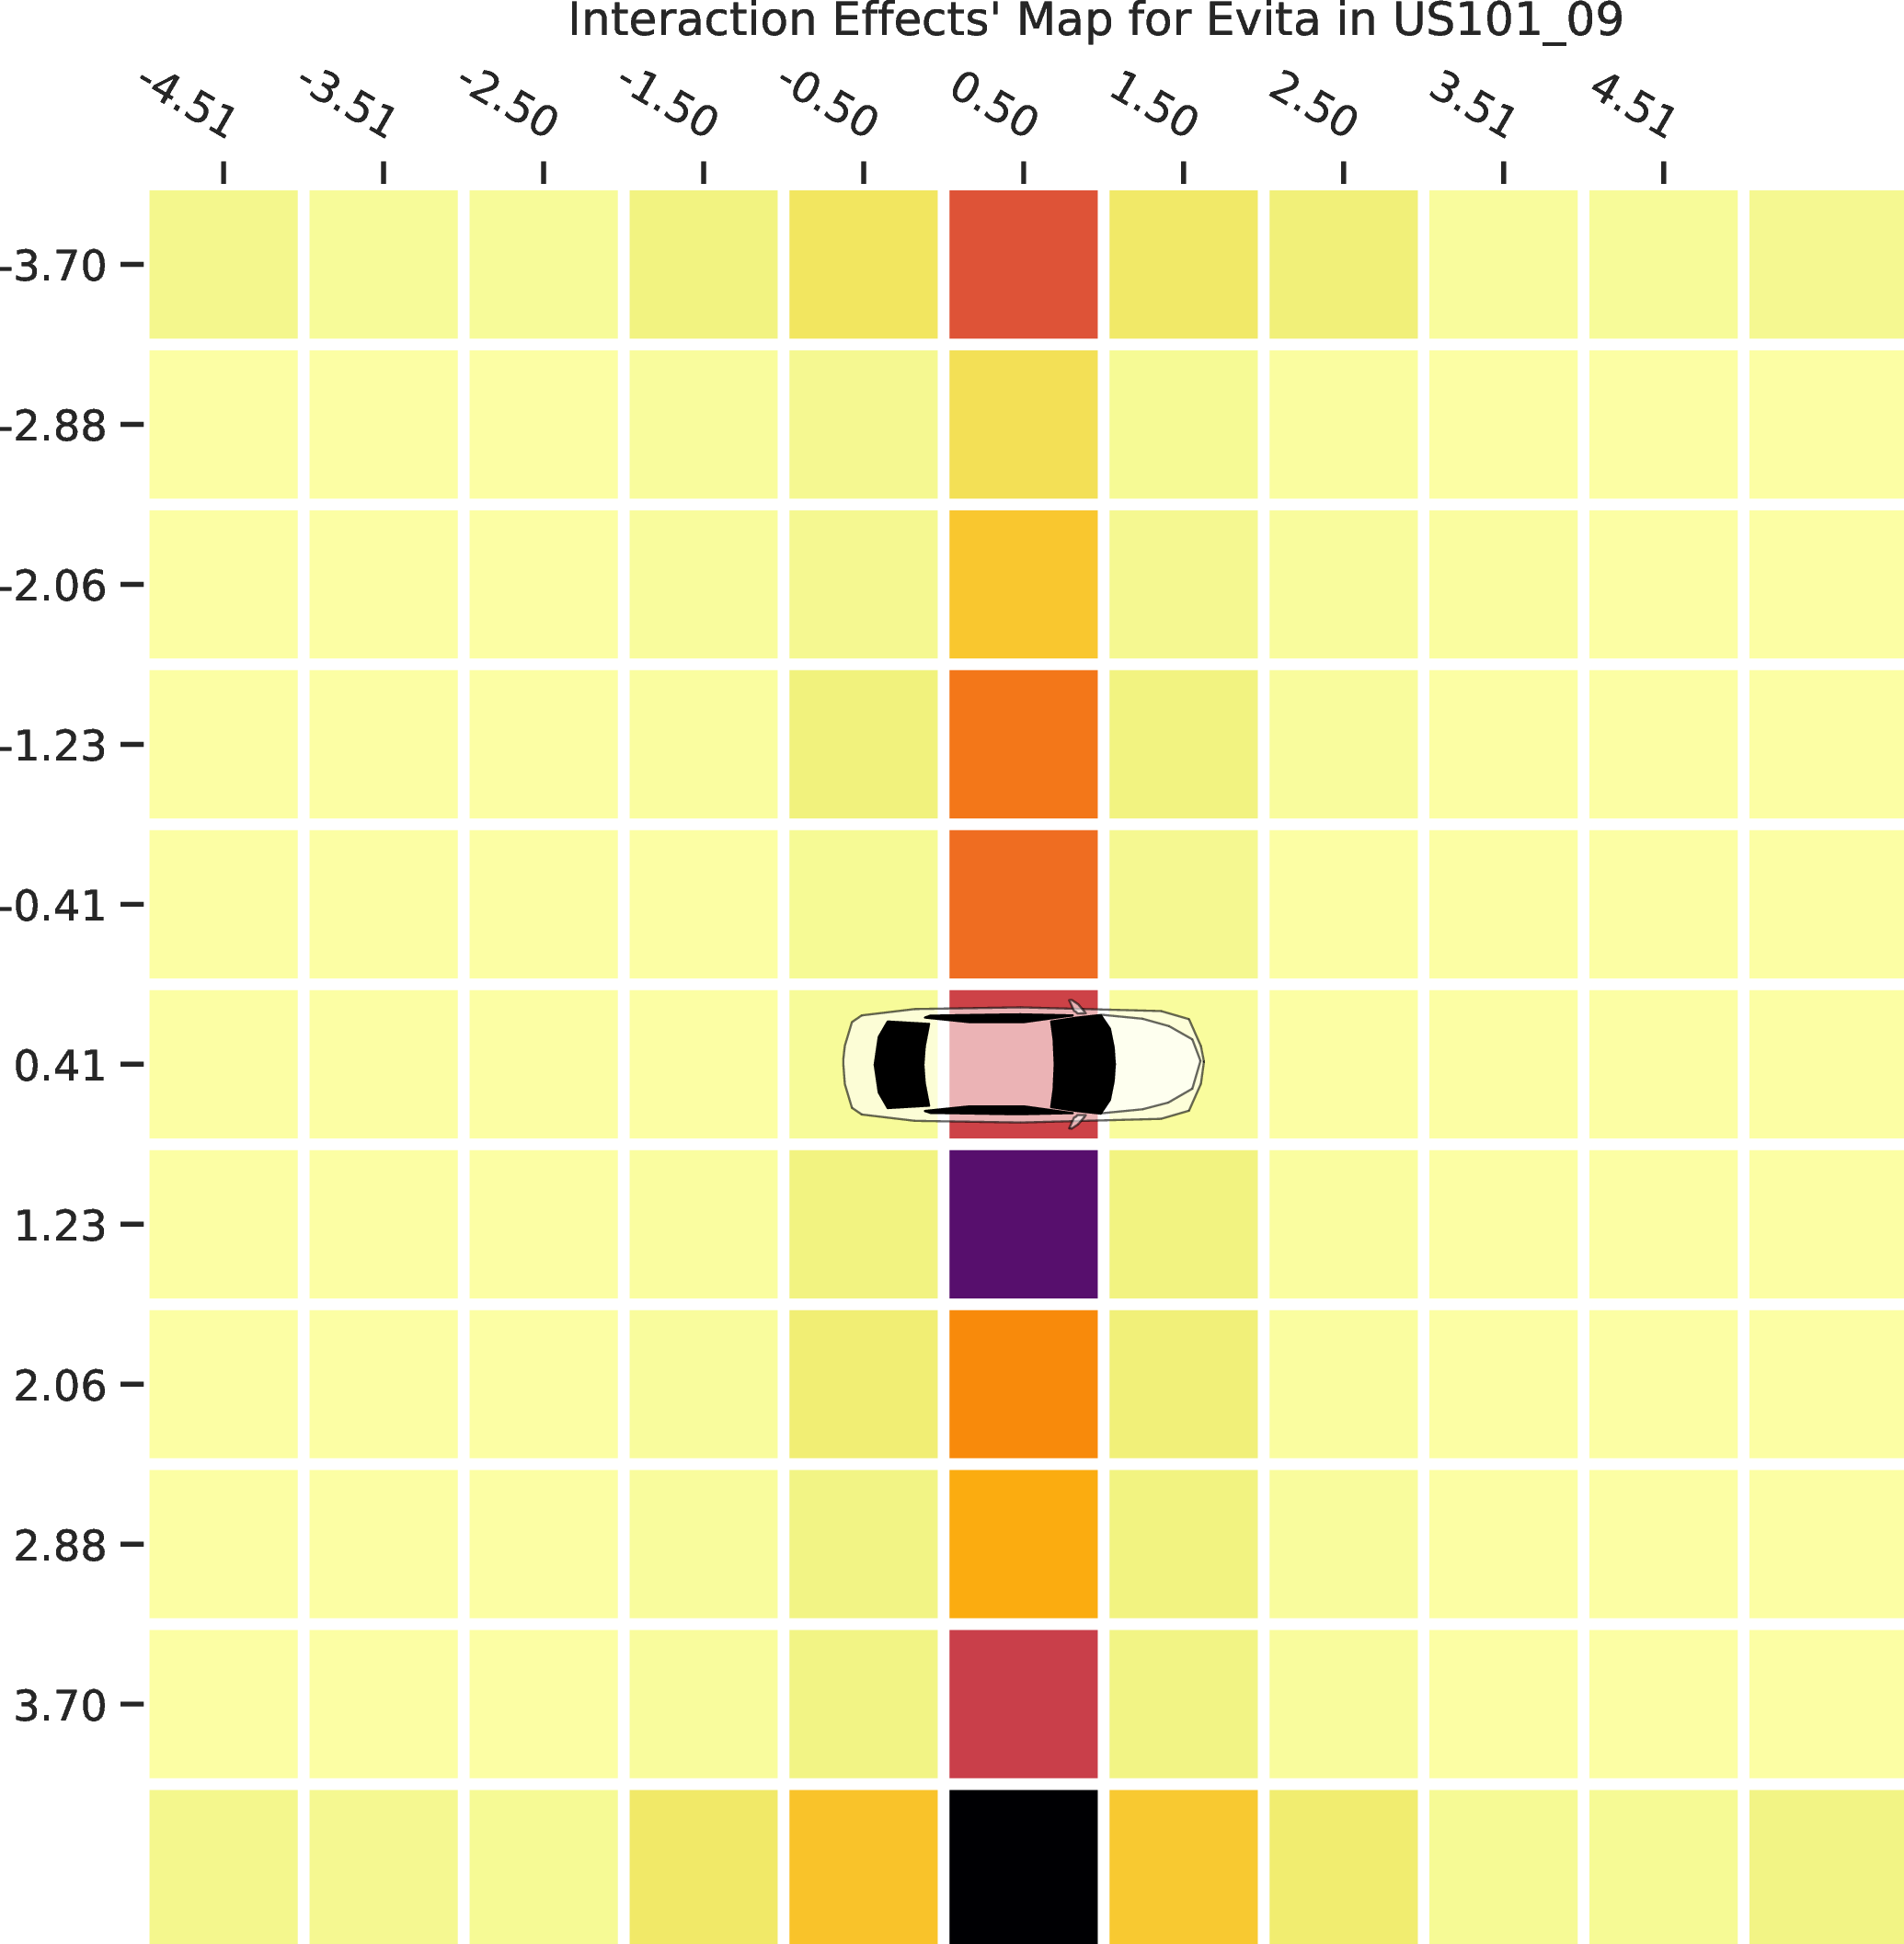
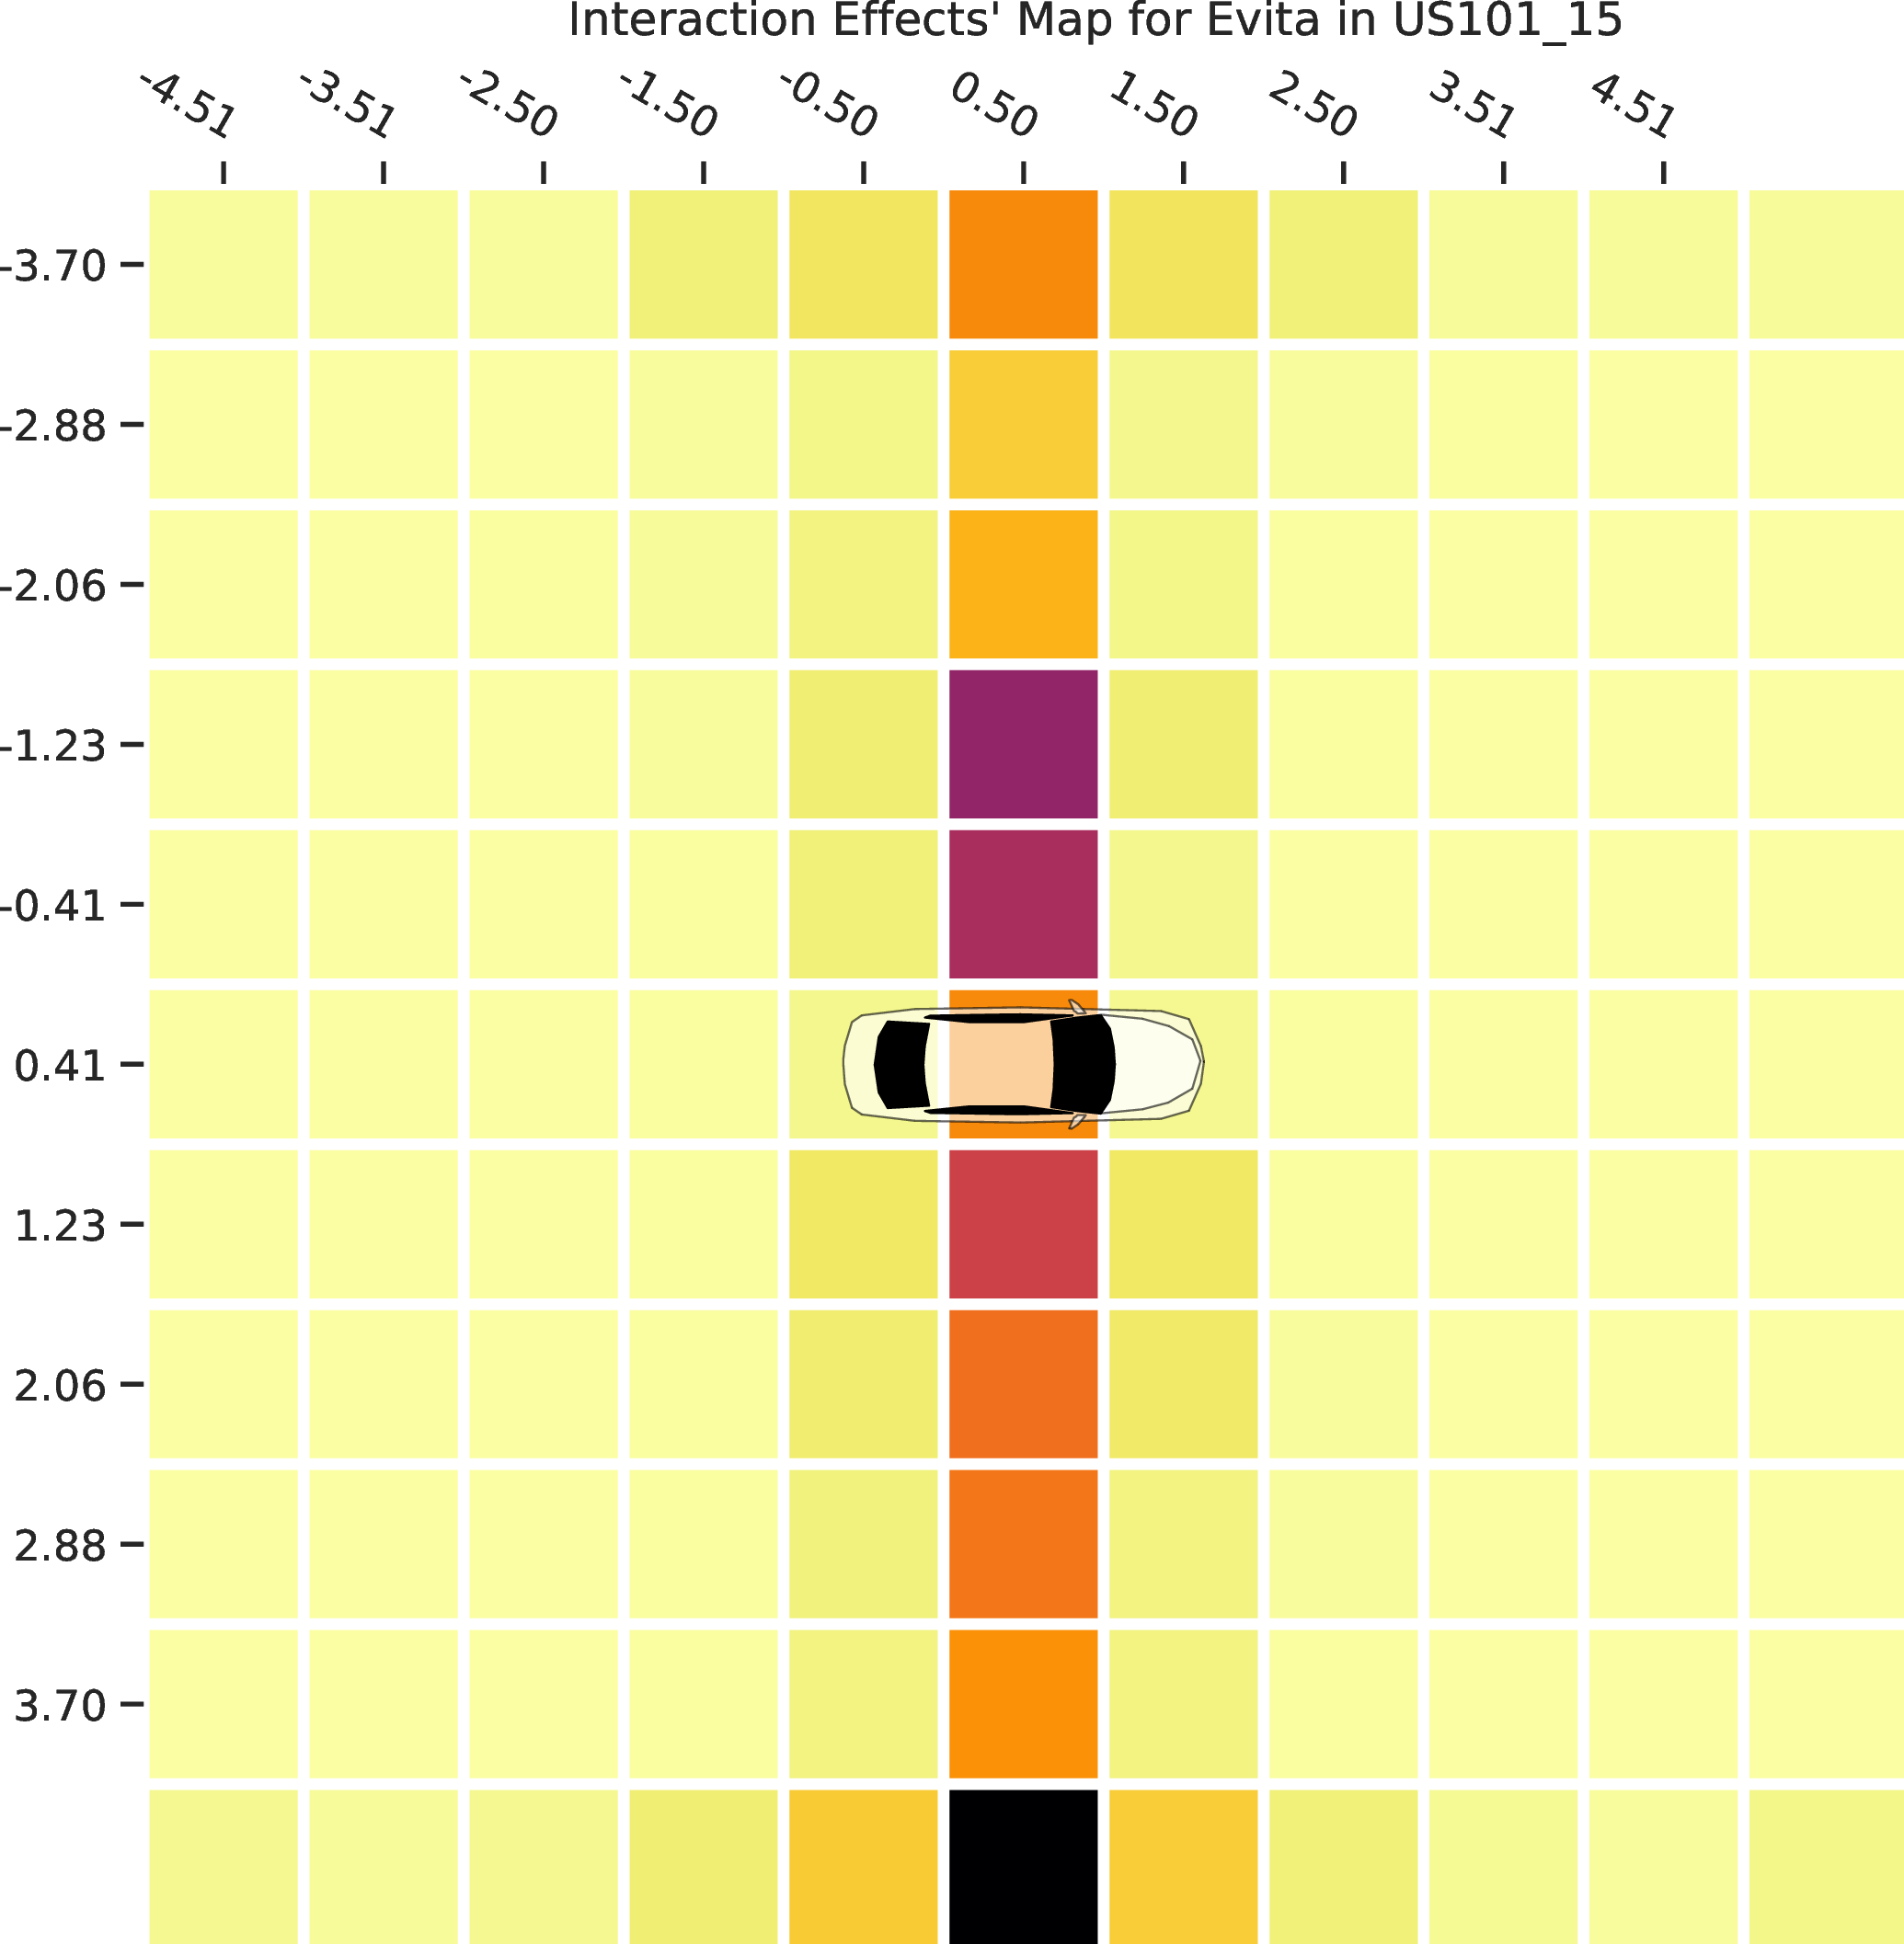
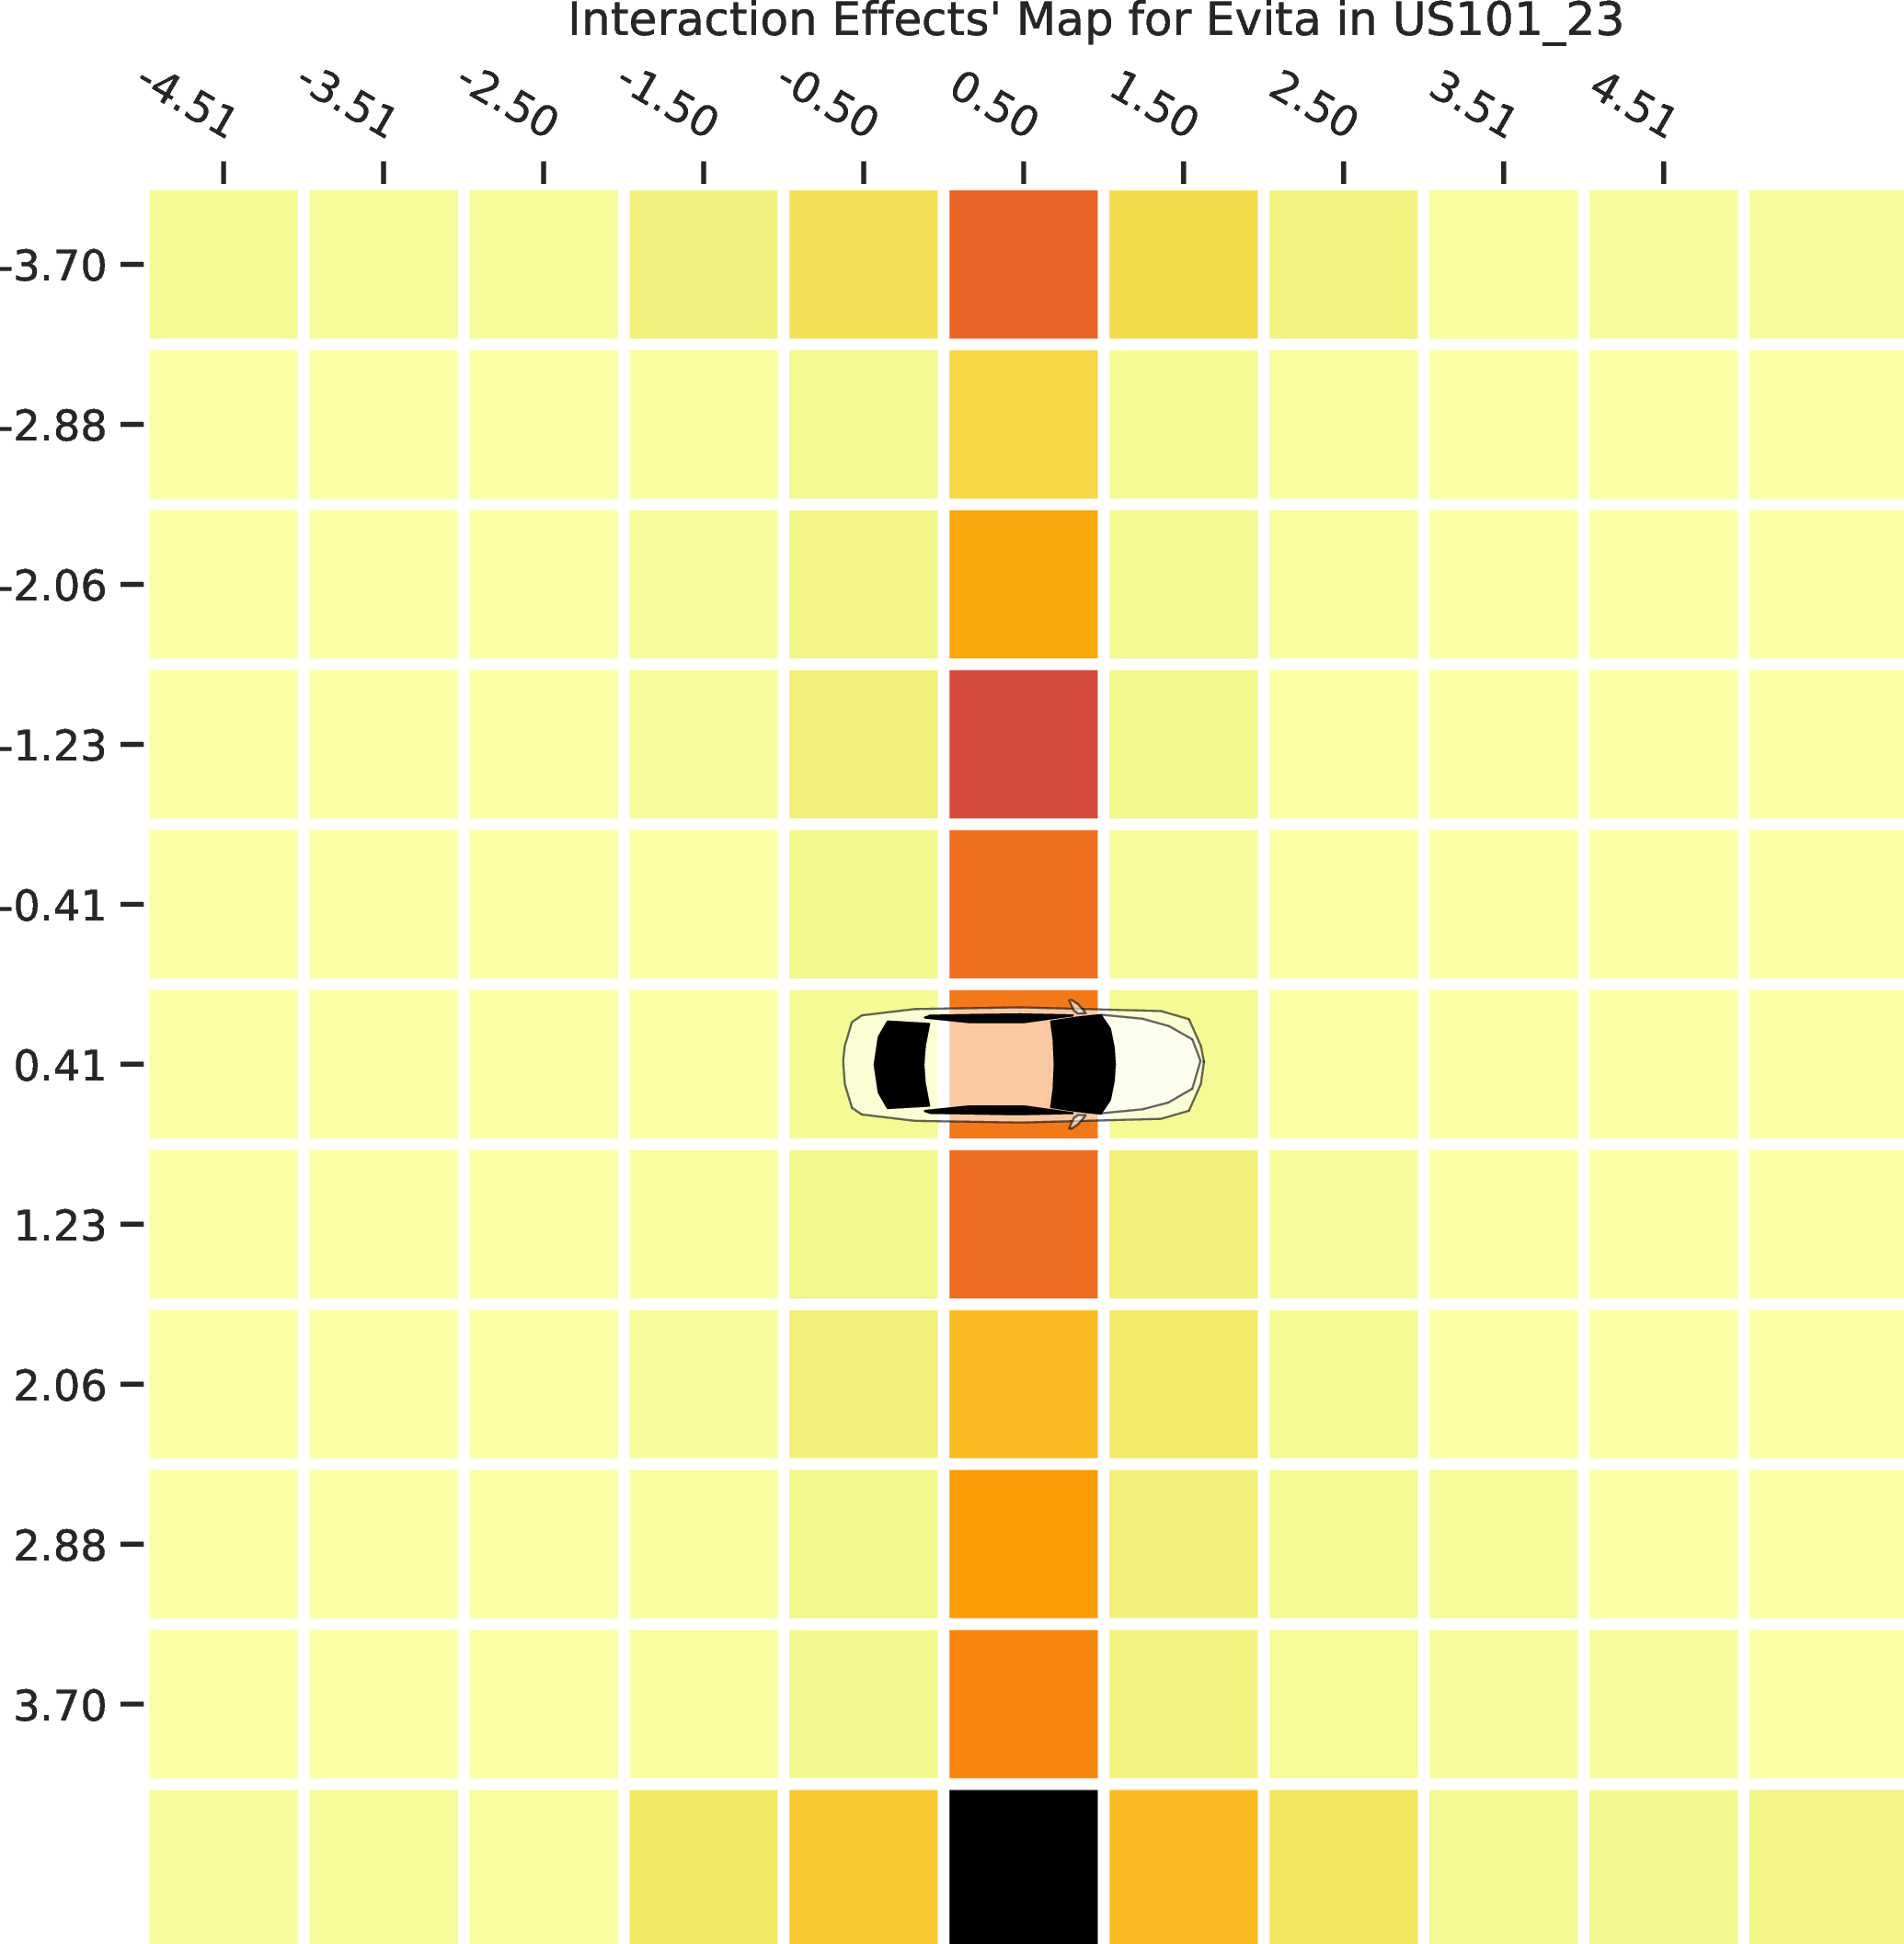
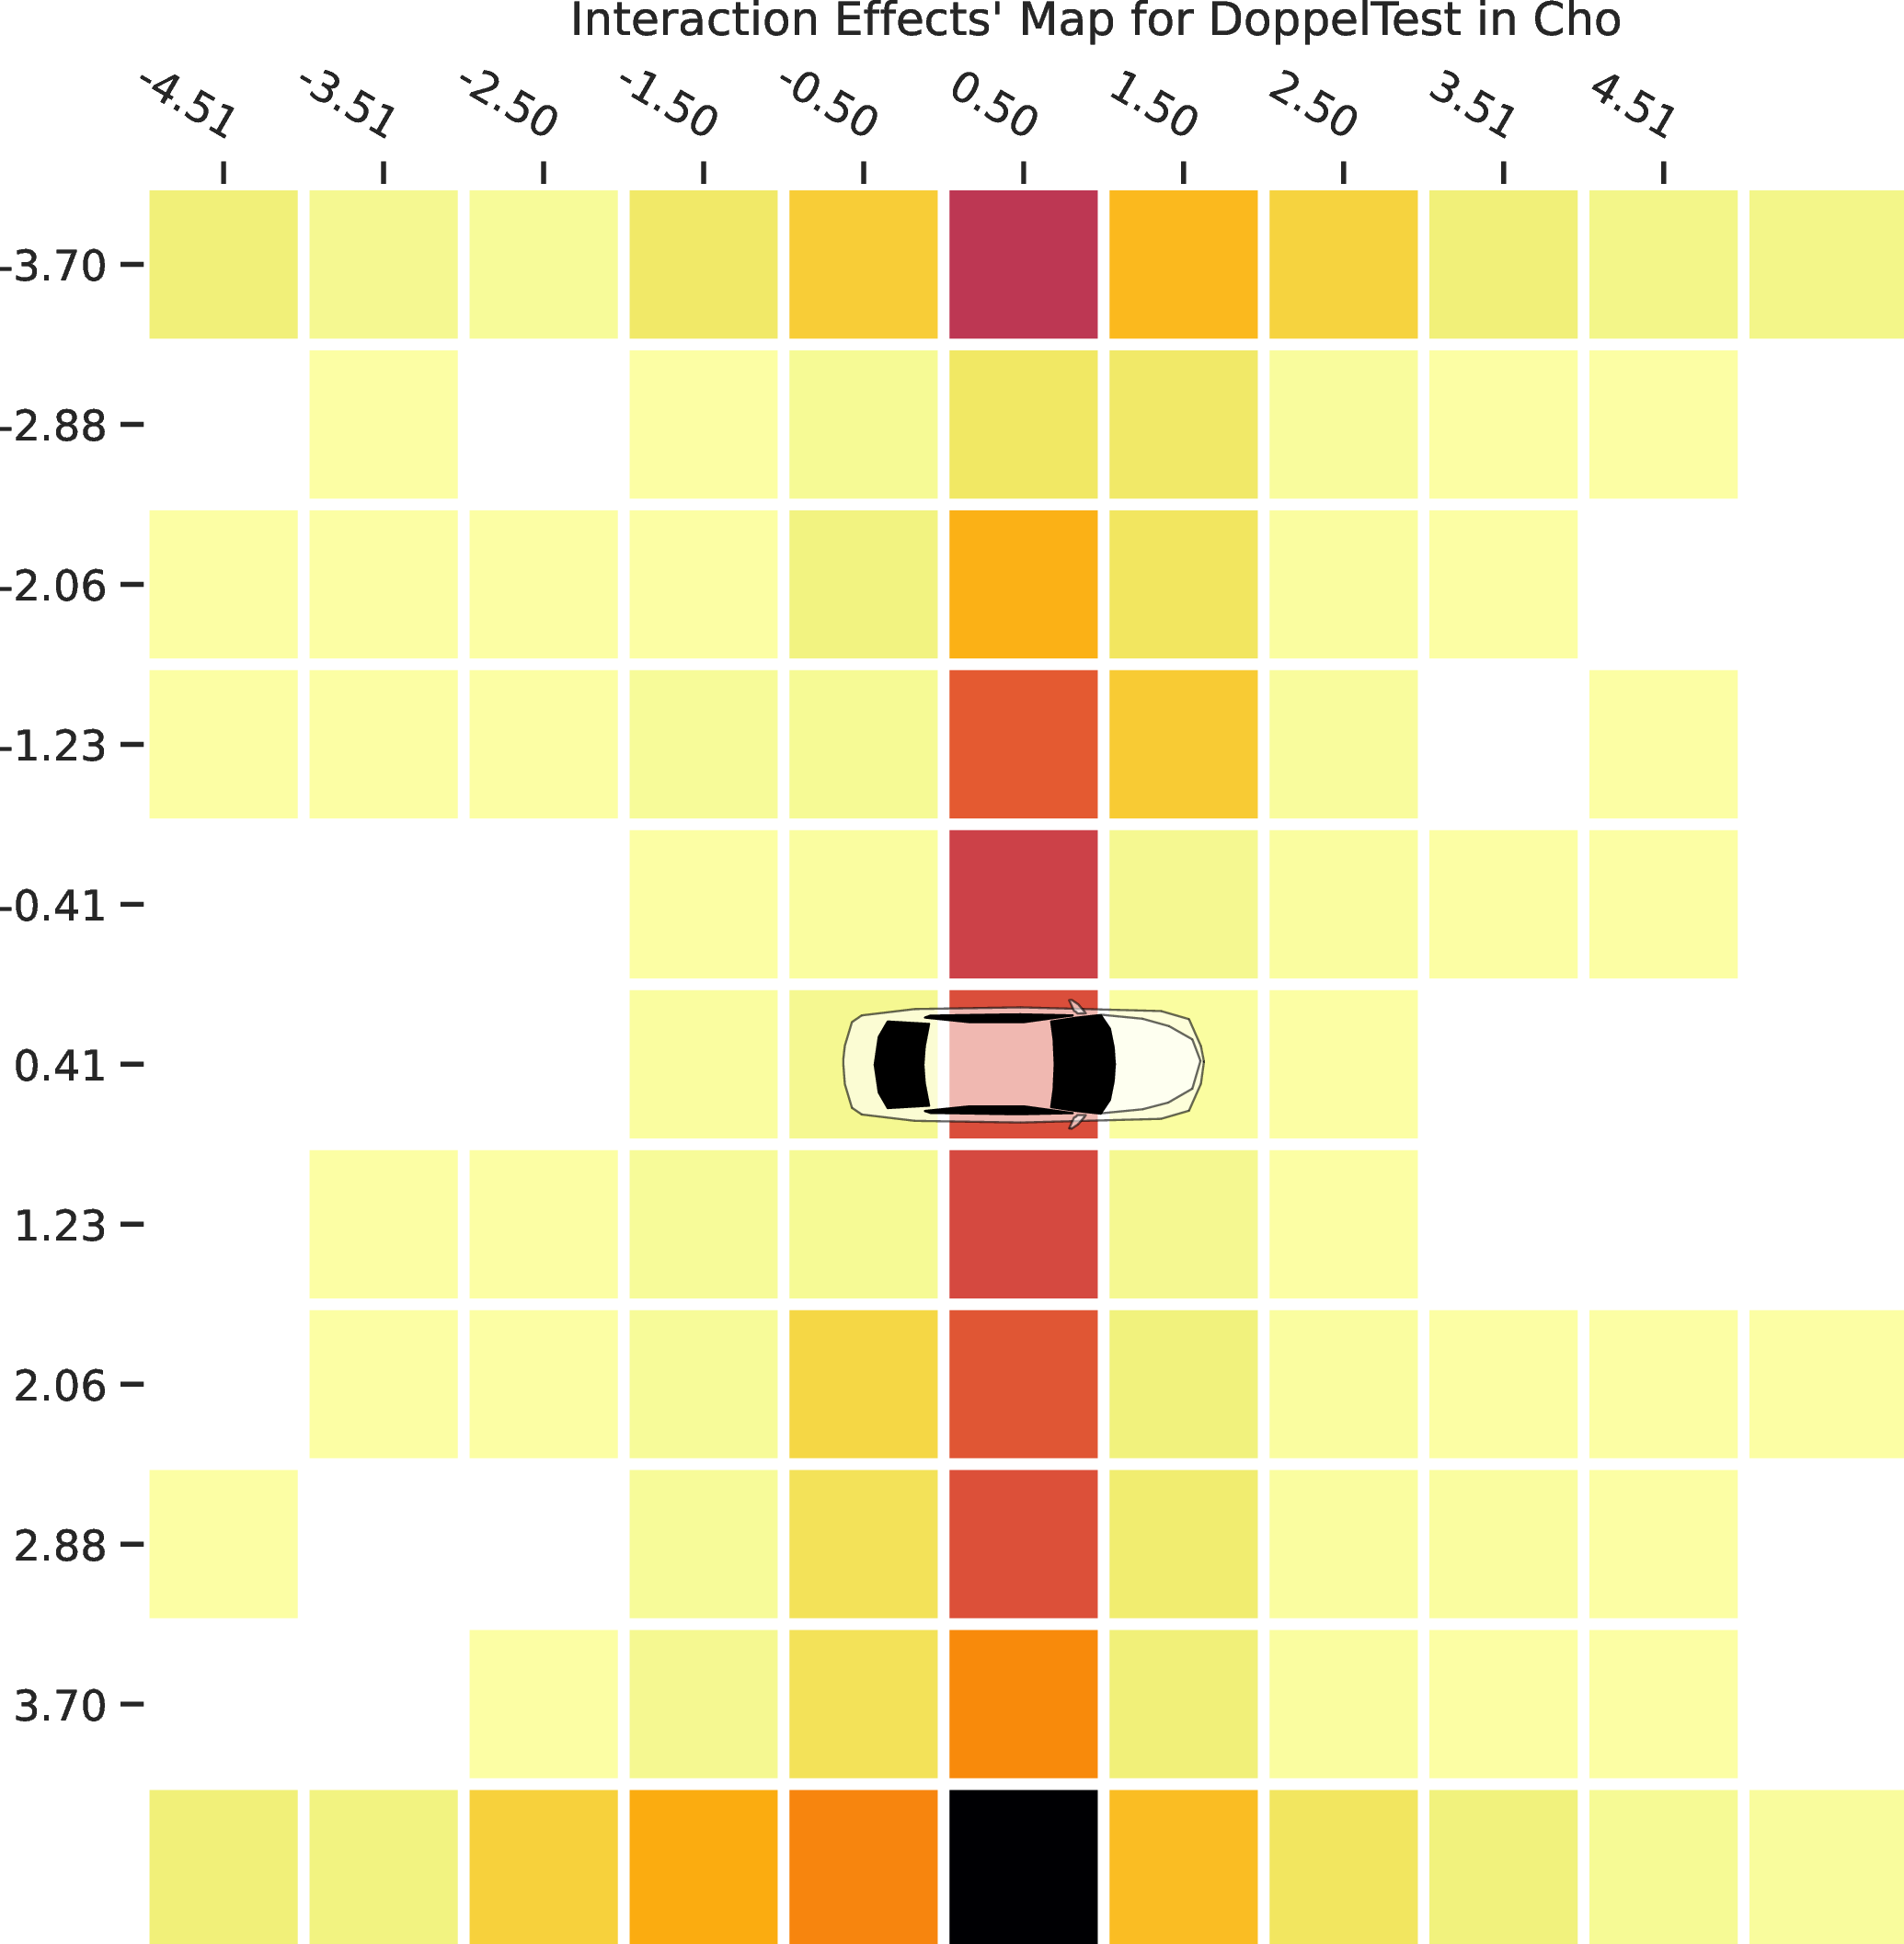
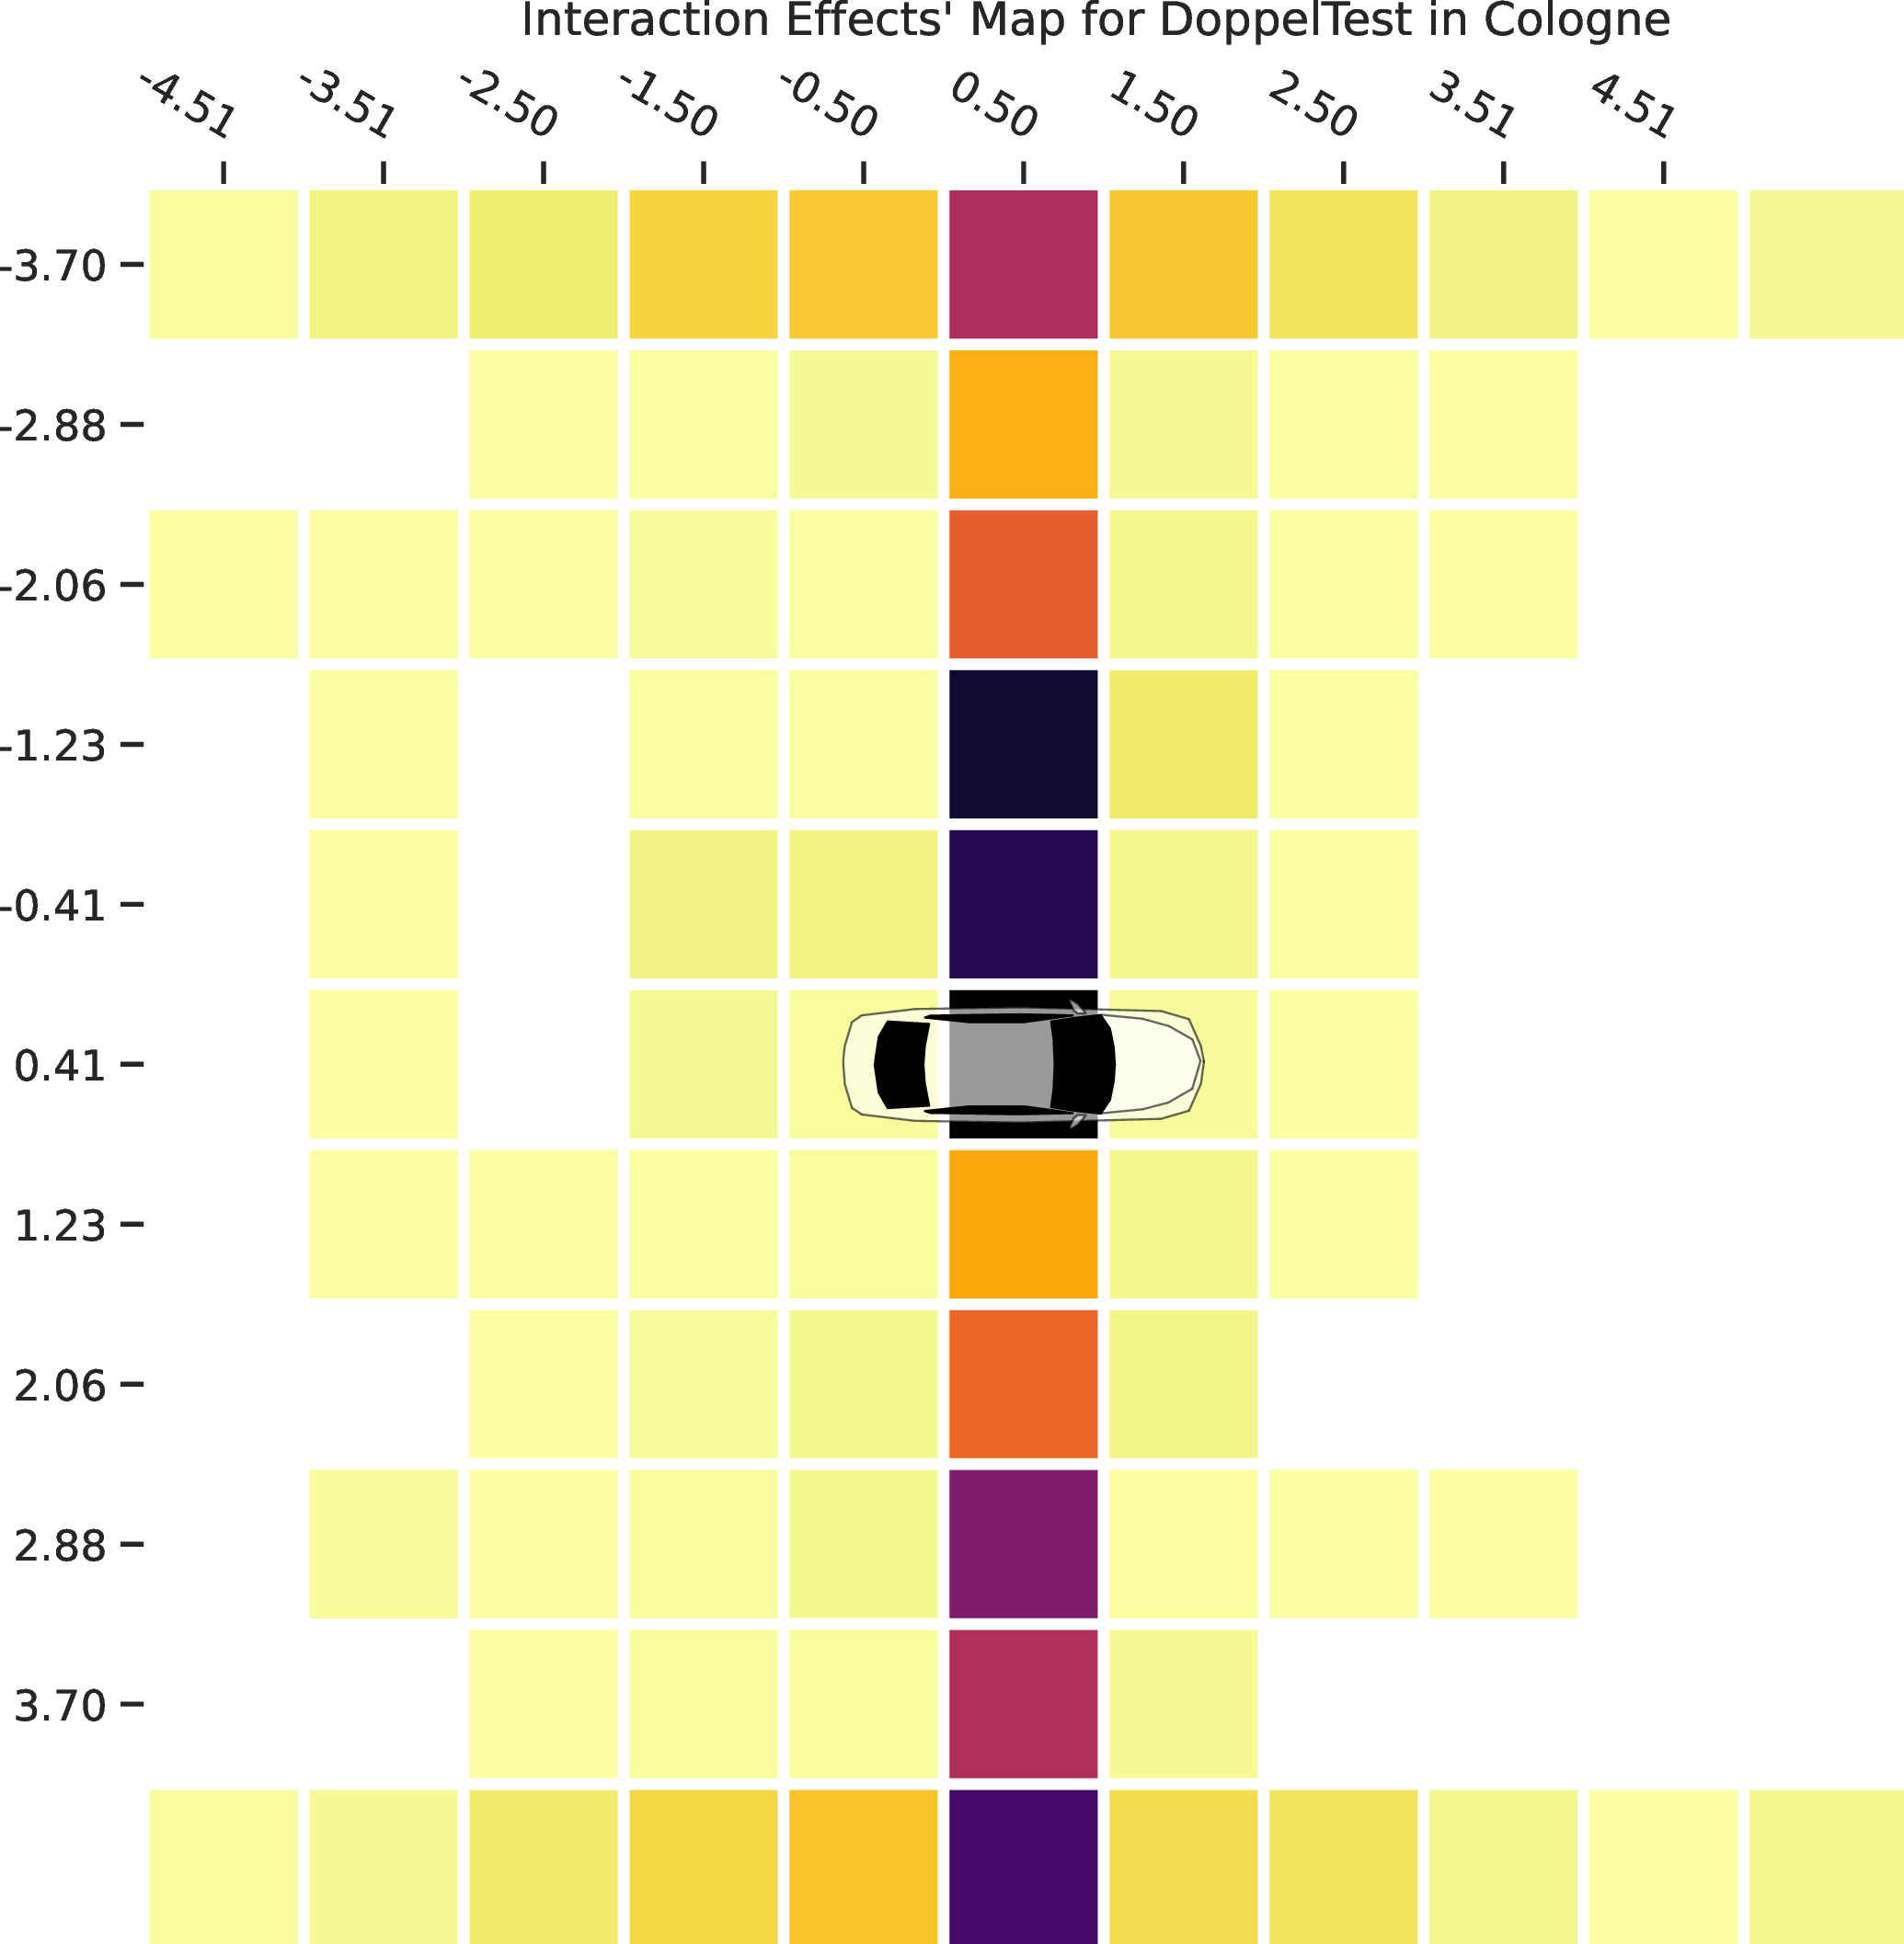
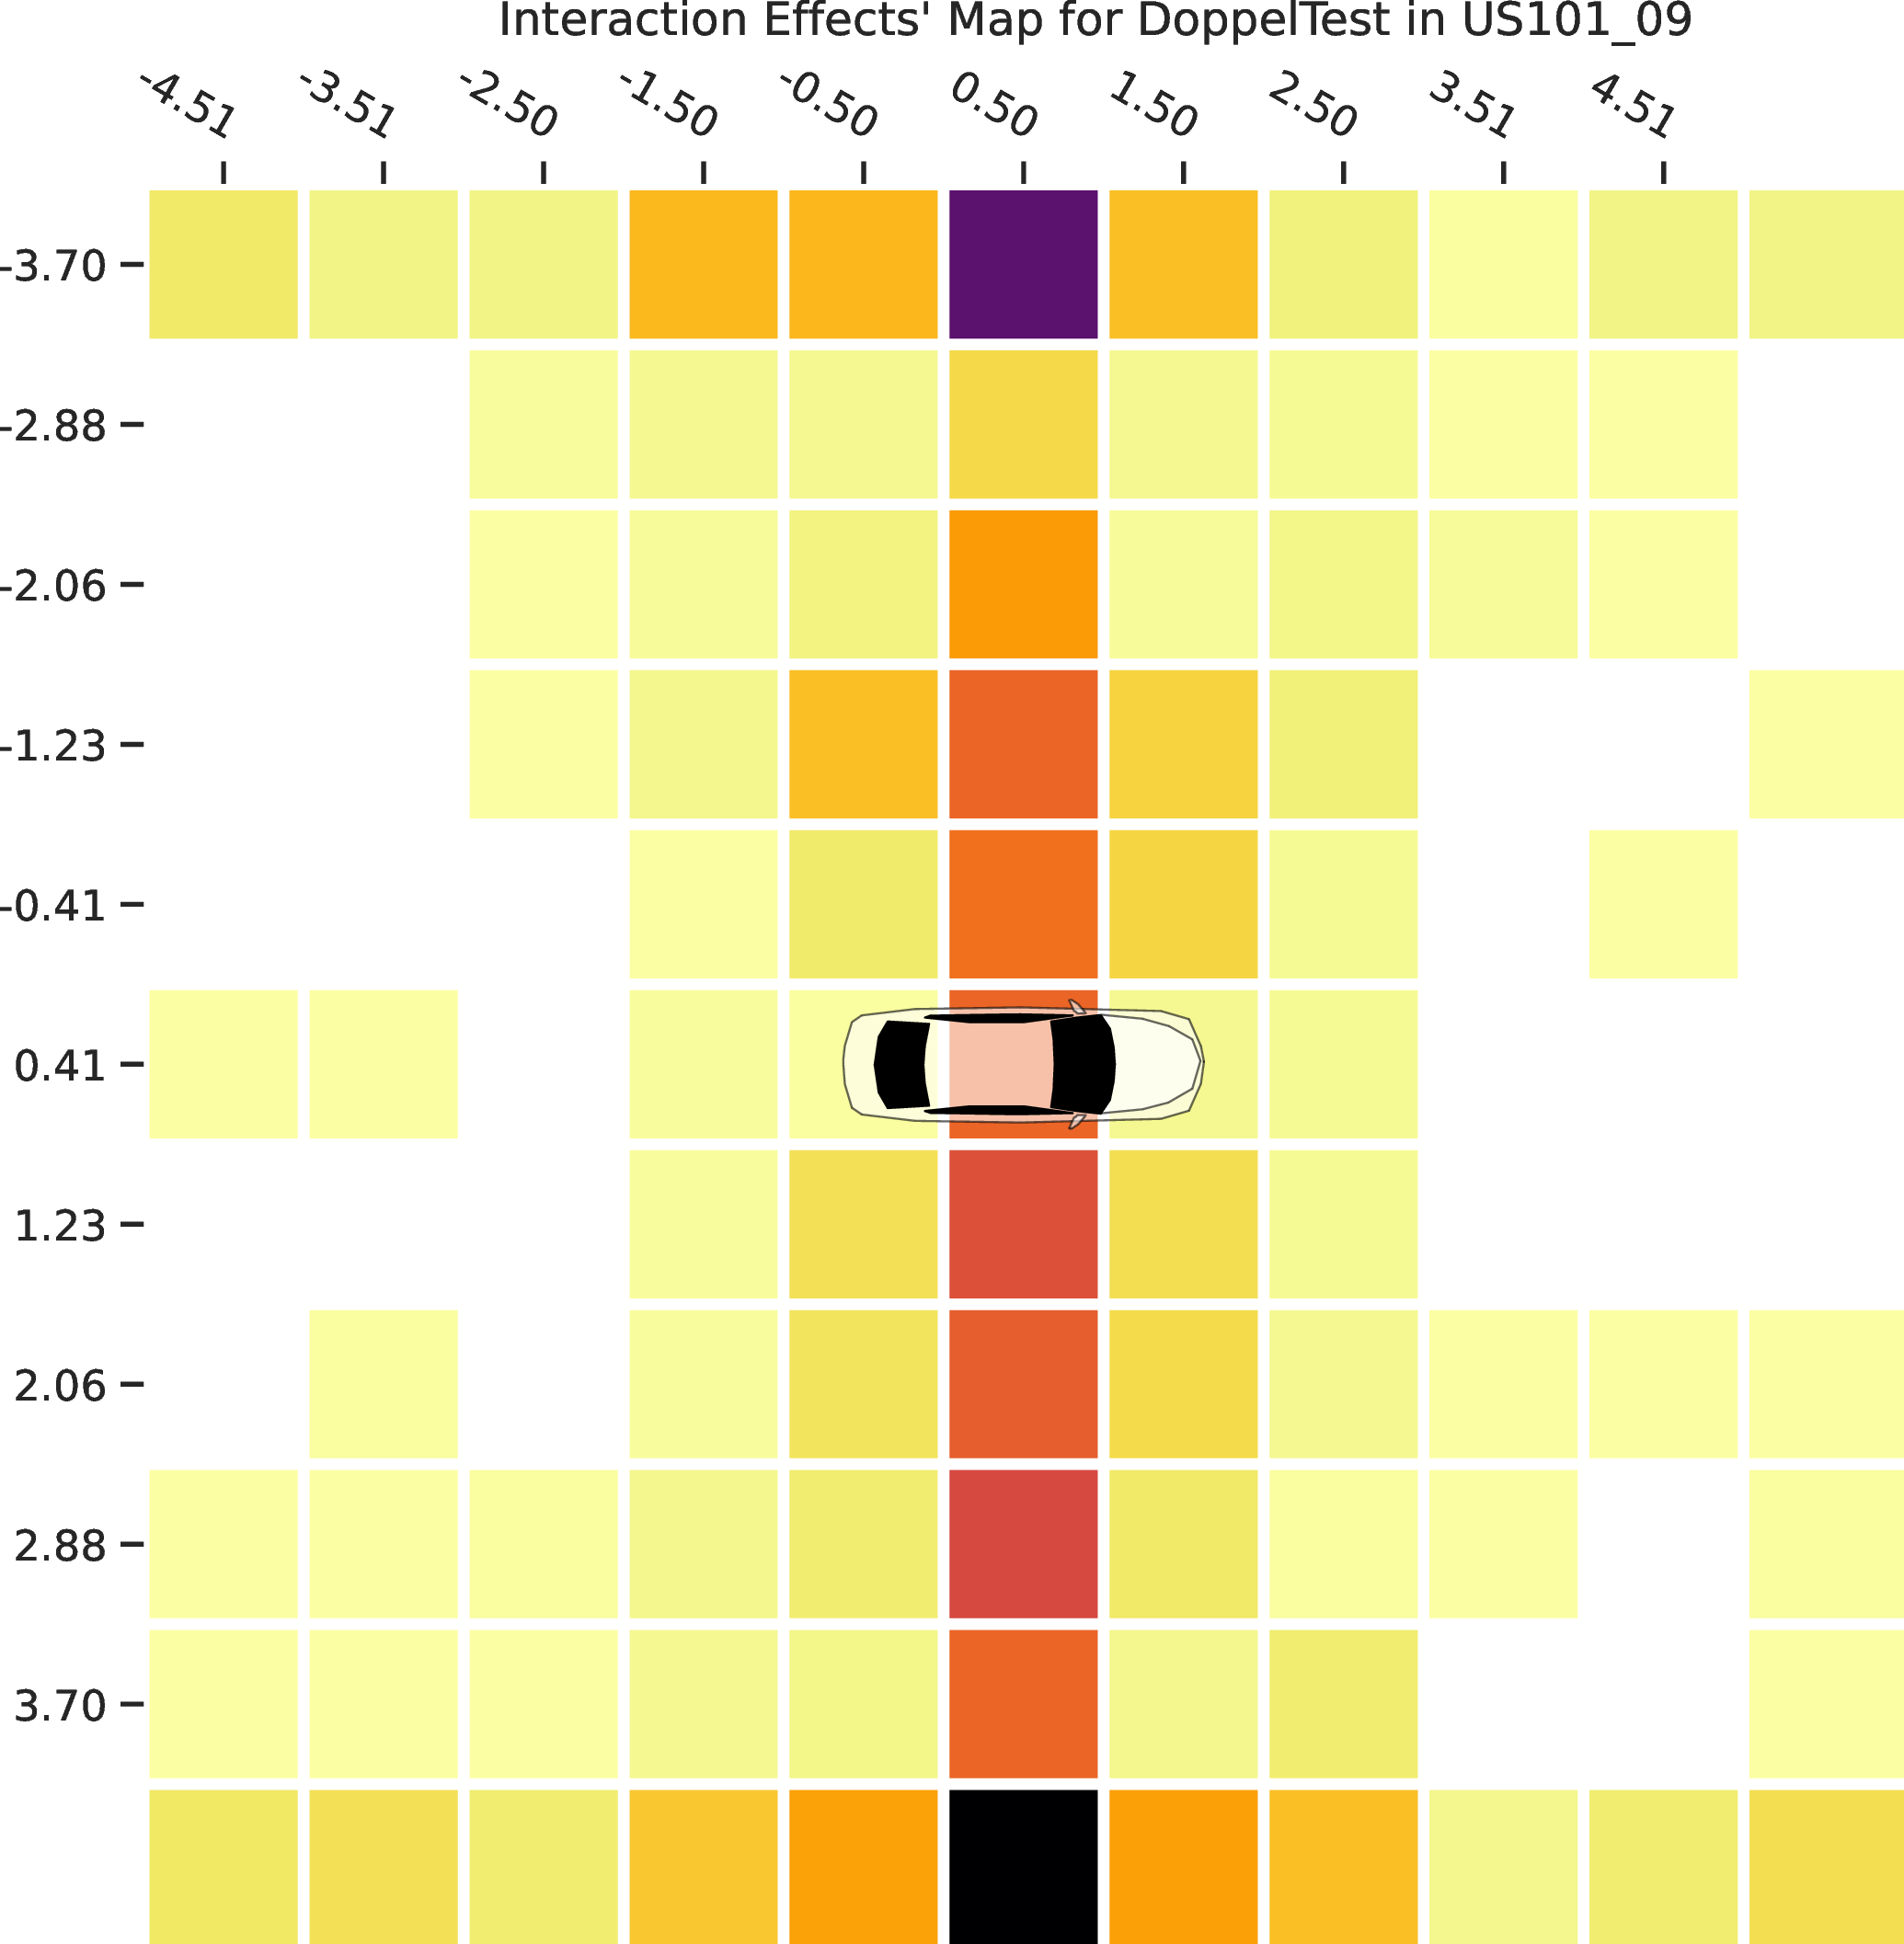
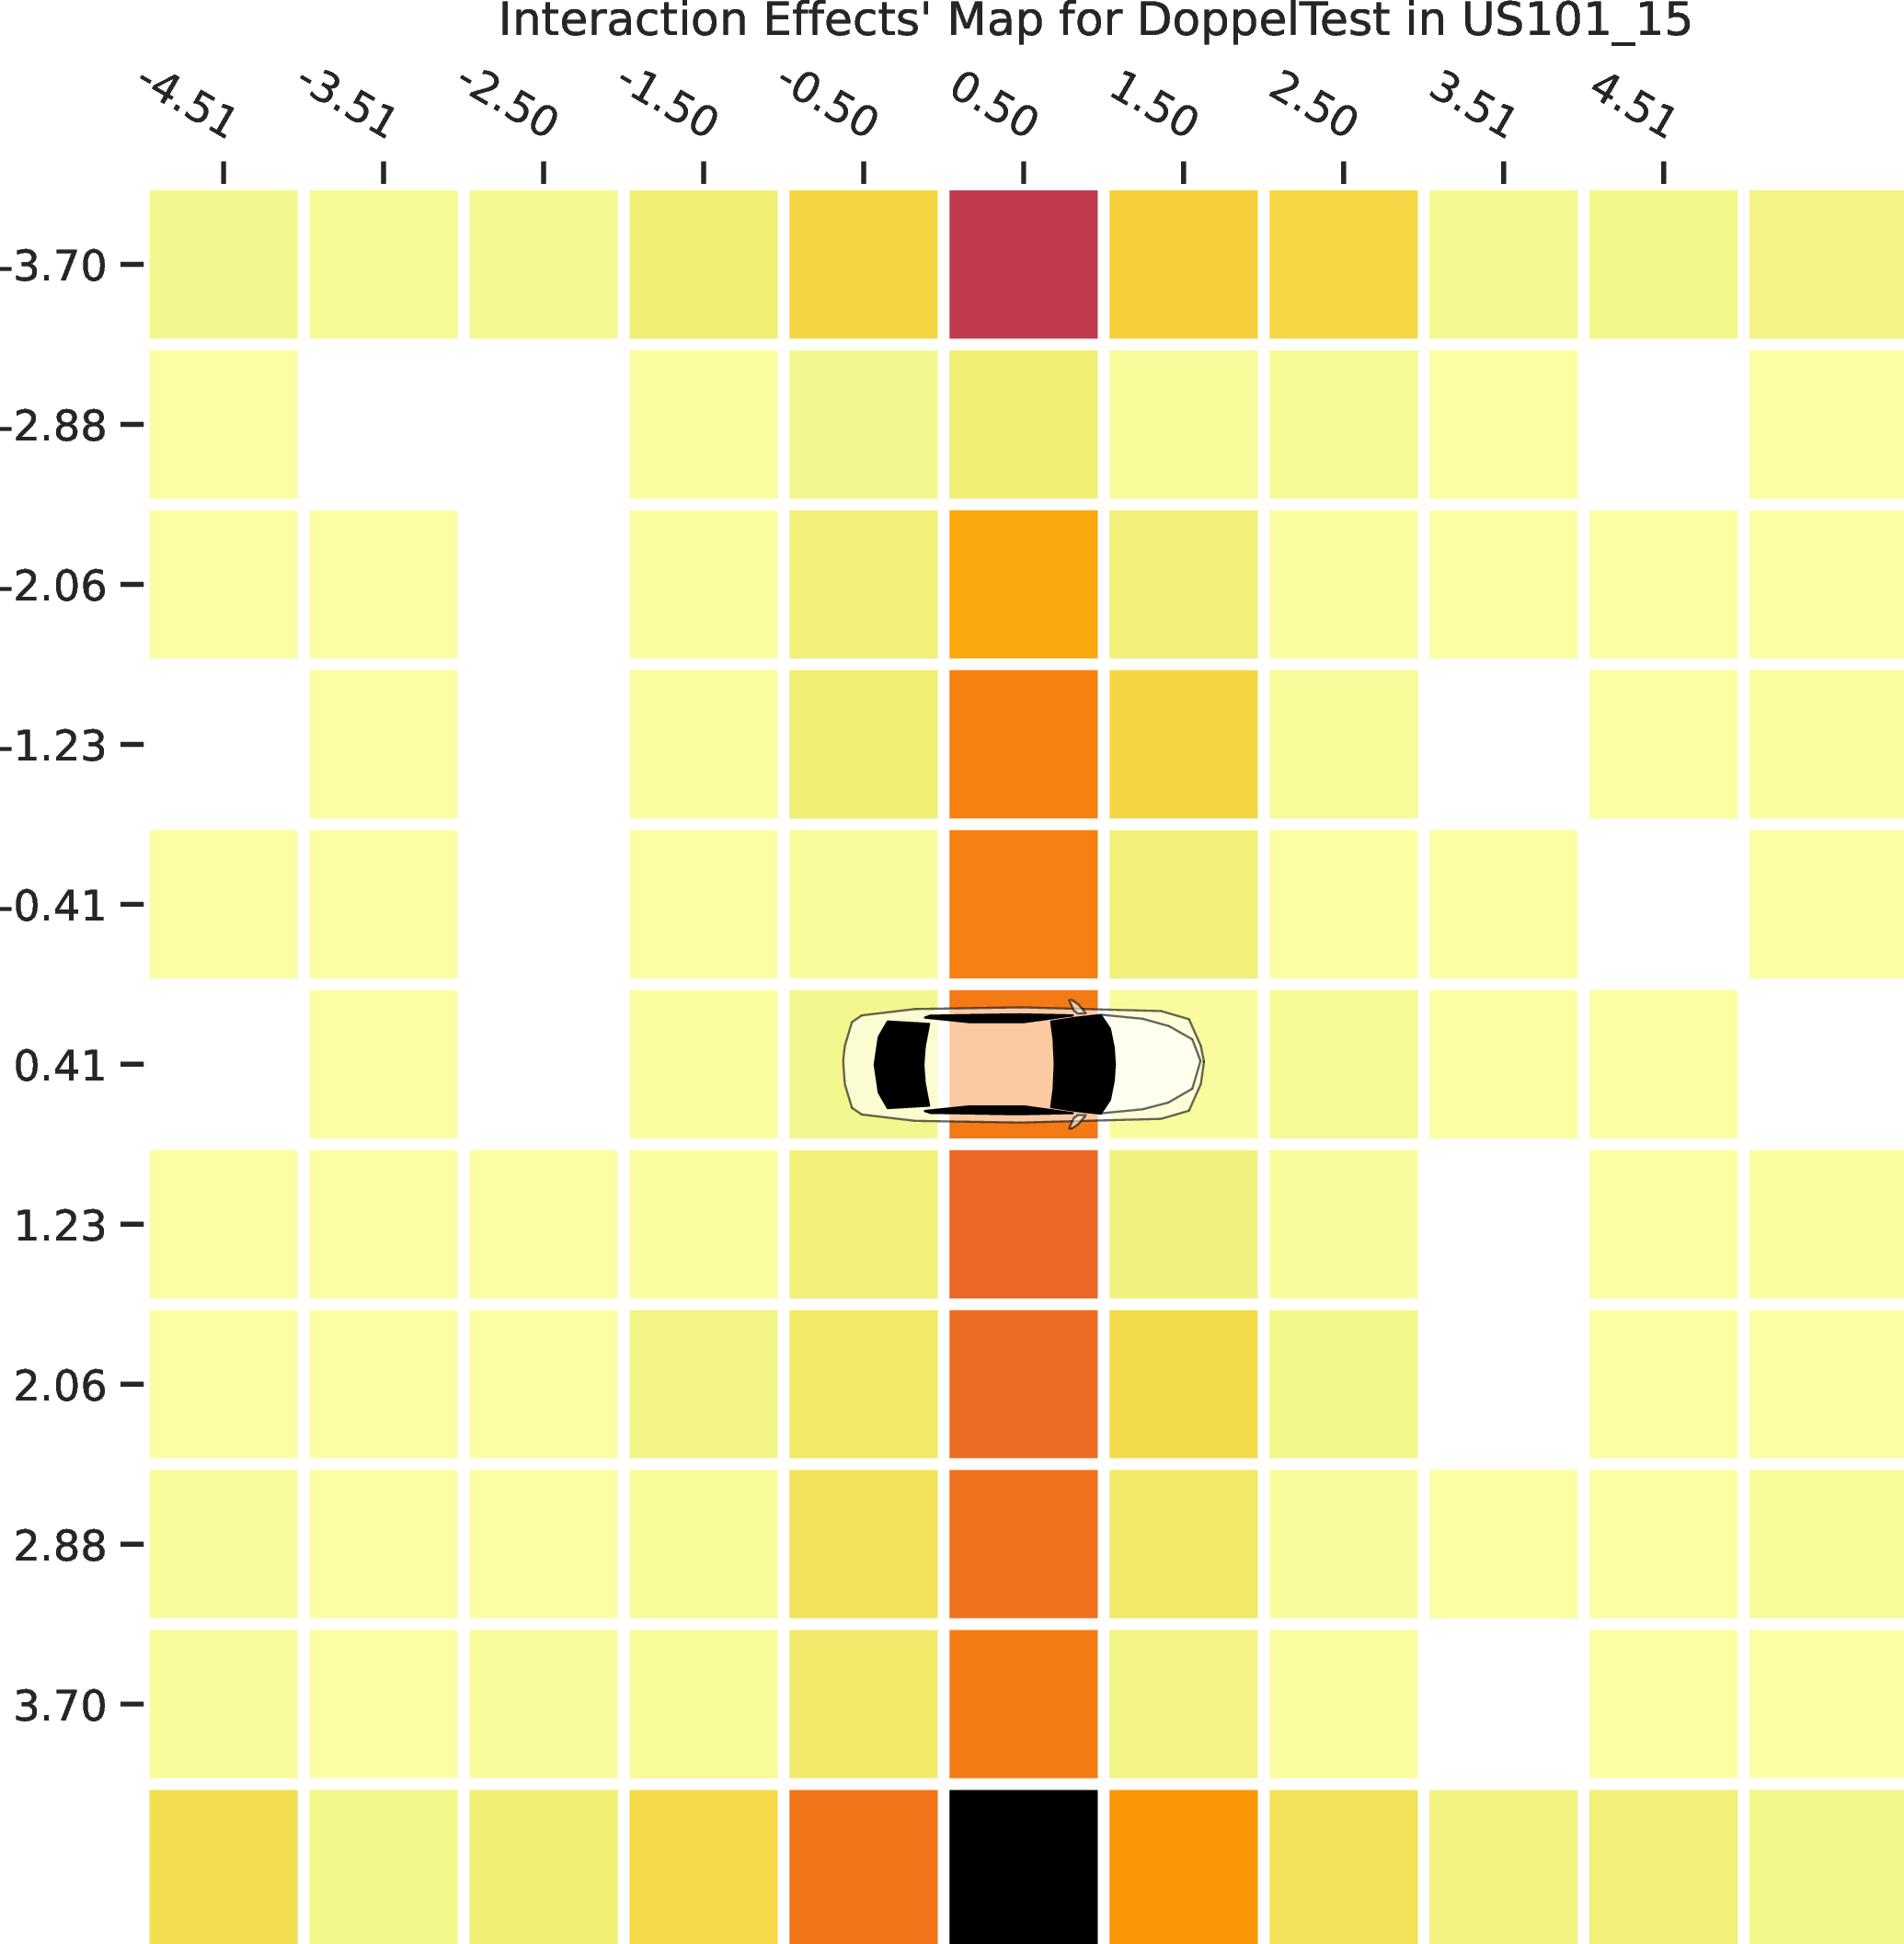
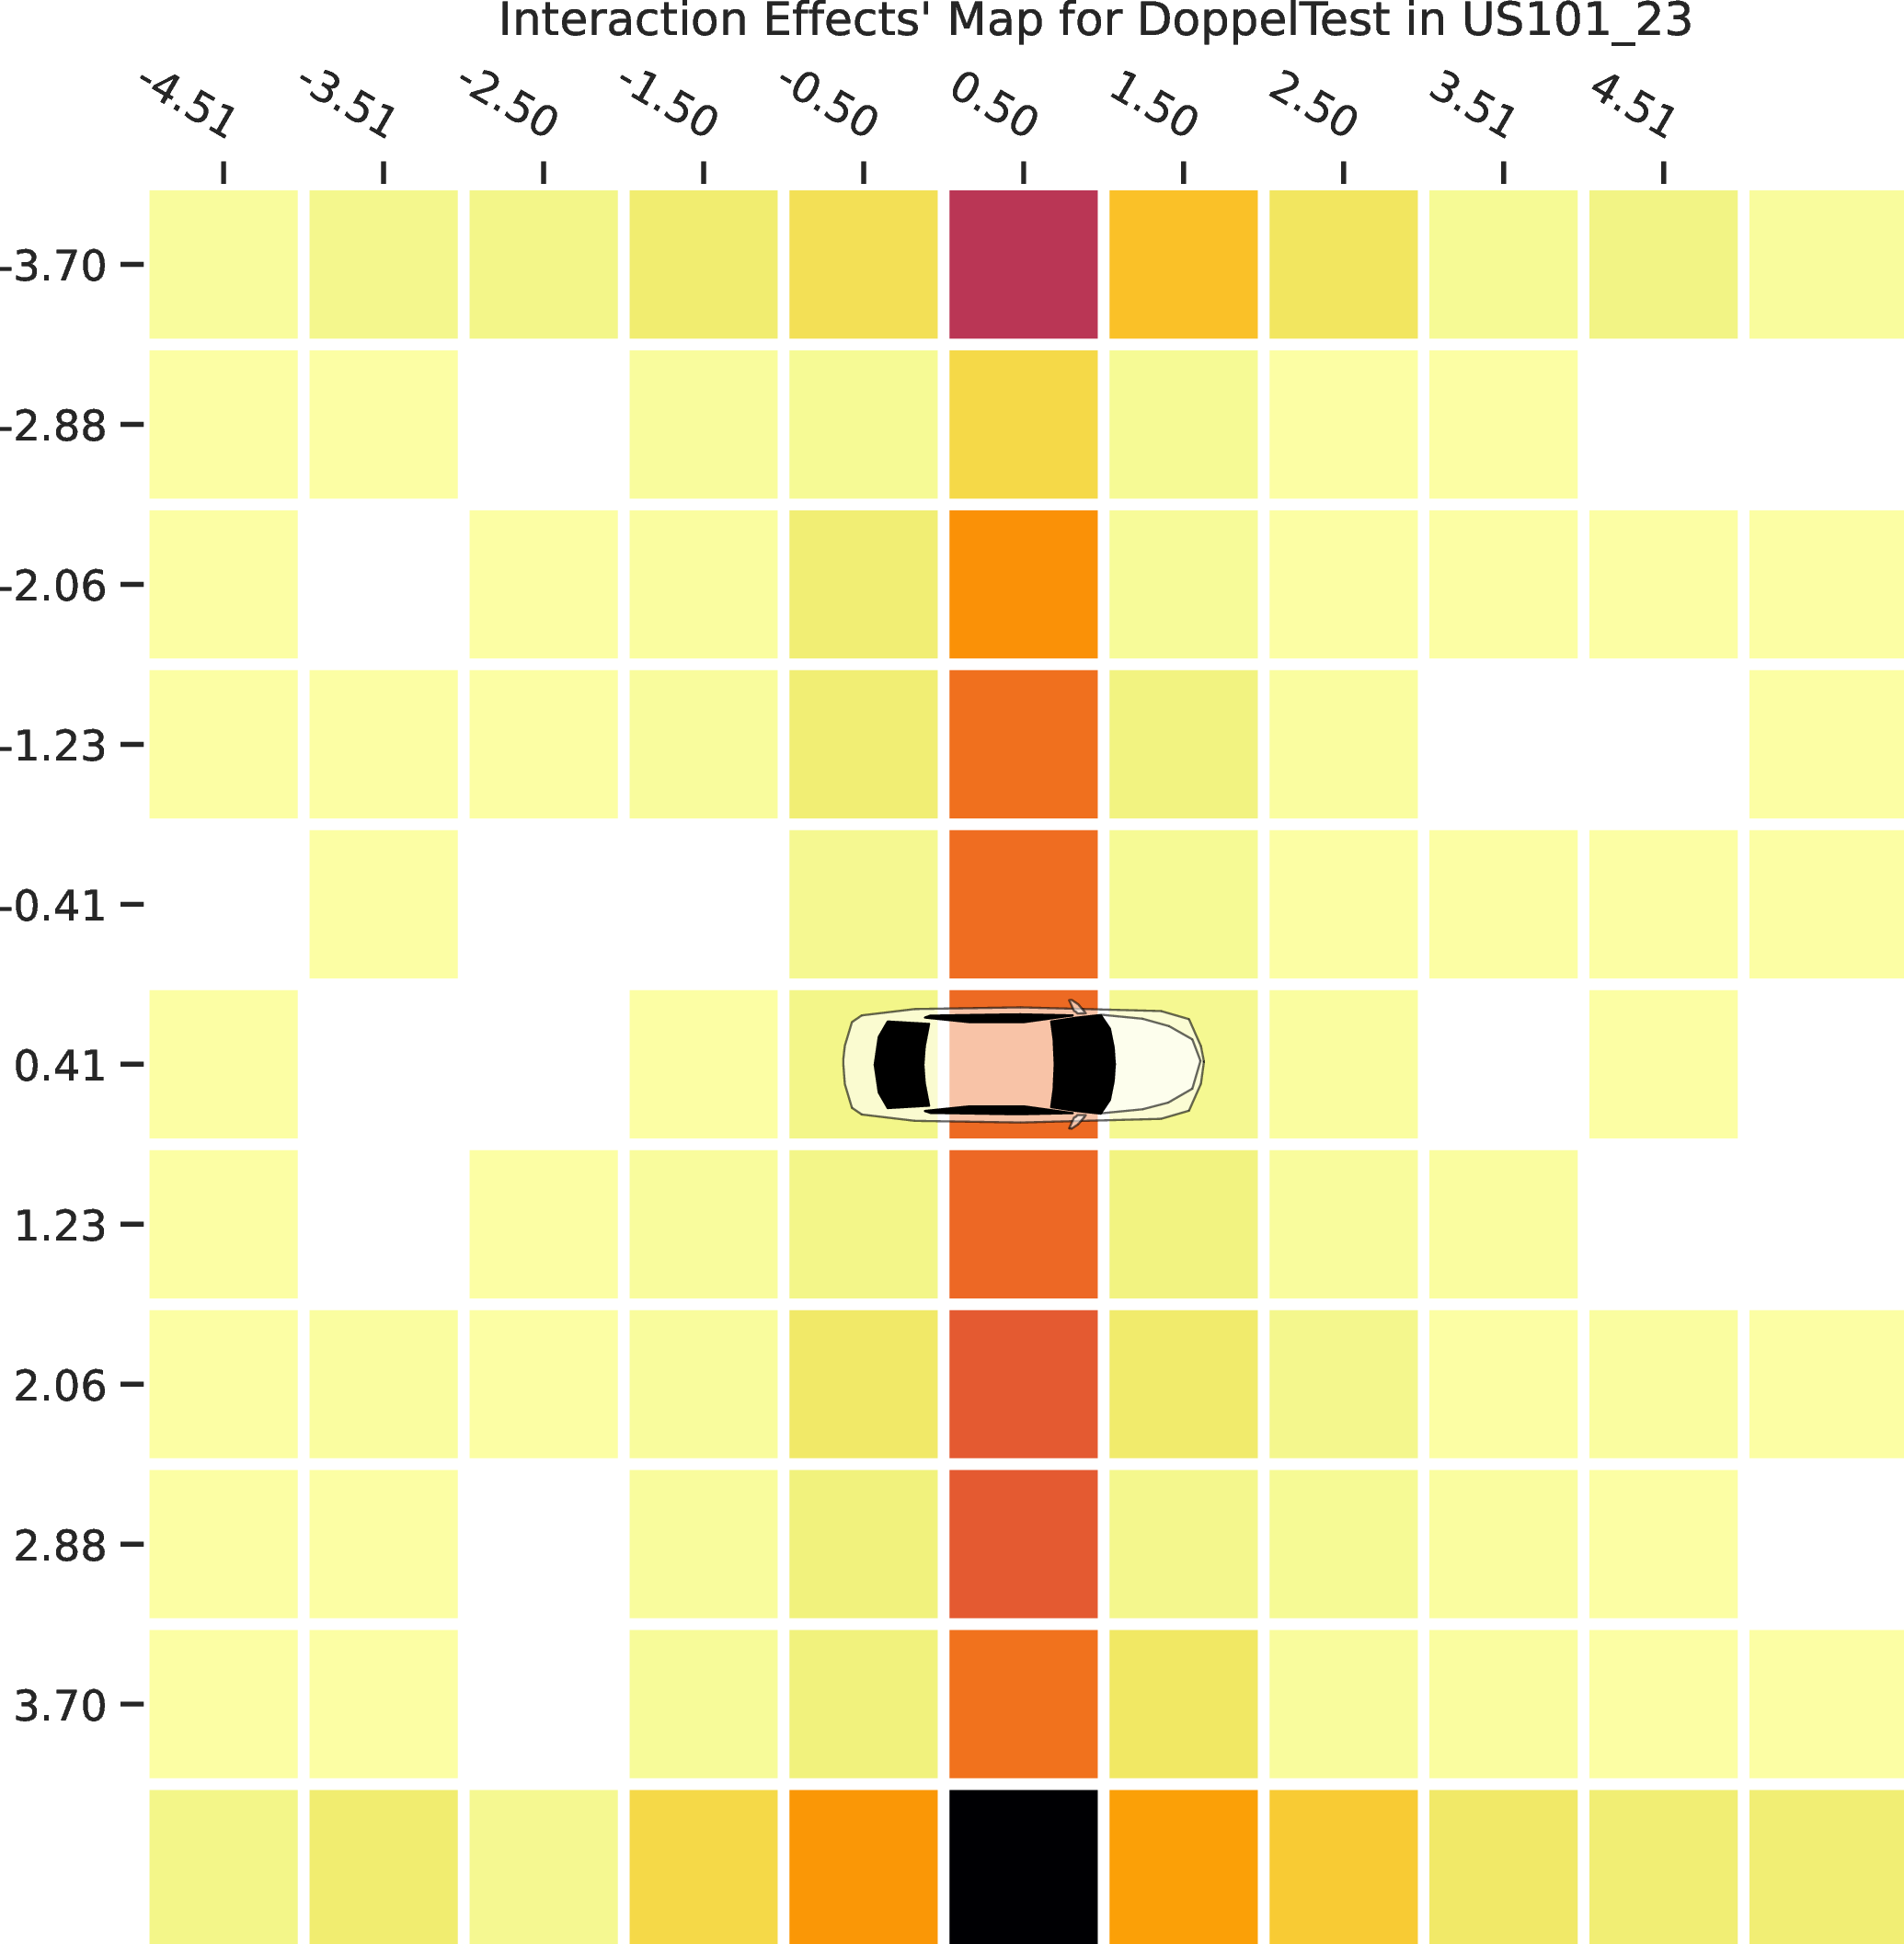
Figure 8: RQ1 – Interactions maps with FrenetiX experimental setting. a — Cho, b — Cologne, c — US101_09, d — US101_15, e — US101_23, f — Cho, g —
Cologne, h — US101_09, i — US101_15, j — US101_23
Figure 7 clearly indicates that EVITA always generates more interactions. The statistical analysis confirms the superiority of EVITA on Doppel``Test, as EVITA is
always statistically significantly better than Doppel``Test in terms of Total``Ints, with a large effect size. The interaction maps reported in Figure 8 show that EVITA
covered more types of interactions than Doppel``Test, as EVITA’s interaction maps contain fewer empty (white) cells. This observation not only strengthens our conclusion that EVITA generates more unique interactions
than Doppel``Test but also that EVITA covers many, sometimes all, possible types of interactions when applied to suburban and highway road networks.
Figure 9 (a) and Figure 9 (b) report the distribution of Total``Ints and UniqueInts obtained with EVITA and
Doppel``Test across the urban road network used in the experimental setting with Baidu Apollo.
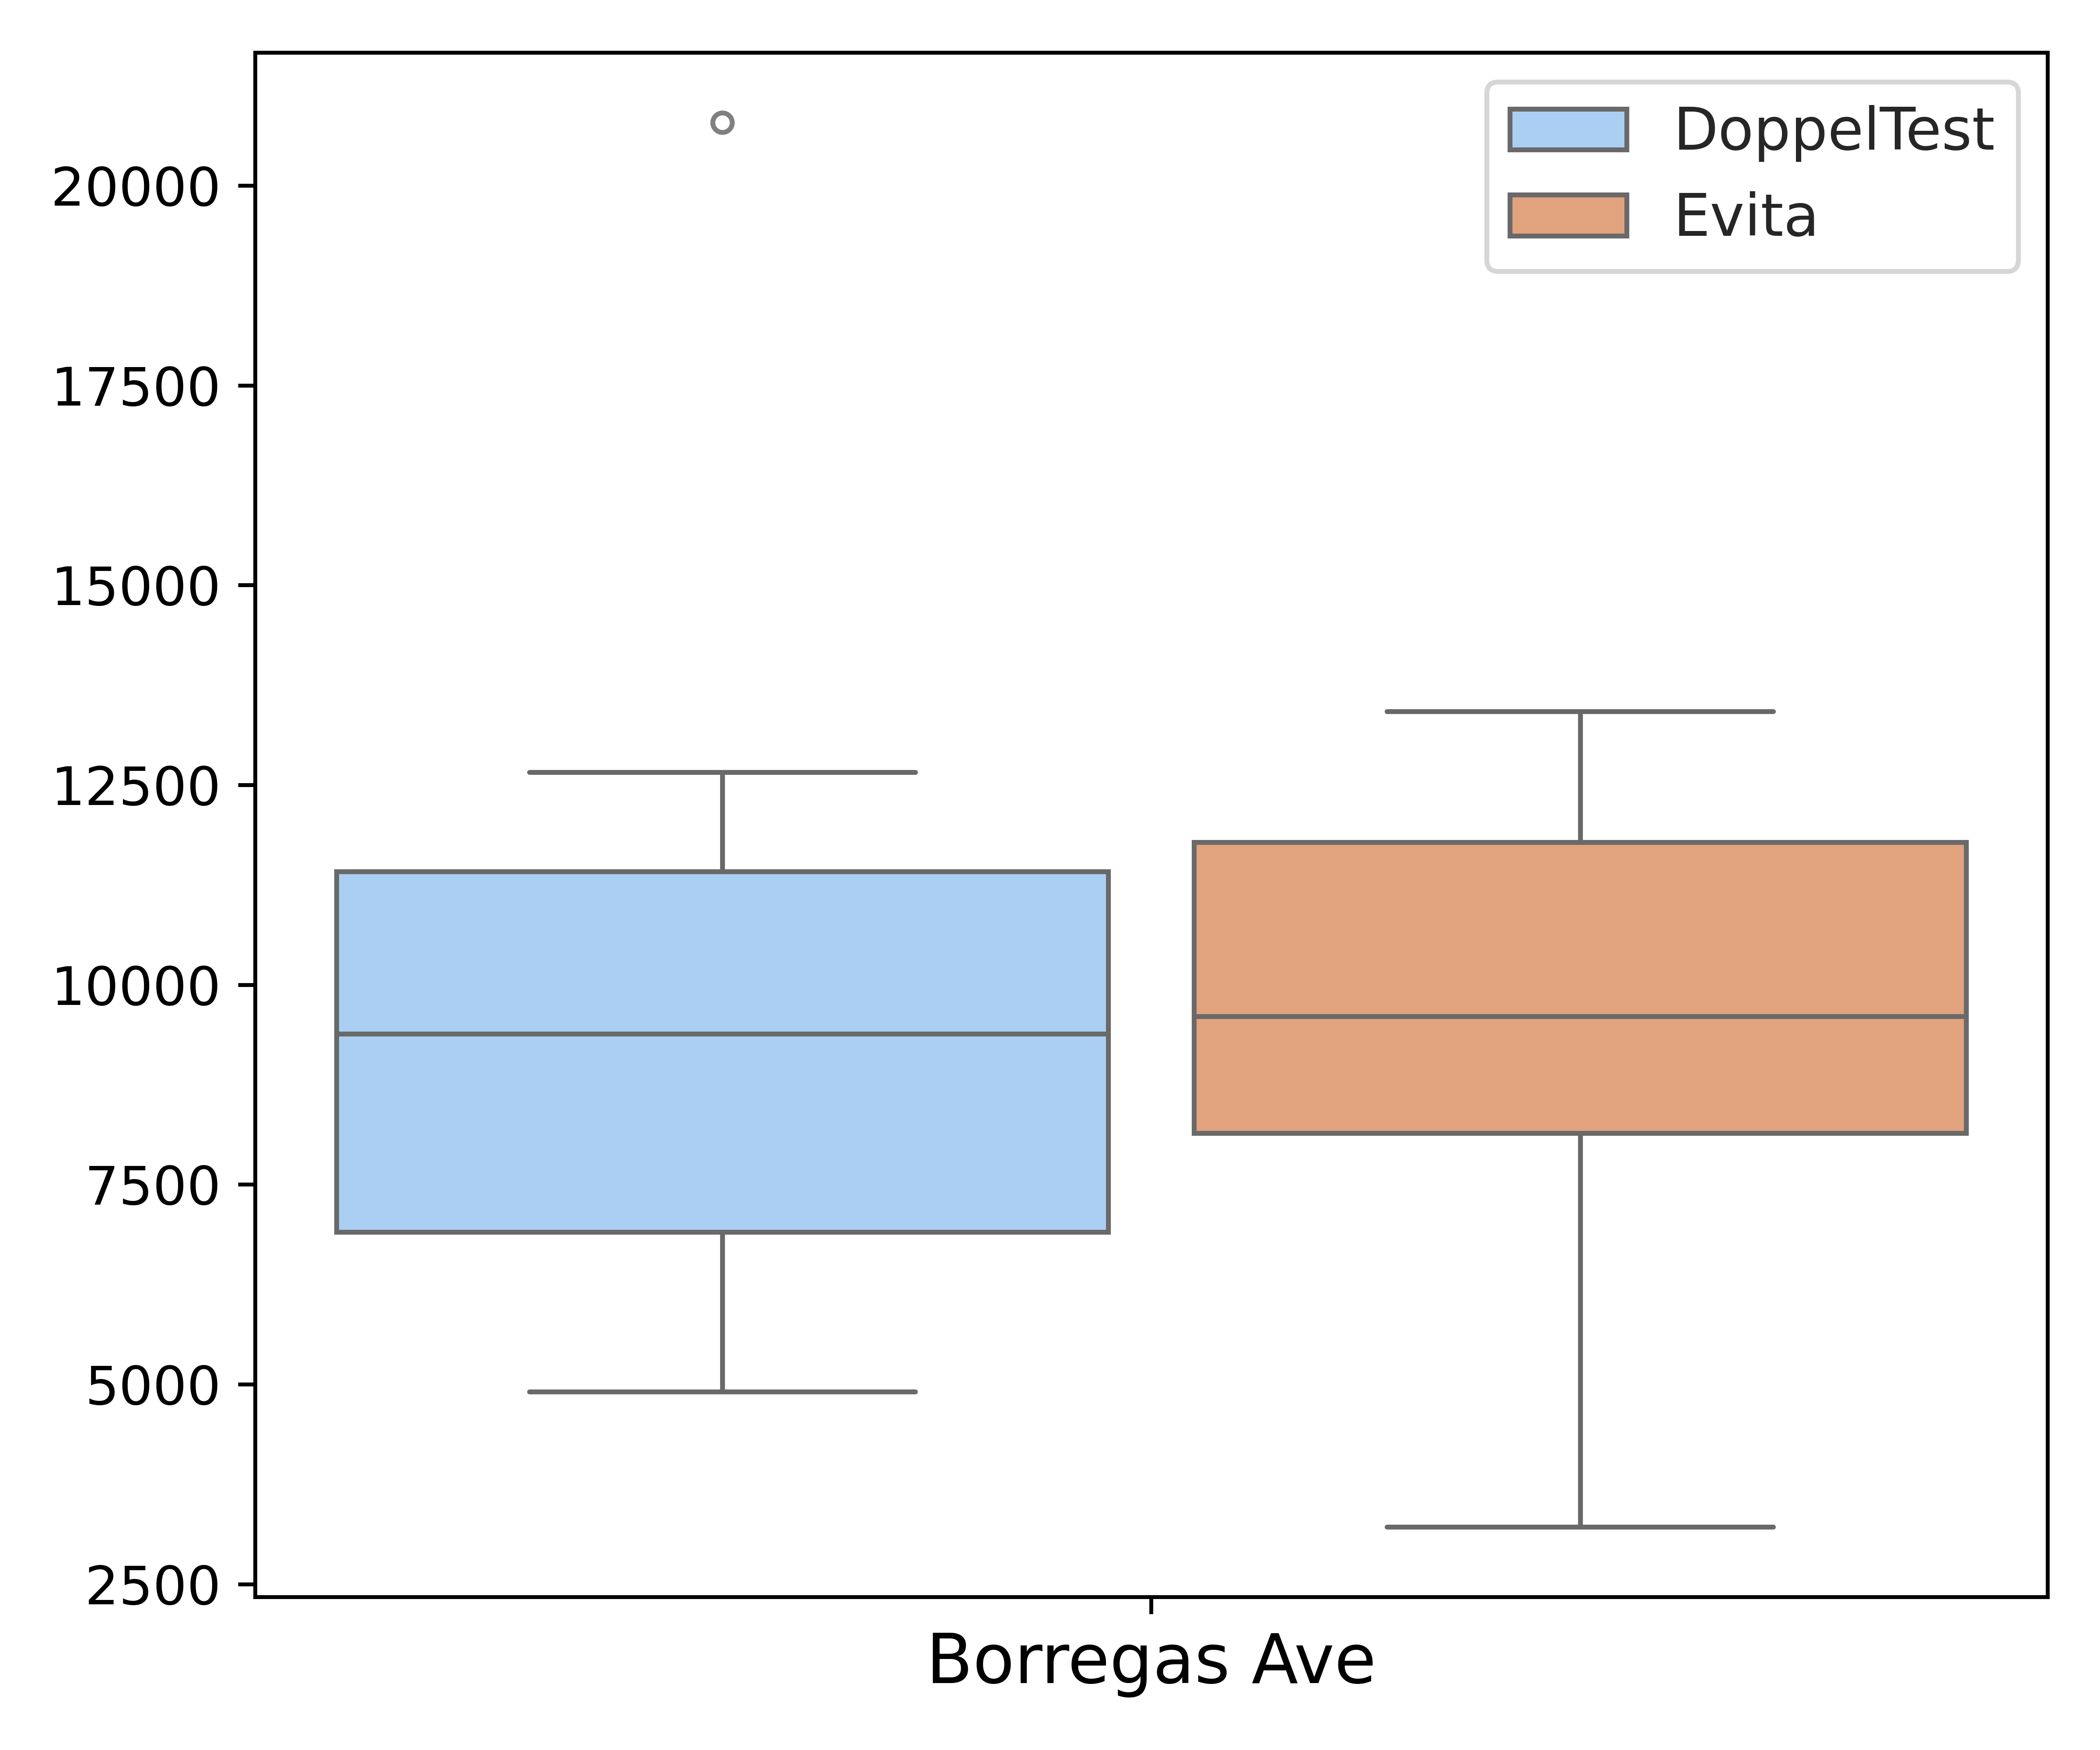
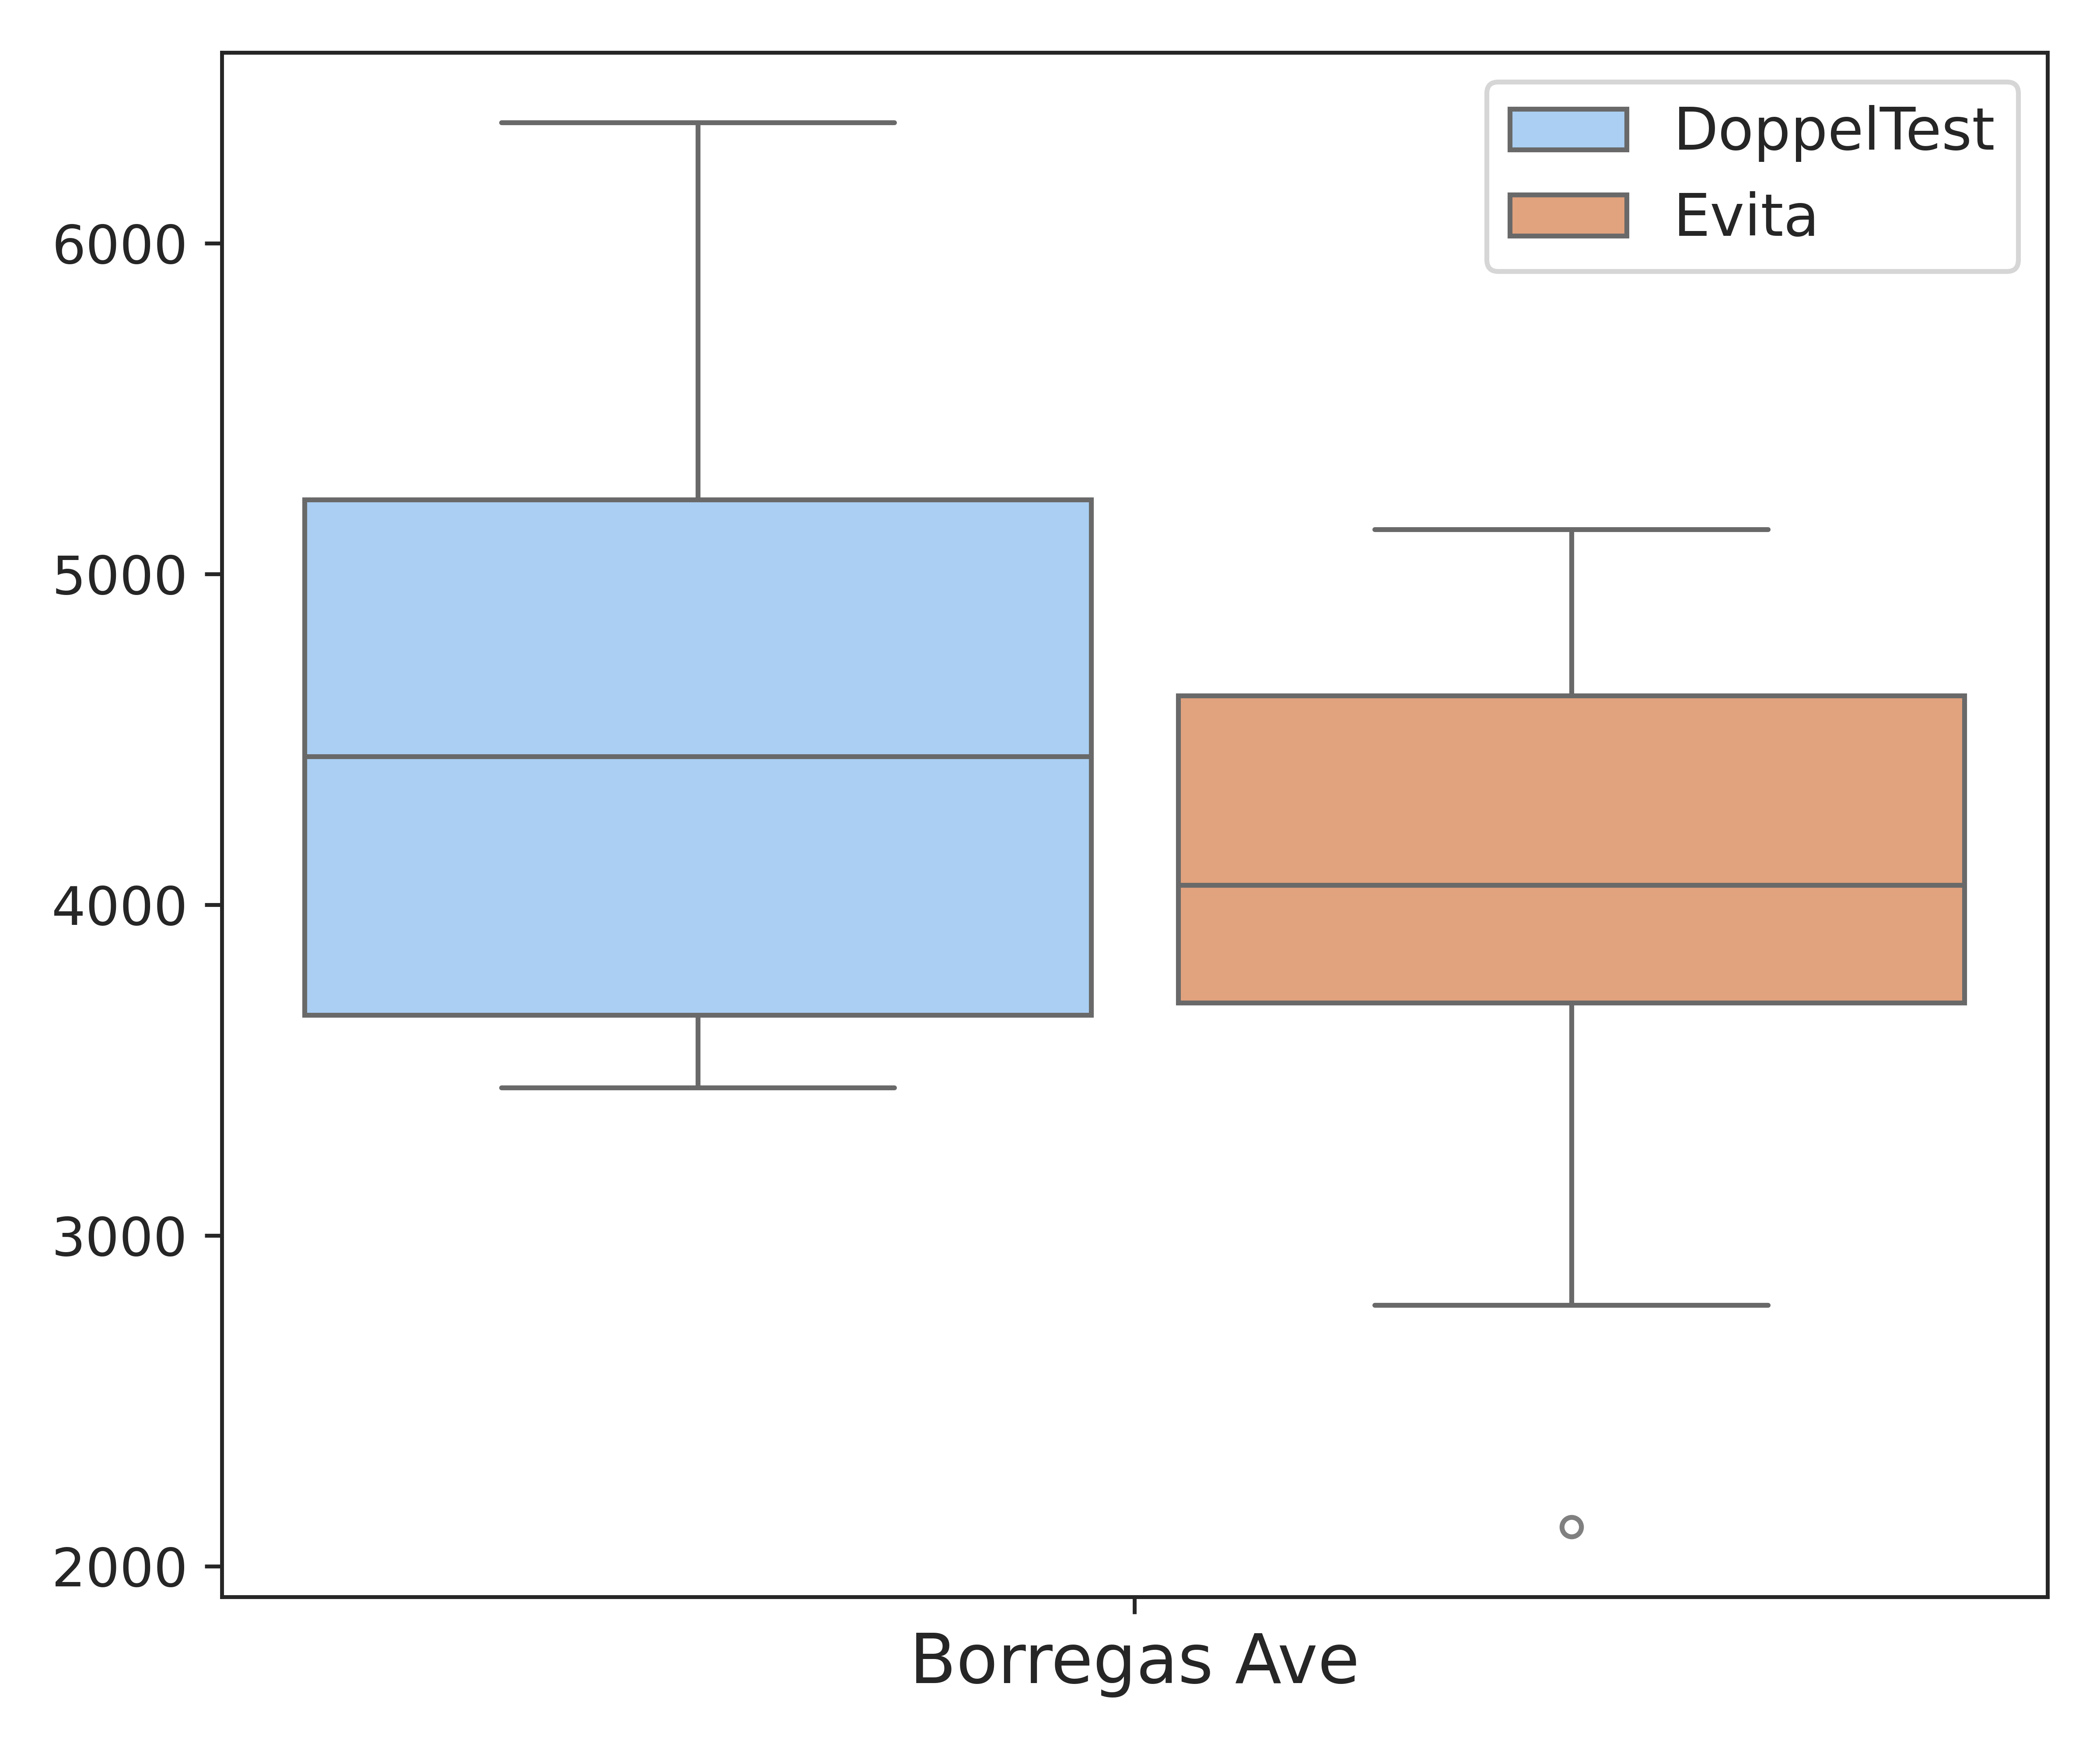
Figure 9: RQ1 – Interactions found by EVITA and Doppel``Test with Baidu Apollo experimental setting. a — Total number of interactions (Total``Ints), b — Unique number of interactions
(UniqueInts)
Figure 10 reports the interaction maps for the selected urban road network and the two approaches.
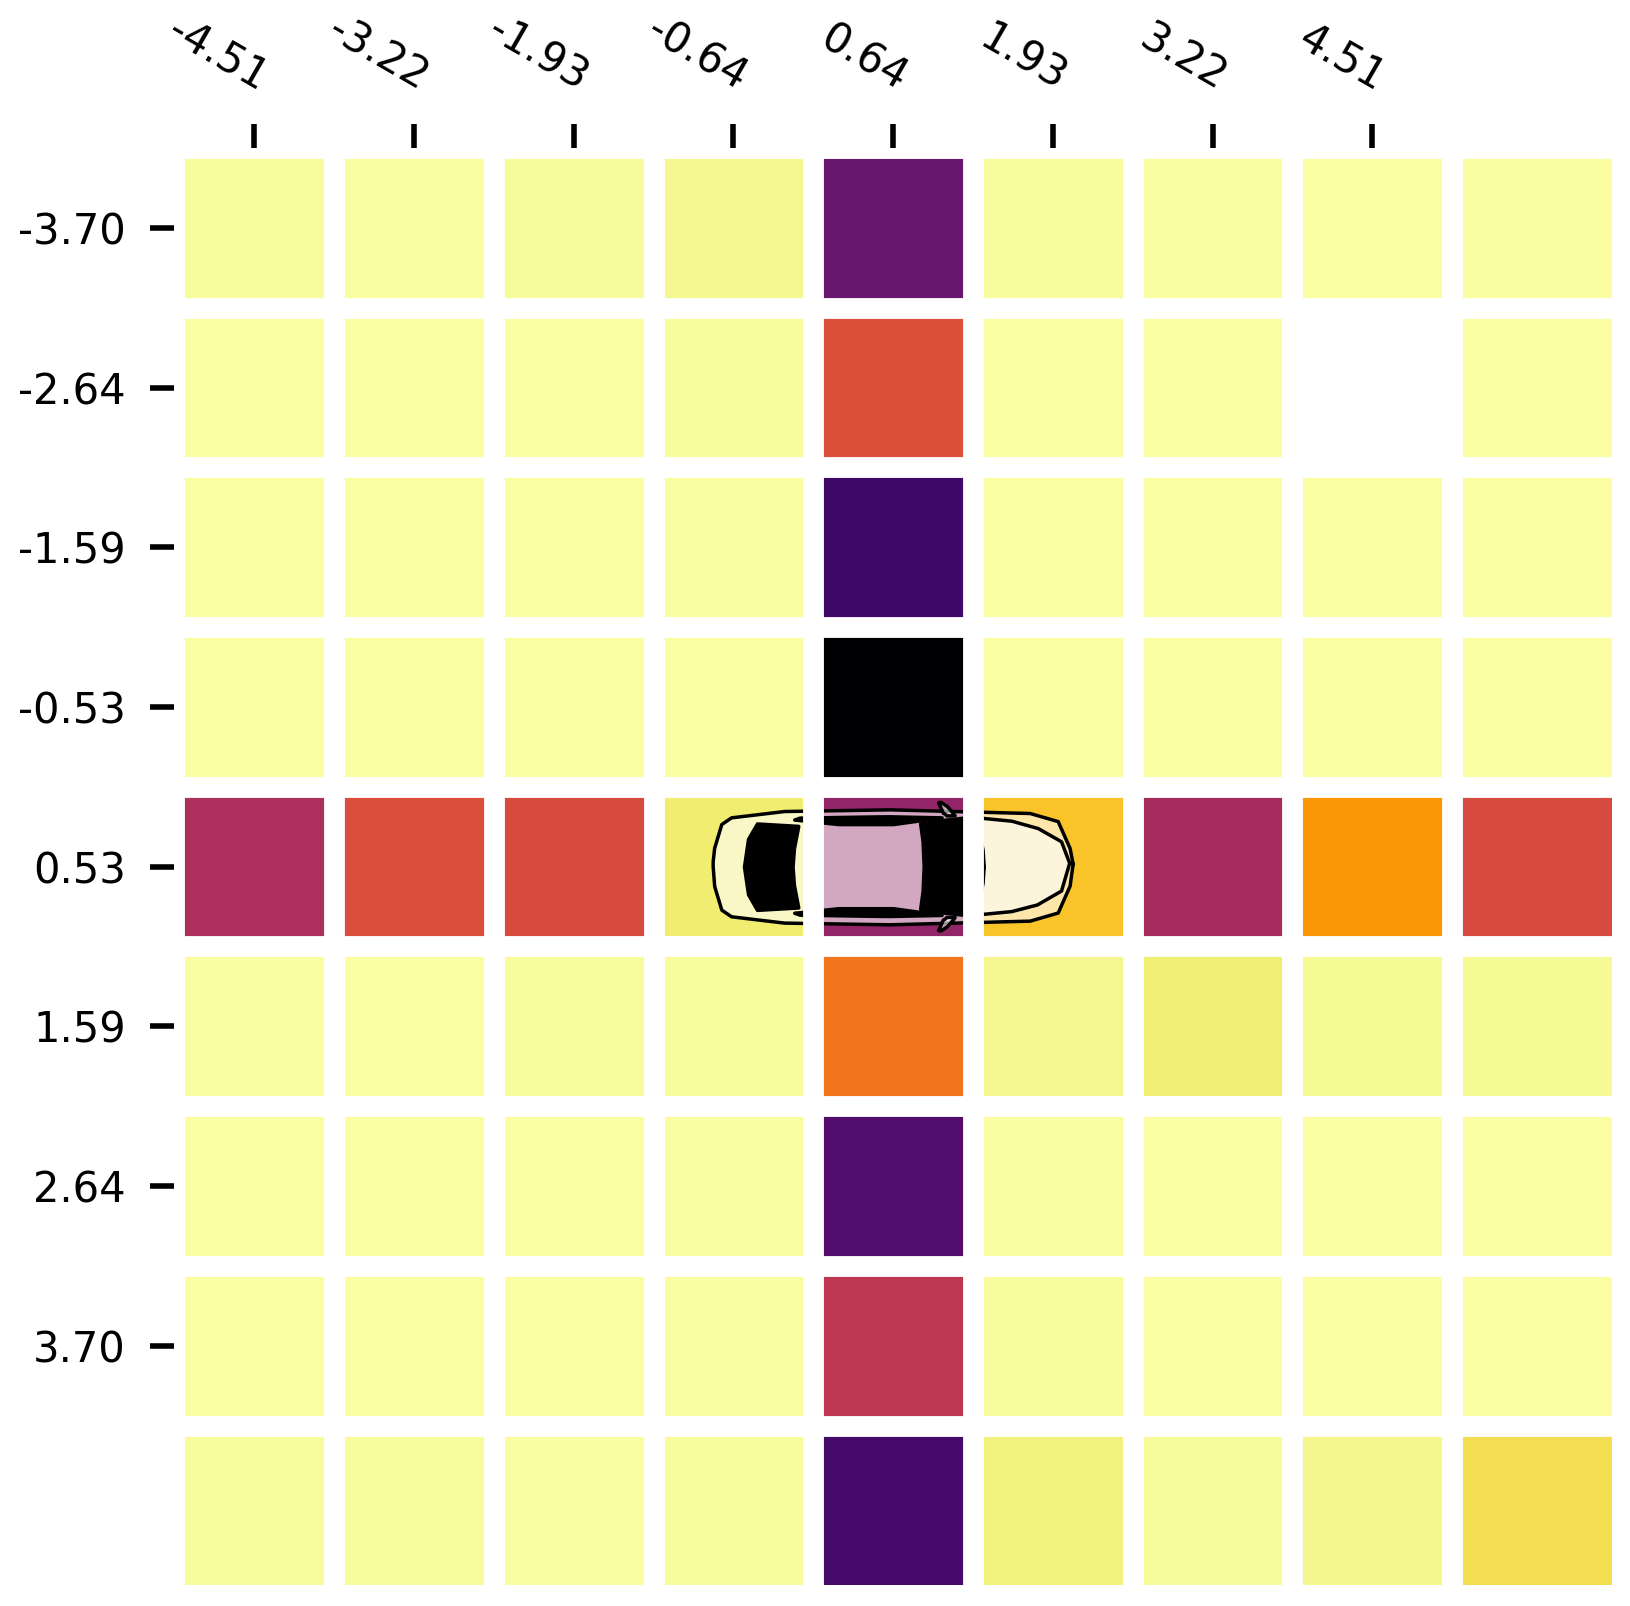
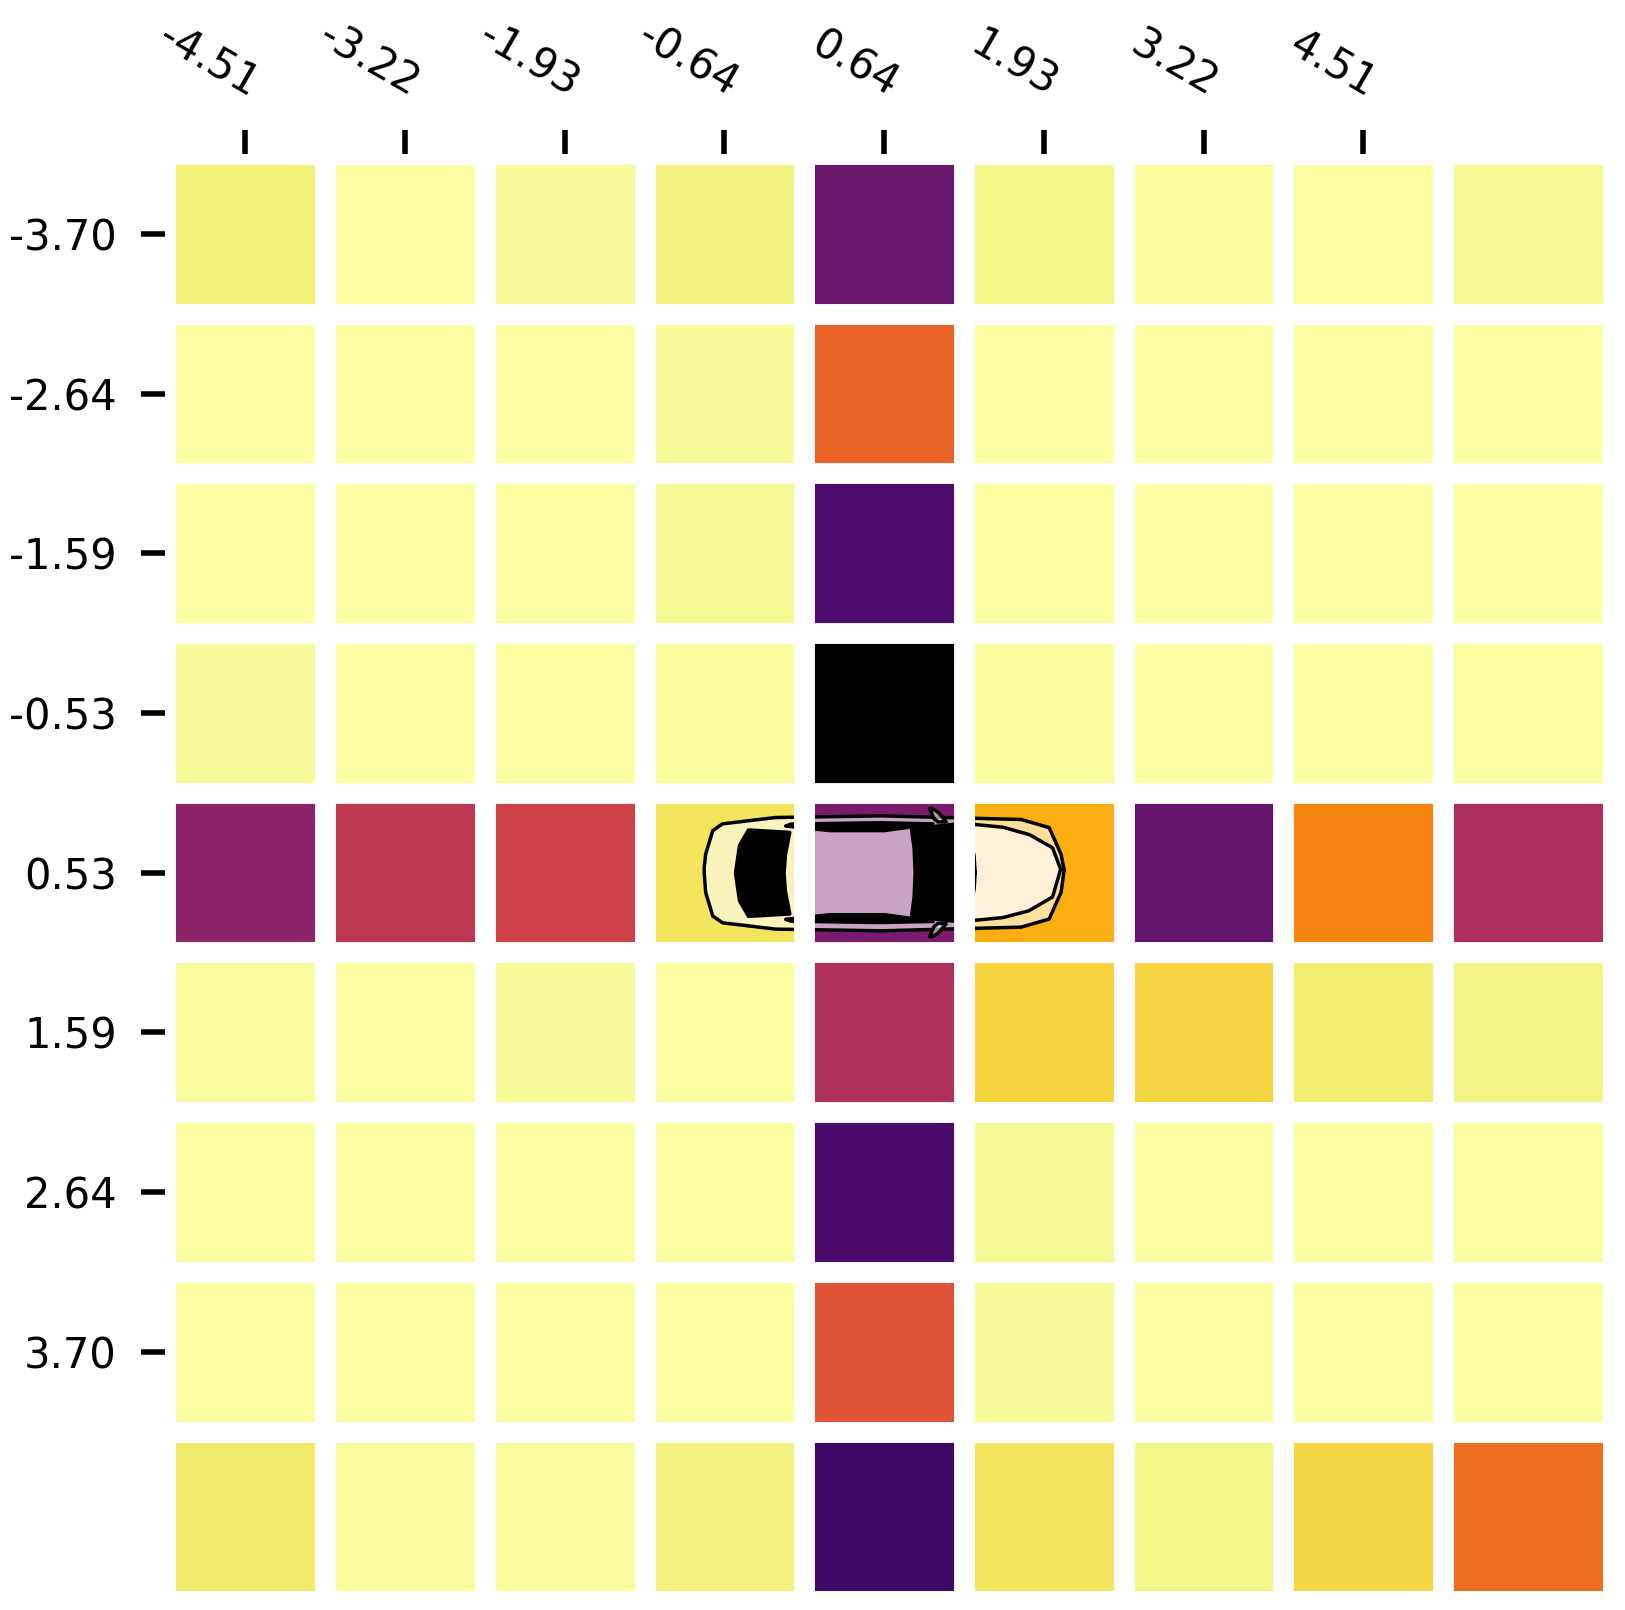
Figure 10: RQ1 – Interactions maps with Baidu Apollo experimental setting. a — EVITA, b — Doppel``Test
Figure 9 (a) indicates that EVITA and Doppel``Test trigger a similar amount of interactions (Total``Ints) and unique interactions (UniqueInts) on the
Borregas Ave map, as confirmed by the statistical analysis. The distribution of UniqueInts represented in Figure 9 (b) and the interaction maps in Figure 10 indicate a small statistical disadvantage of EVITA in the overall variety of the triggered interactions. We argue that this marginal superiority of Doppel``Test may be due to a
higher complexity of the generated scenarios that heavily rely on a larger number of vehicles. While Doppel``Test can cover few additional unique interaction types, EVITA remains highly competitive maintaining a lower scenario
complexity. We will further discuss the relationship between framework efficiency and scenario complexity in RQ4 (Section 6.4).
Answer to RQ1. EVITA finds more and more diverse interactions than Doppel``Test. While Doppel``Test shows a small statistical advantage in variety under specific urban settings, it requires
scenarios with a significantly higher complexity, whereas EVITA consistently covers a broad, and sometimes full, spectrum of interaction types across a wide array of road networks with simpler scenarios.
Remark 1. The interaction maps in Figure 8 highlight some interesting patterns: Most interactions across all scenarios cluster around the central vertical line of the interaction maps, meaning that most interactions caused changes in AVs’ direction (for instance, lane switching) but not speed. We argue that this behavior relates to how FrenetiX plans the trajectories to improve safety (by changing lanes to avoid obstacles) while minimizing passenger discomfort (by avoiding drastic speed changes).
6.2 RQ2 – Does EVITA generate scenarios with multiple and different types of collisions?↩︎
RQ2 evaluates the ability to generate critical scenarios and compares EVITA to Doppel``Test in terms of both the number and types of triggered collisions.
Figure 11 (a) reports the total number of EVITA and Doppel``Test scenarios that lead to collisions for the different road networks and in total (rightmost plot) in the FrenetiX
experimental setting. Figure 11 (b) reports the number of unique collisions UniqueColls.
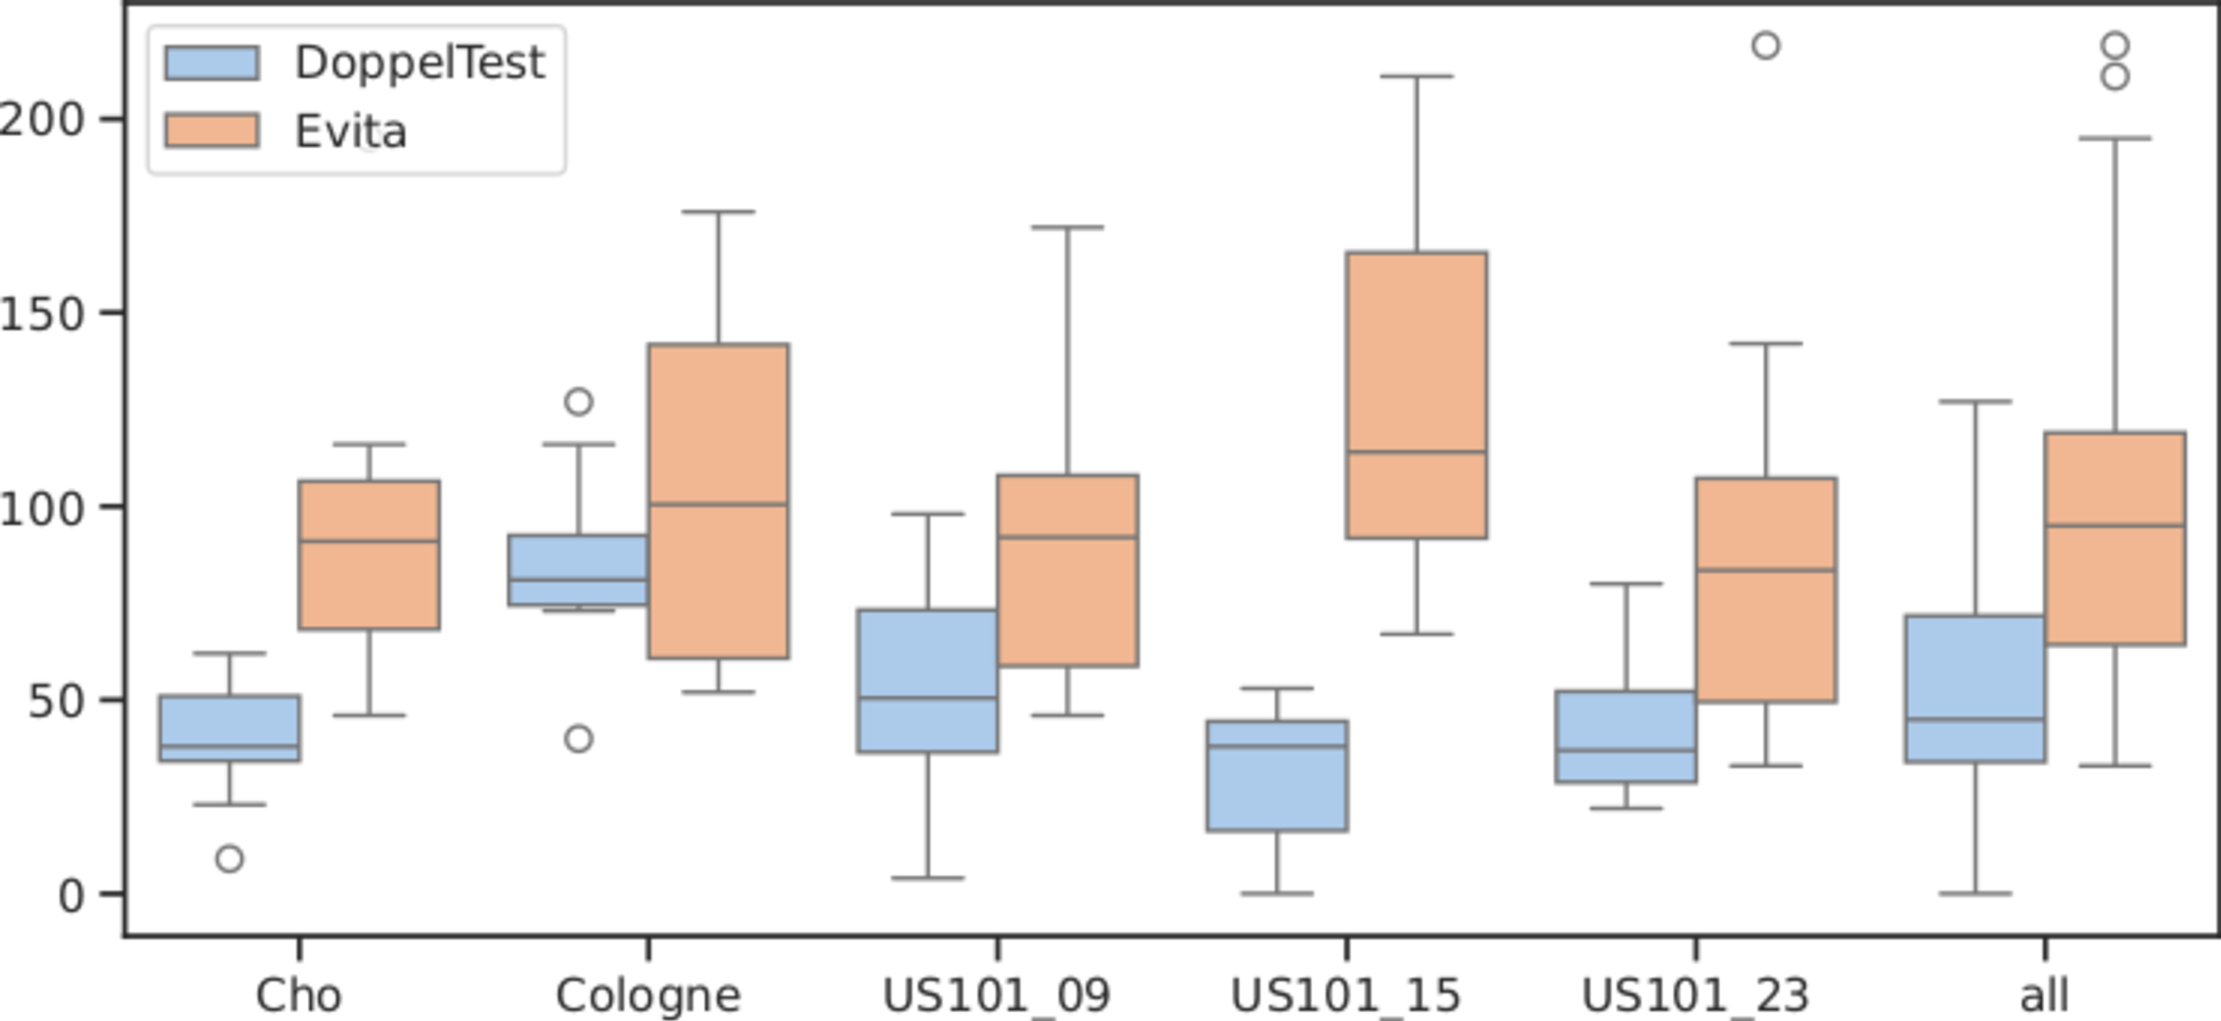
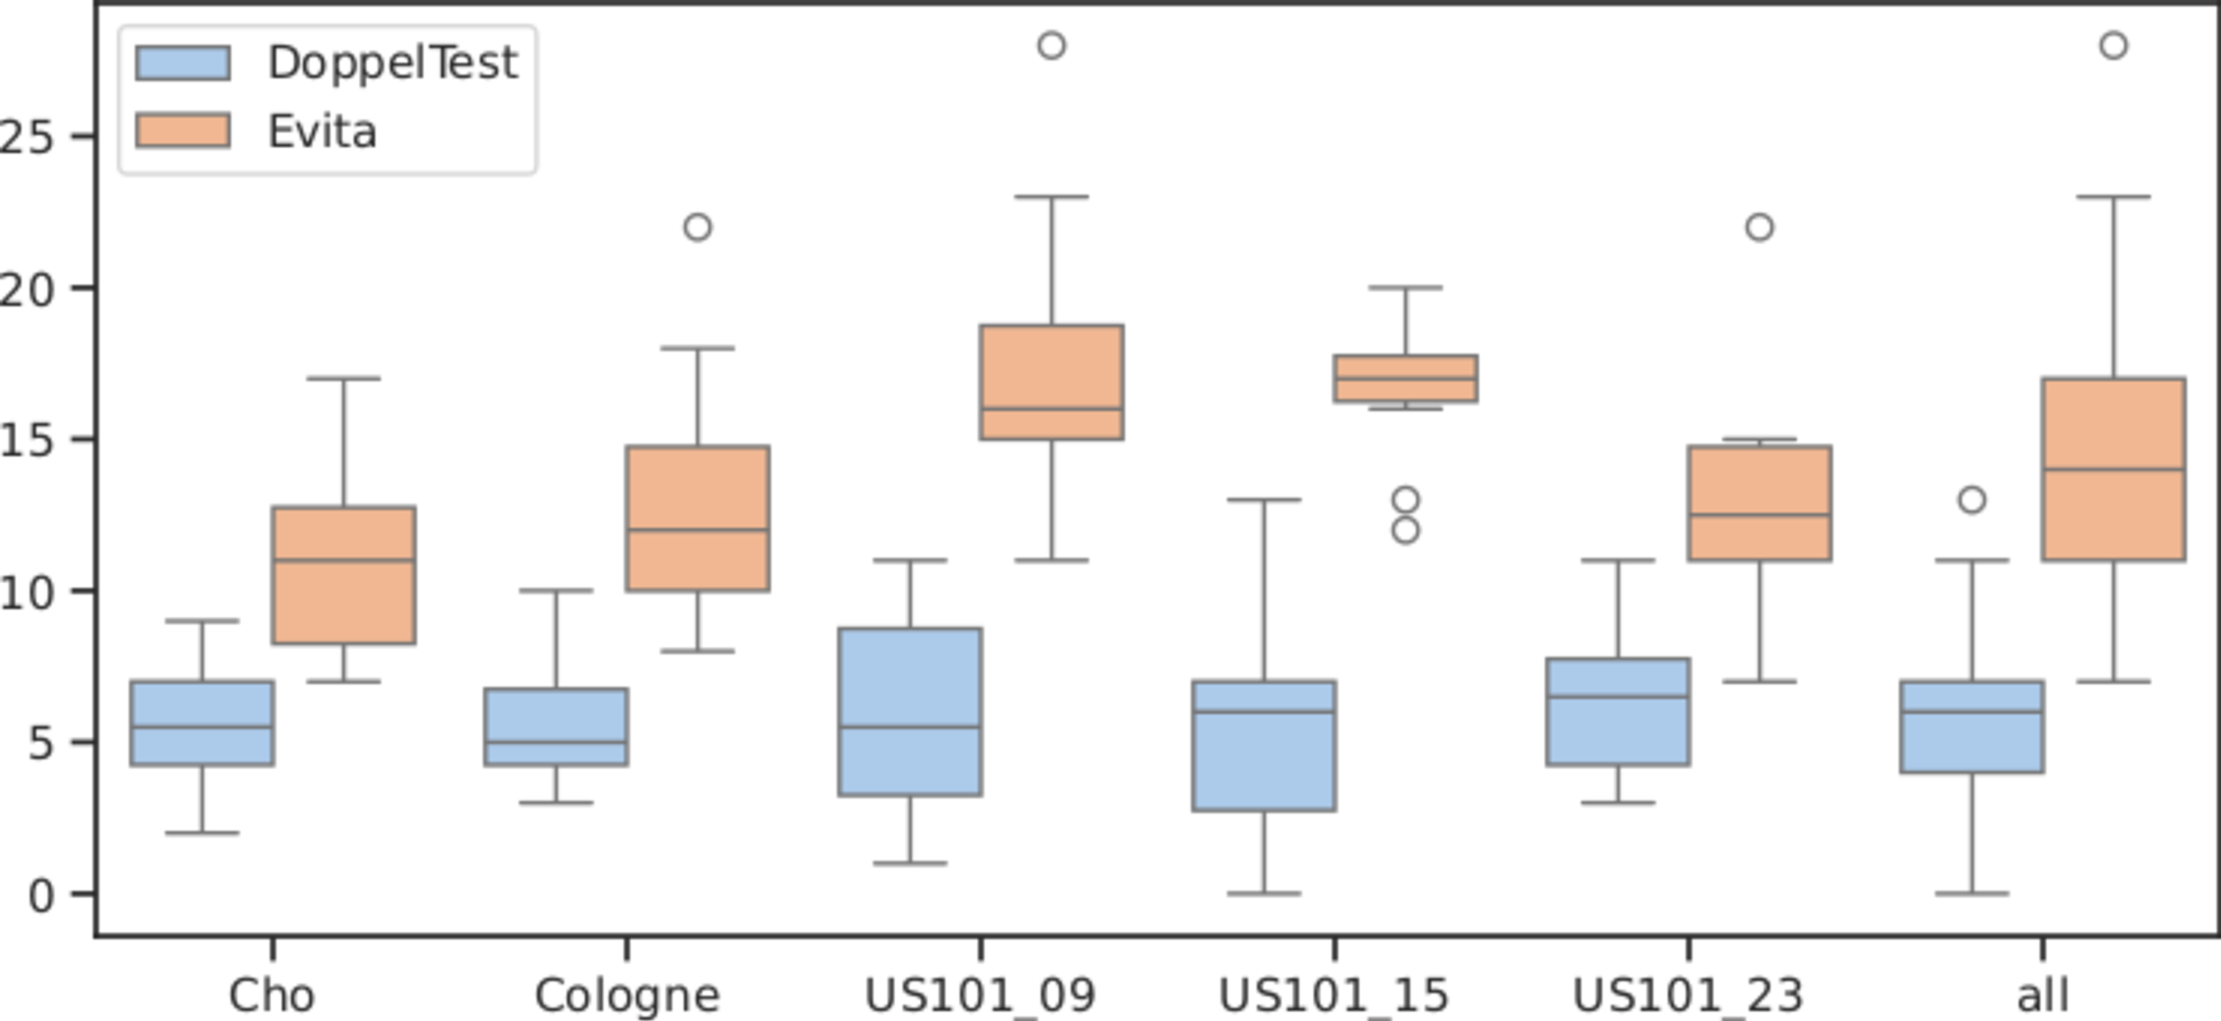
Figure 11: RQ2 – Collisions found by EVITA and Doppel``Test with FrenetiX experimental setting. a — Total number of collisions (TotalColls), b — Unique number of collisions
(UniqueColls)
Figure 11 (b) shows that EVITA is always statistically significantly better than Doppel``Test in terms of UniqueColls, with a large effect size. Figure 11 (a) shows the statistical advantage of EVITA over Doppel``Test in terms of TotalColls for all road network but Cologne, for which there is no statistically
significant difference.
In the Baidu Apollo experimental setting EVITA generates 53 collisions and 14 unique collisions, while Doppel``Test generates 30 collisions and 4 unique collisions, with a similar number of generated interactions. The data
confirm the superiority of the EVITA in generating relevant scenarios also in urban road networks.
As discussed in Section 5.2, UniqueColls classify the collisions in terms of point of impact (POI), relative velocity of the impact (RIV), and relative angle of the
impact (RIA).
6.2.0.1 Point of impact
EVITA covers all the types of POI, and finds more collisions than Doppel``Test for most of the types, in both highway and suburban road networks. Both EVITA and Doppel``Test generate many
front collisions, few back collisions, and rarely middle collisions. Although middle collisions are quite rare for both EVITA and Doppel``Test, EVITA finds more middle collisions than Doppel``Test. In
urban scenarios, the majority of collisions generated by the two frameworks are middle collisions, followed by front collisions, while back collisions are quite rare.
6.2.0.2 Relative impact speed
Both EVITA and Doppel``Test collisions cluster around \(10\) km/h and \(20\) km/h, for both the experimental settings. EVITA almost always finds
more collisions than Doppel``Test in both the \(10\) km/h and \(20\) km/h clusters.
6.2.0.3 Relative impact angle
All collisions fall within the \(20\) Deg cluster in both FrenetiX and Baidu Apollo experimental settings and correspond to failed overtaking. We report exemplary cases in the replication package [24]. Despite collisions usually occurring on straight road segments, EVITA covers a wider range of relative impact angles than
Doppel``Test.
Answer to RQ2. EVITA finds both more and more diverse collisions than Doppel``Test.
Remark 2. The results of RQ1 and RQ2 confirm our intuition that the more diverse are the interactions, the more diverse are the collisions.
6.3 RQ3 – Does EVITA generate scenarios leading to traffic rule violations?↩︎
We address RQ3 with experiments on the Borregas Ave urban road layout of Baidu Apollo, since the selected maps of the highway and suburban road networks of FrenetiX do not include traffic lights and signs. We refer to Huai et al.’s [18] definition to identify traffic violations.
Figure 12 shows the total number of traffic light (Total``FailTrafficLights), stop signs (Total``FailStop), and speeding (Total``Speeding) violations detected in the
scenarios generated with EVITA and Doppel``Test in the urban traffic environment.
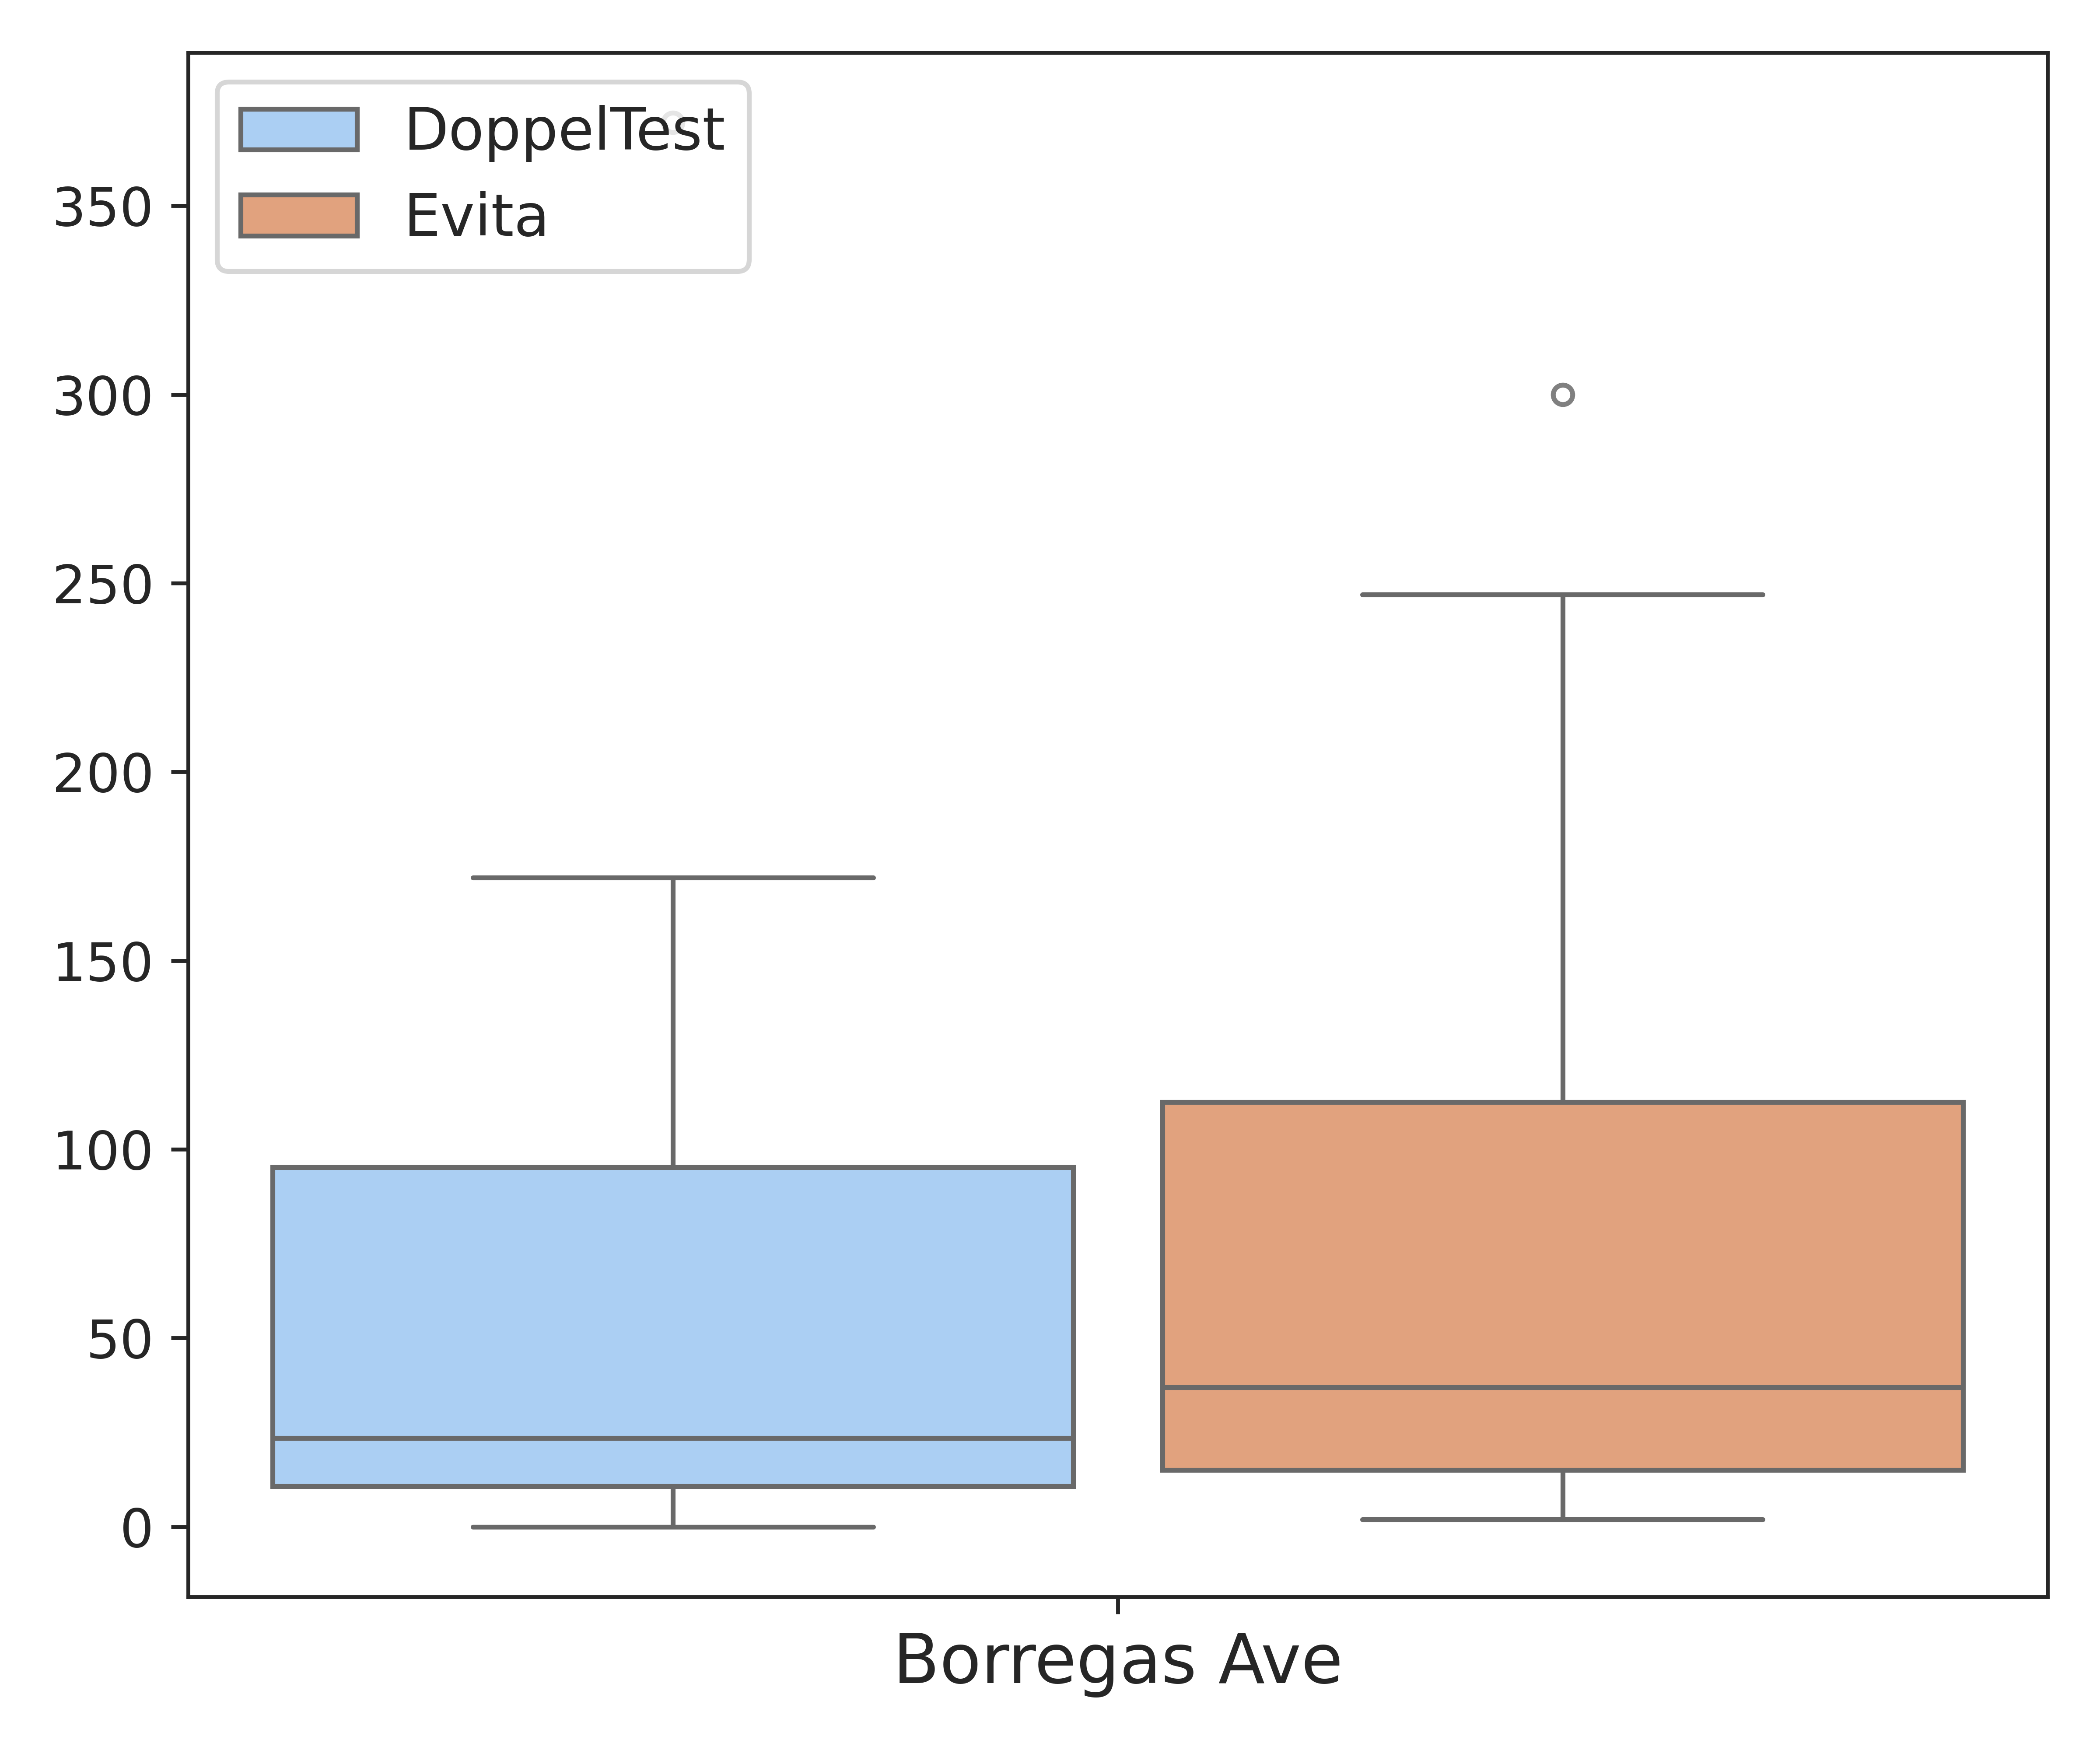
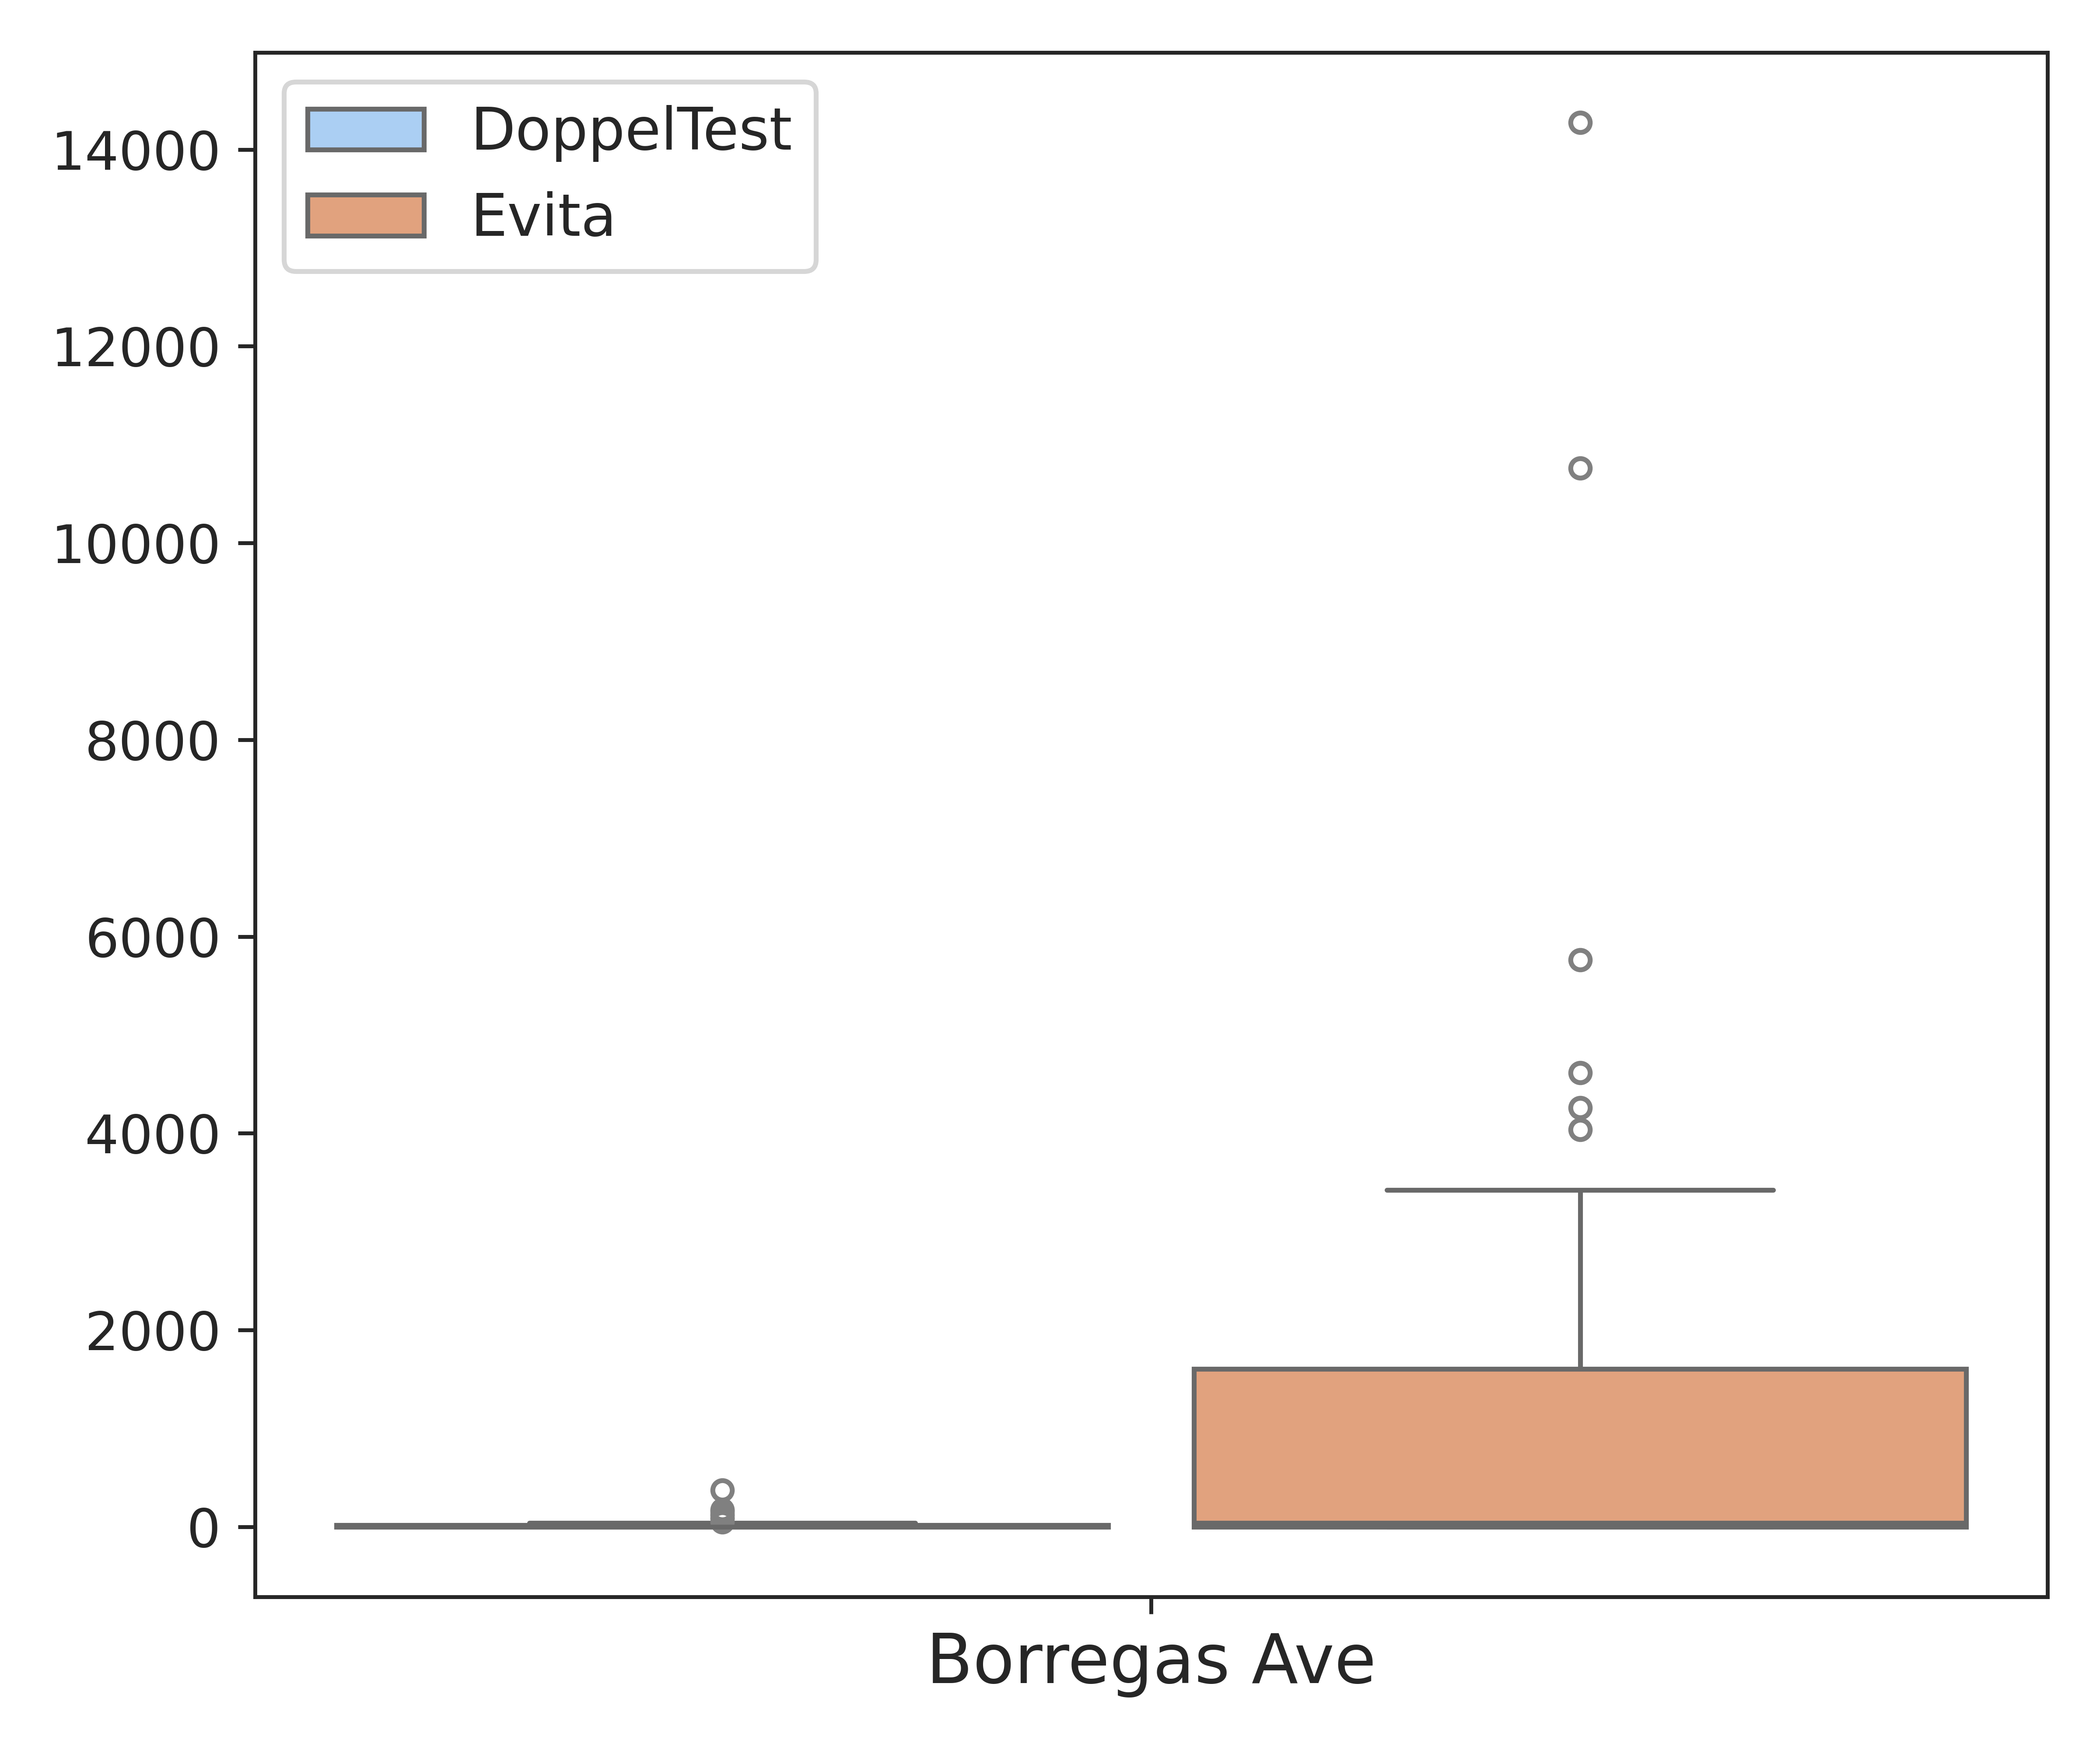
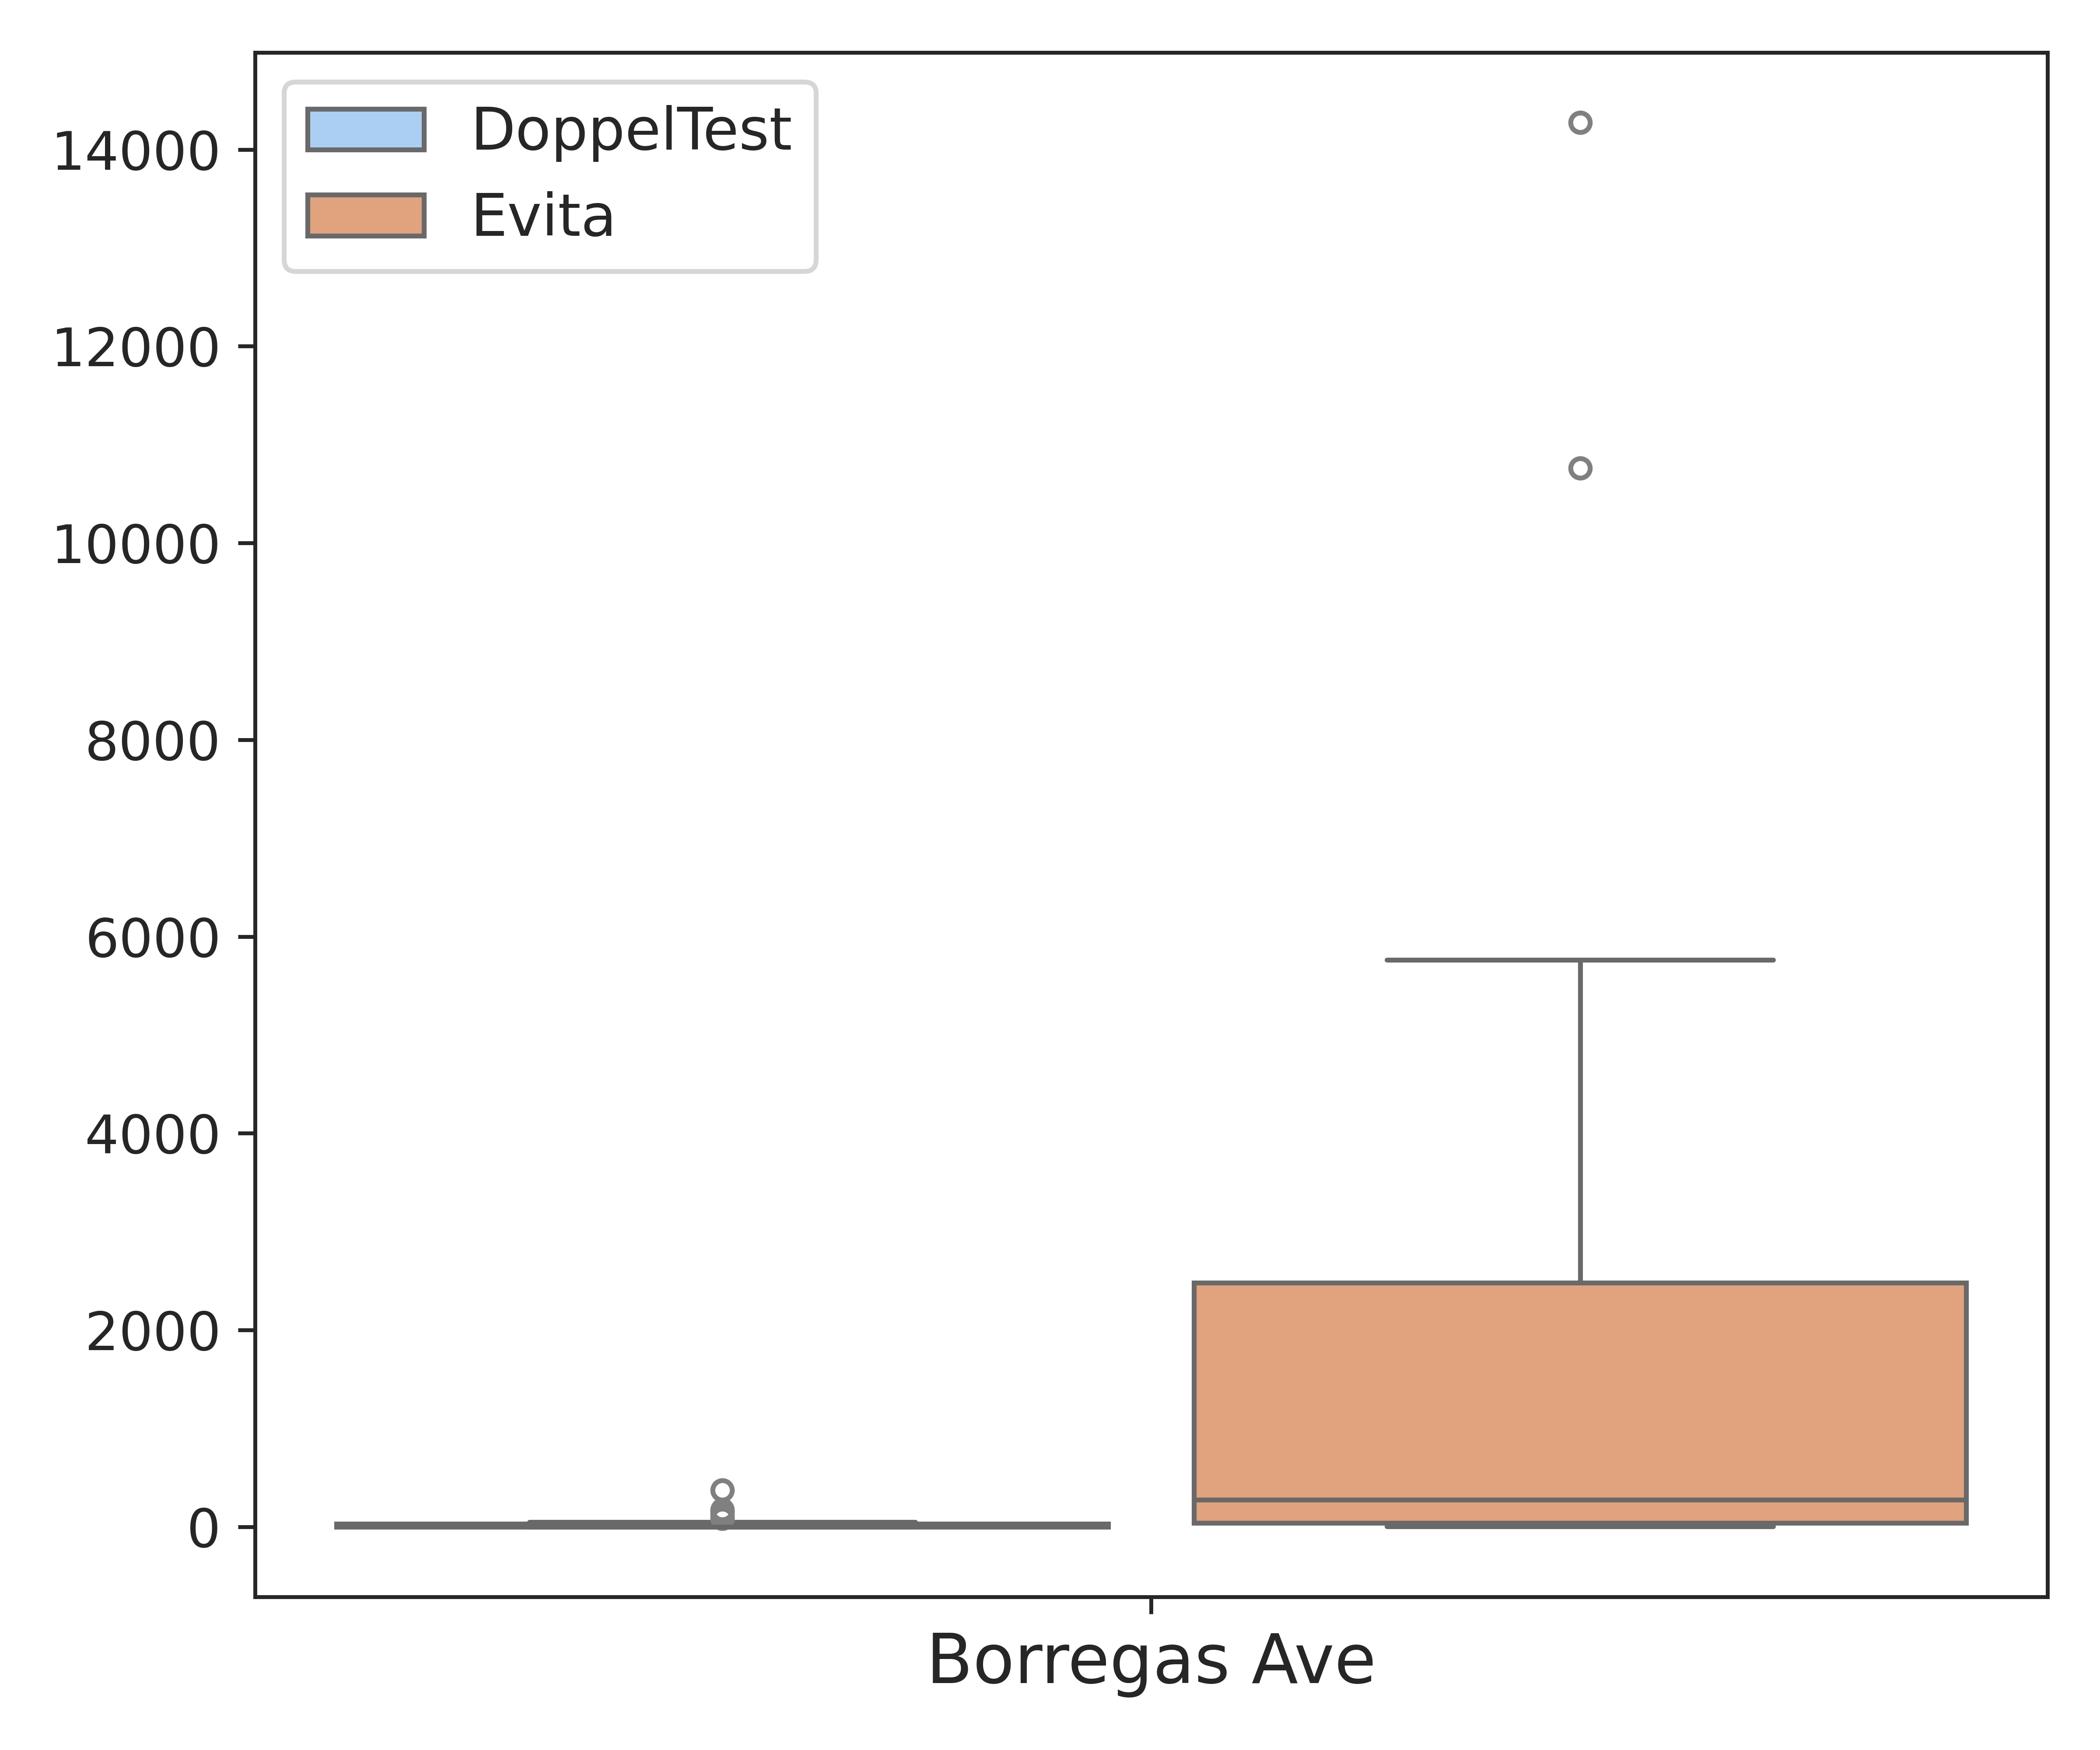
Figure 12: RQ3 – Number of detected violations with the Baidu Apollo experimental setting. a — Stop Signs Violations, b — Speeding Violations, c — Traffic Lights Violations
Figure 12 shows a small statistical advantage of EVITA over Doppel``Test for stop sign violations, and a statistically relevant advantage of EVITA over
Doppel``Test for both speeding and traffic light violations. EVITA’s advantage for both speeding and traffic light violations is particularly relevant given the poor performance of Doppel``Test.
Answer to RQ3. EVITA outperforms Doppel``Test across all the evaluated traffic violations, showing a good efficiency in exposing traffic rule infractions caused by AVs.
6.4 RQ4 – Does EVITA generate simple scenarios?↩︎
RQ4 evaluates the ability of the EVITA to generate scenarios that contain only the AVs required for triggering the interactions, thus improving testing, comprehension, and debugging.
Figure 13 reports the number of scenarios generated with EVITA and Doppel``Test by number \(K\) of involved vehicles, \(2 \leq K\leq
8\), for each road network used for the FrenetiX experimental setting. In the figure, the bars representing the number of scenarios for the two generators are overlaid.
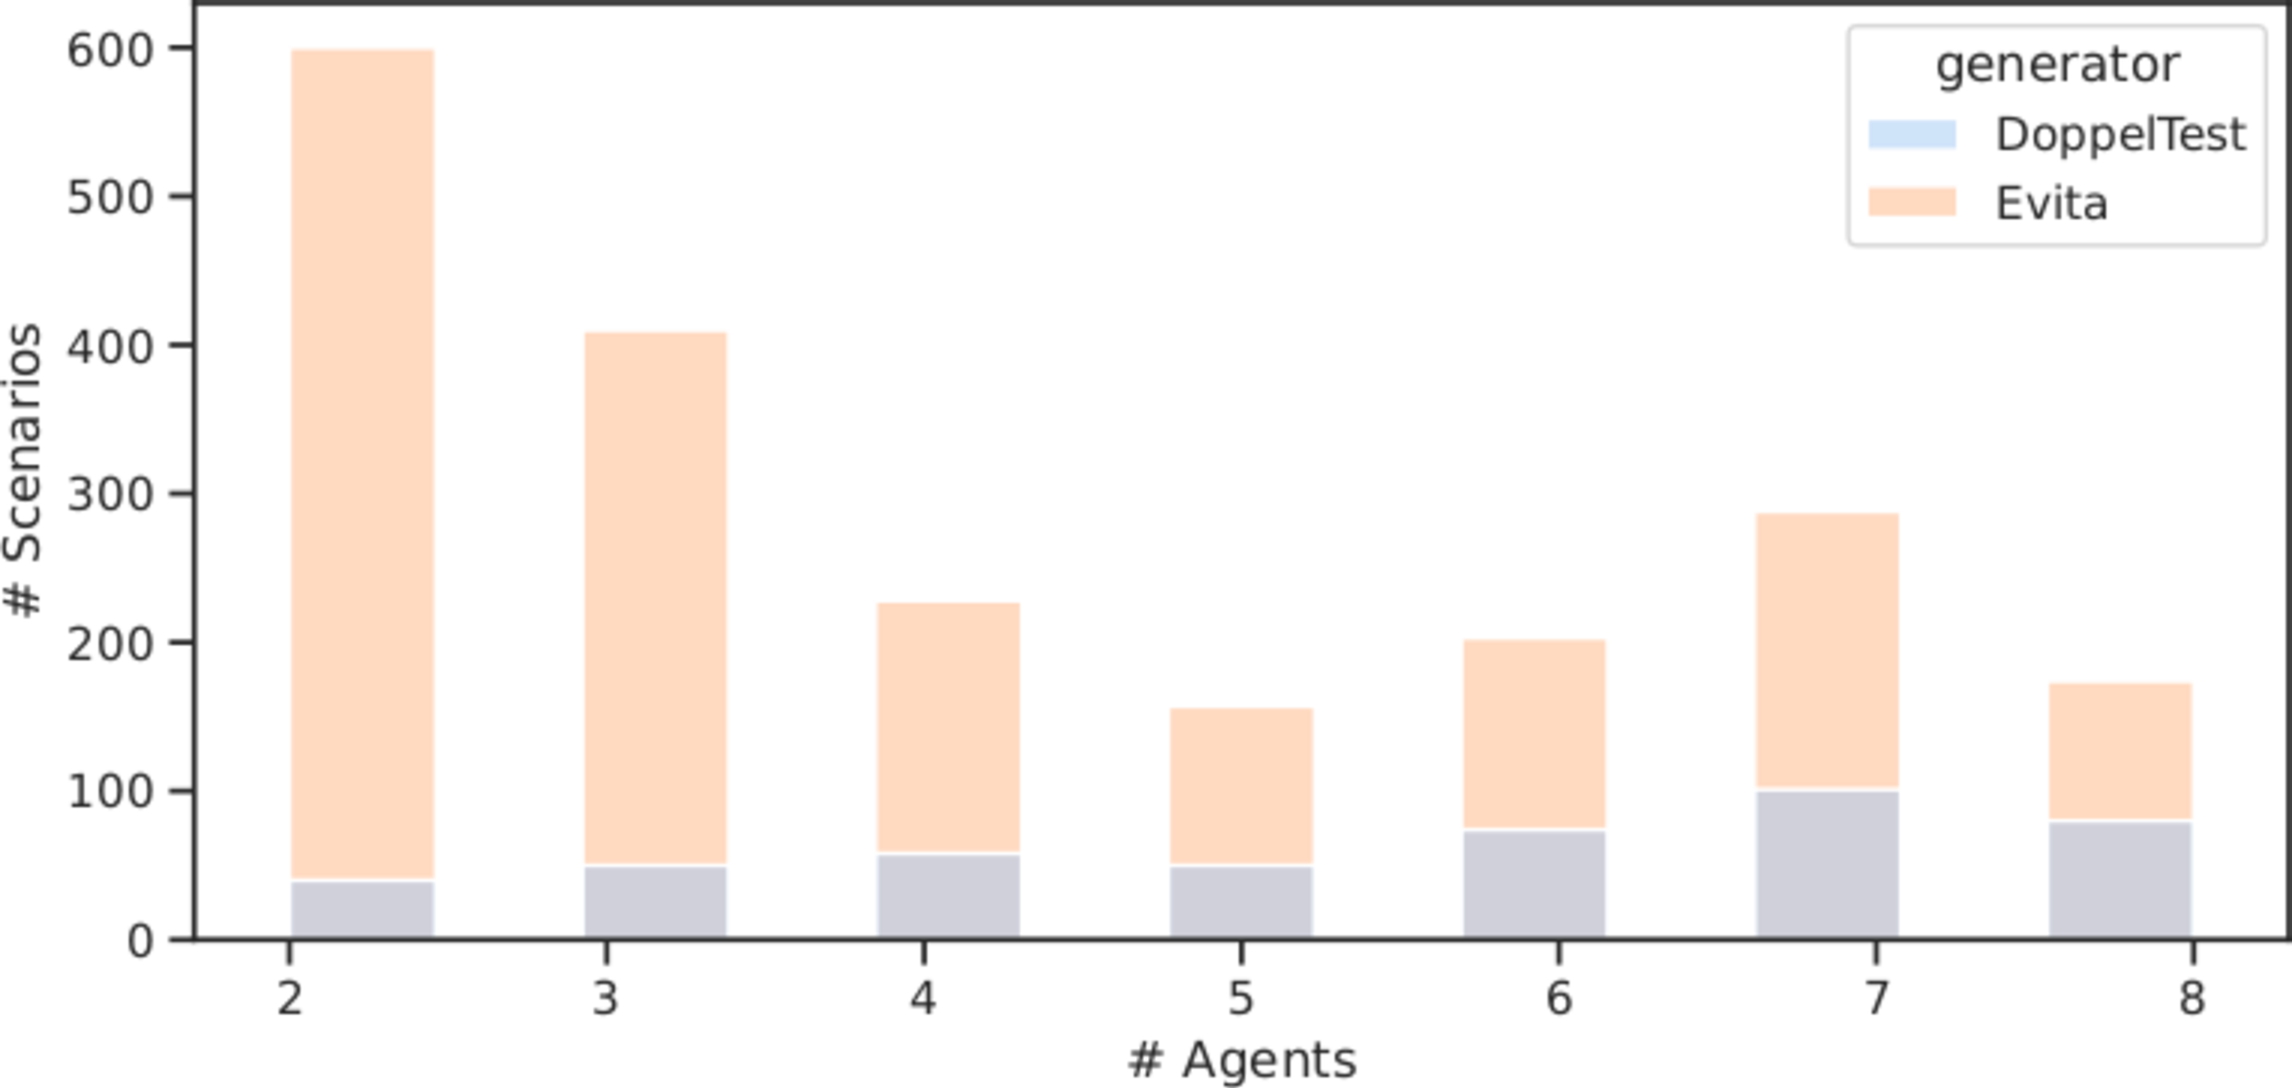
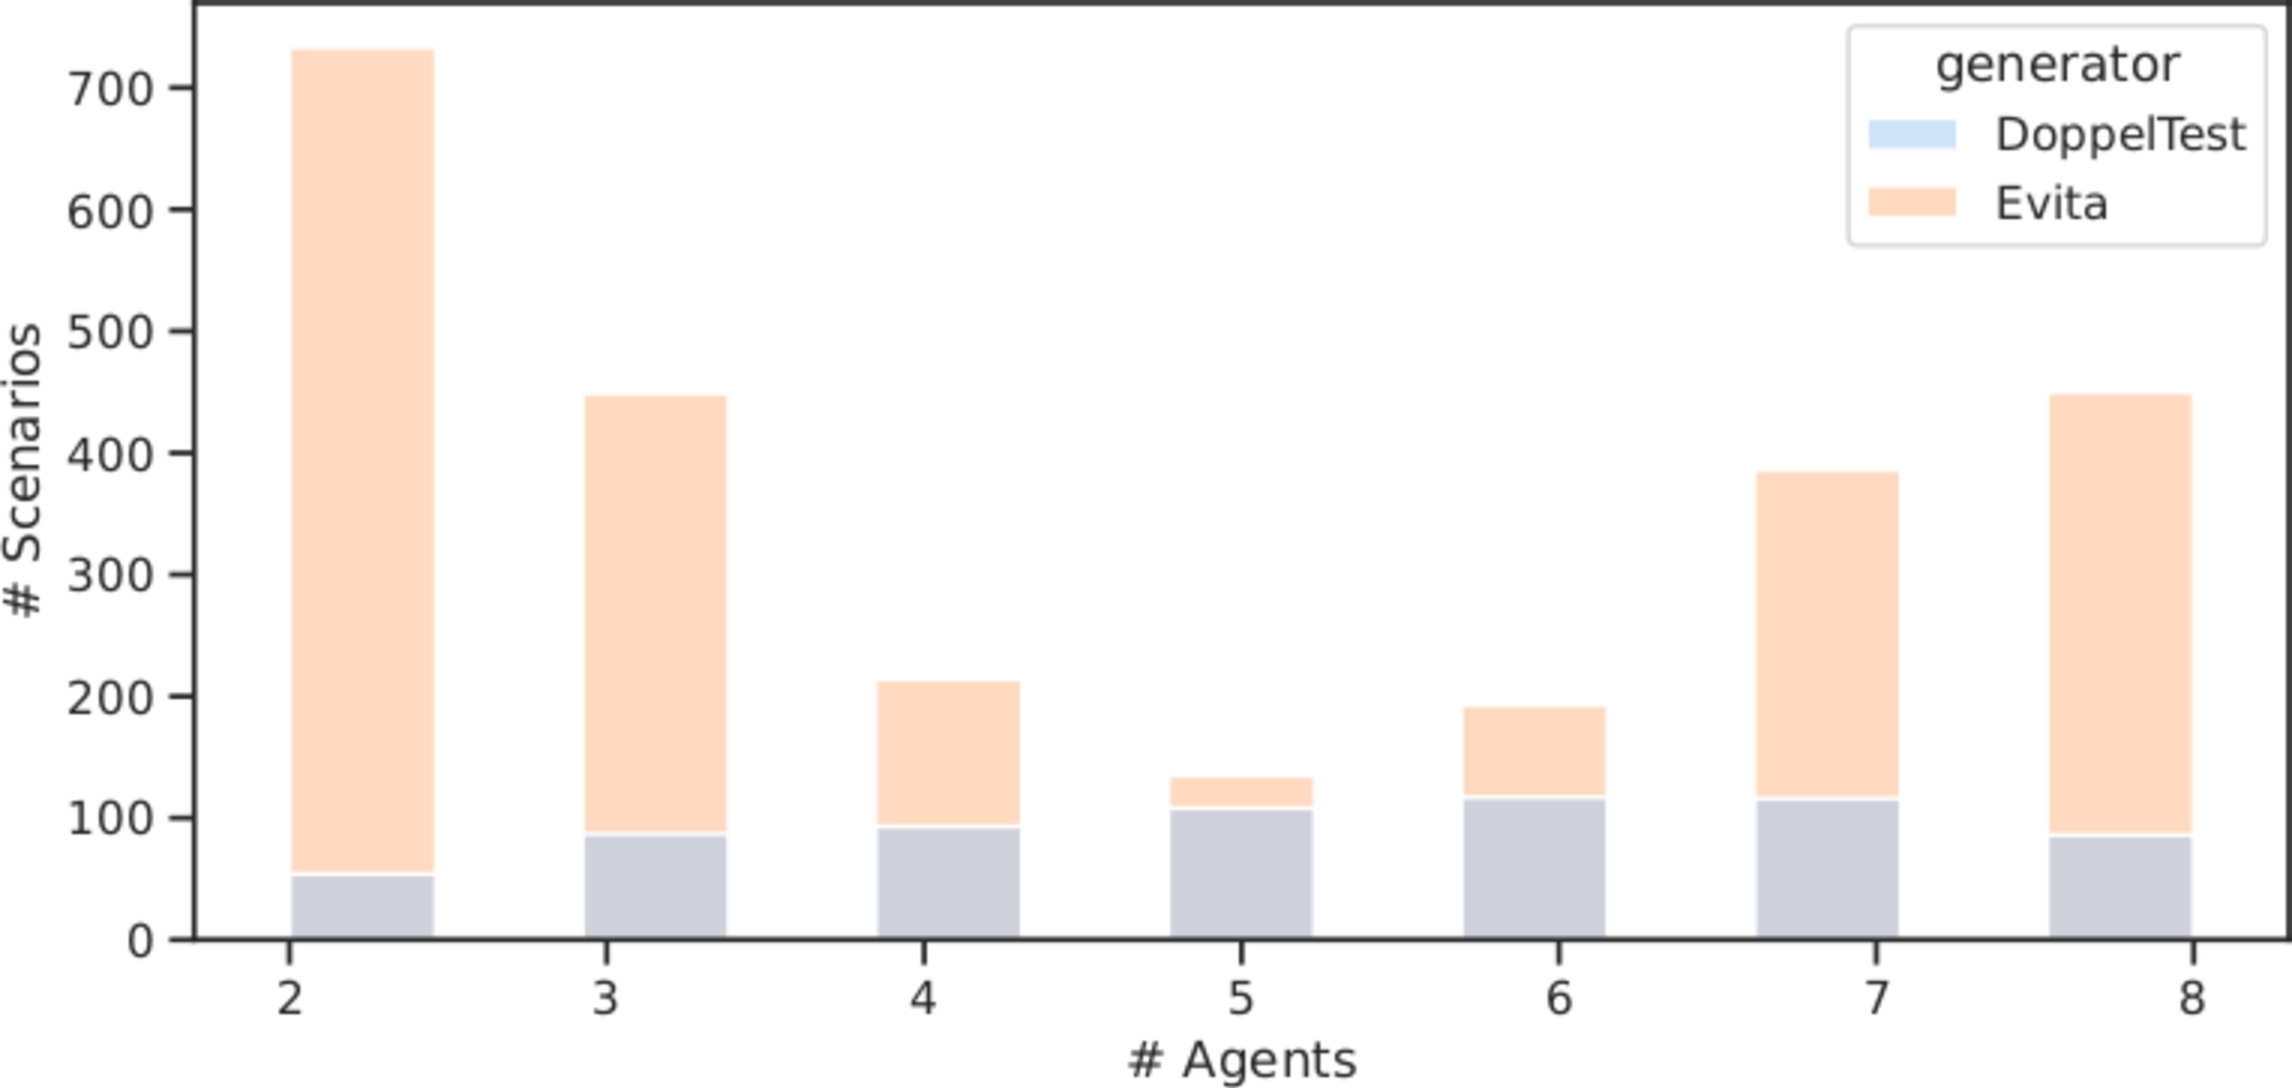
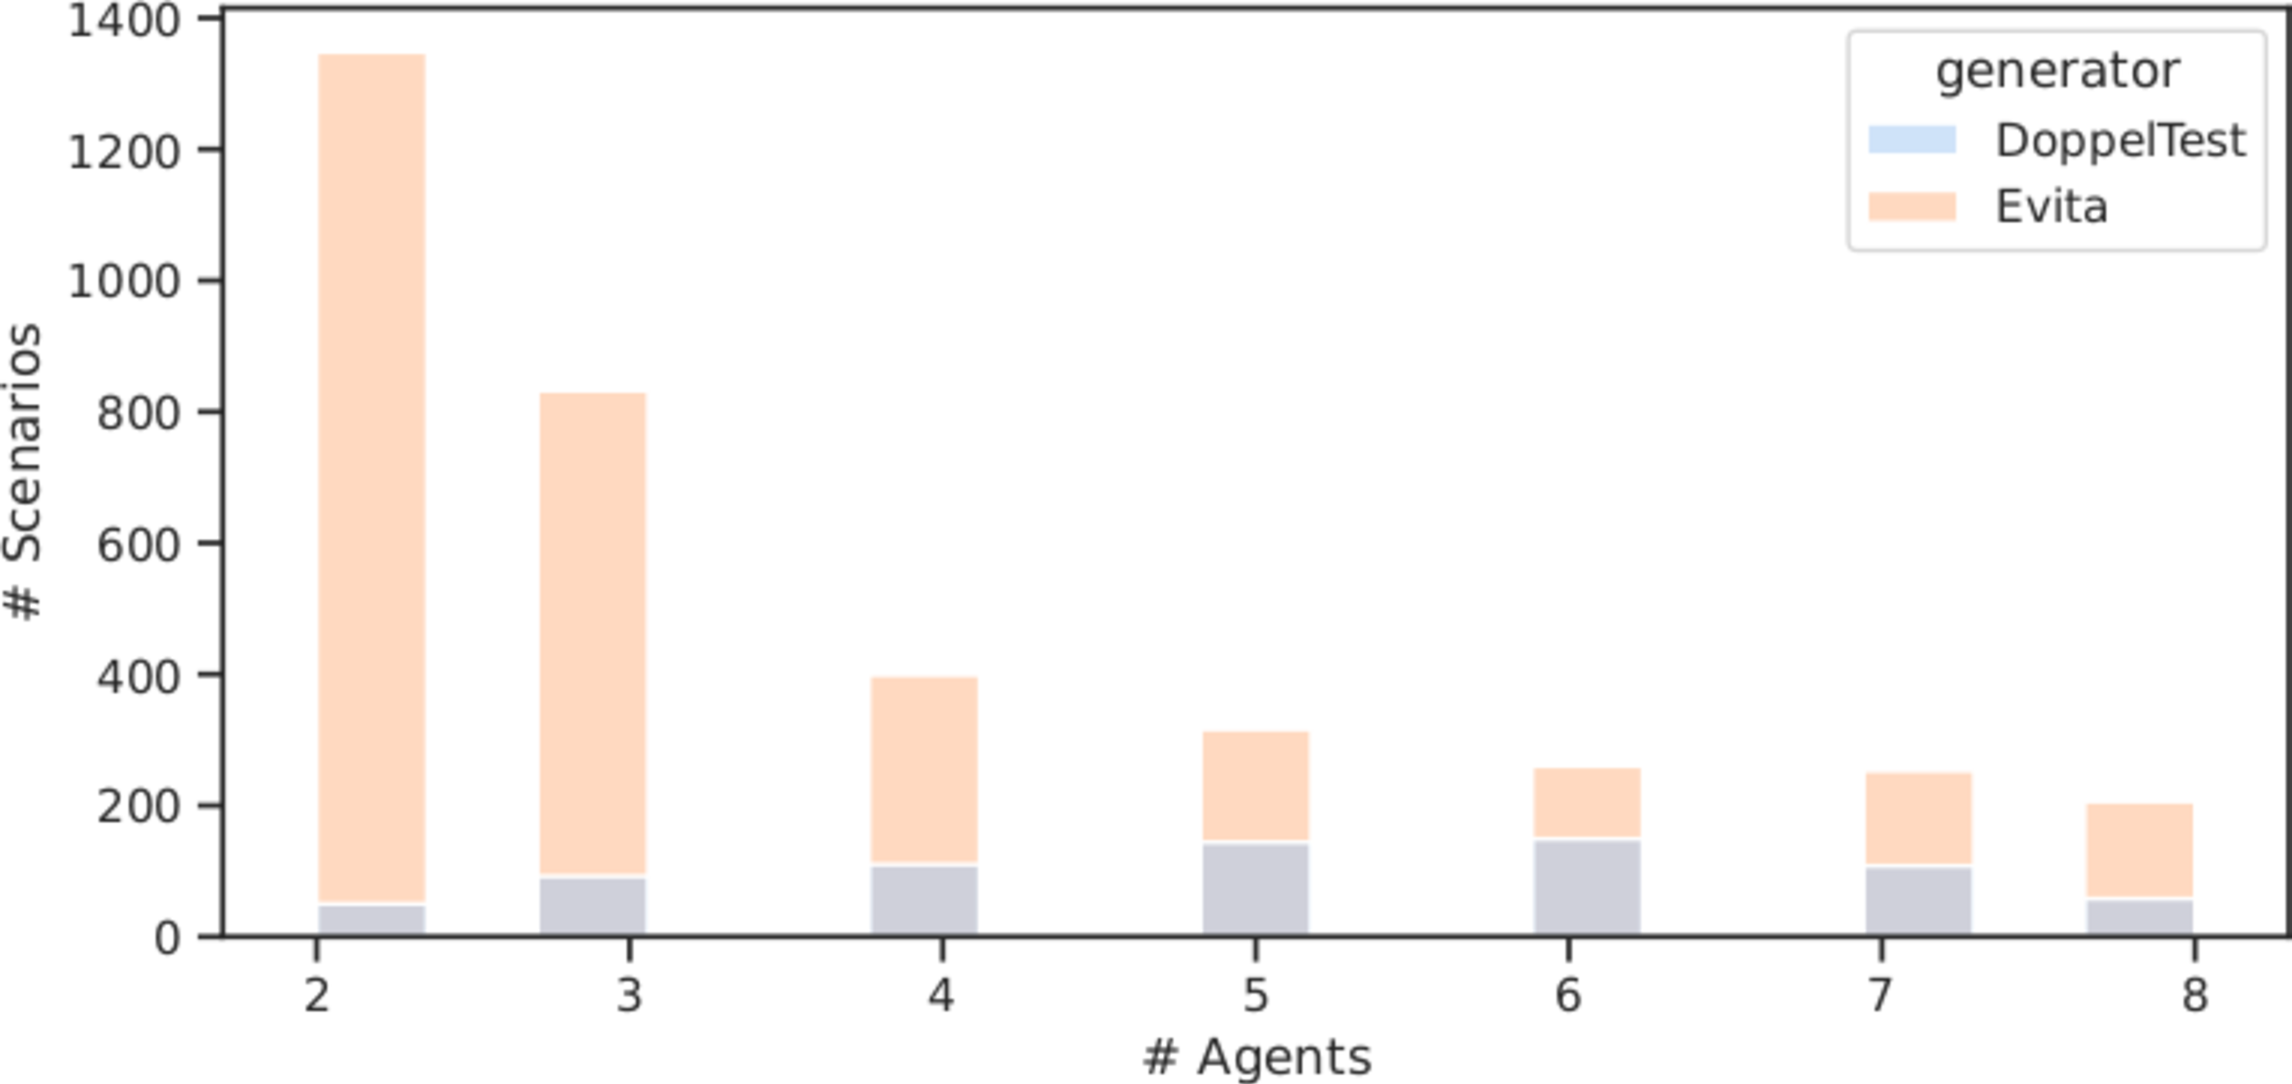
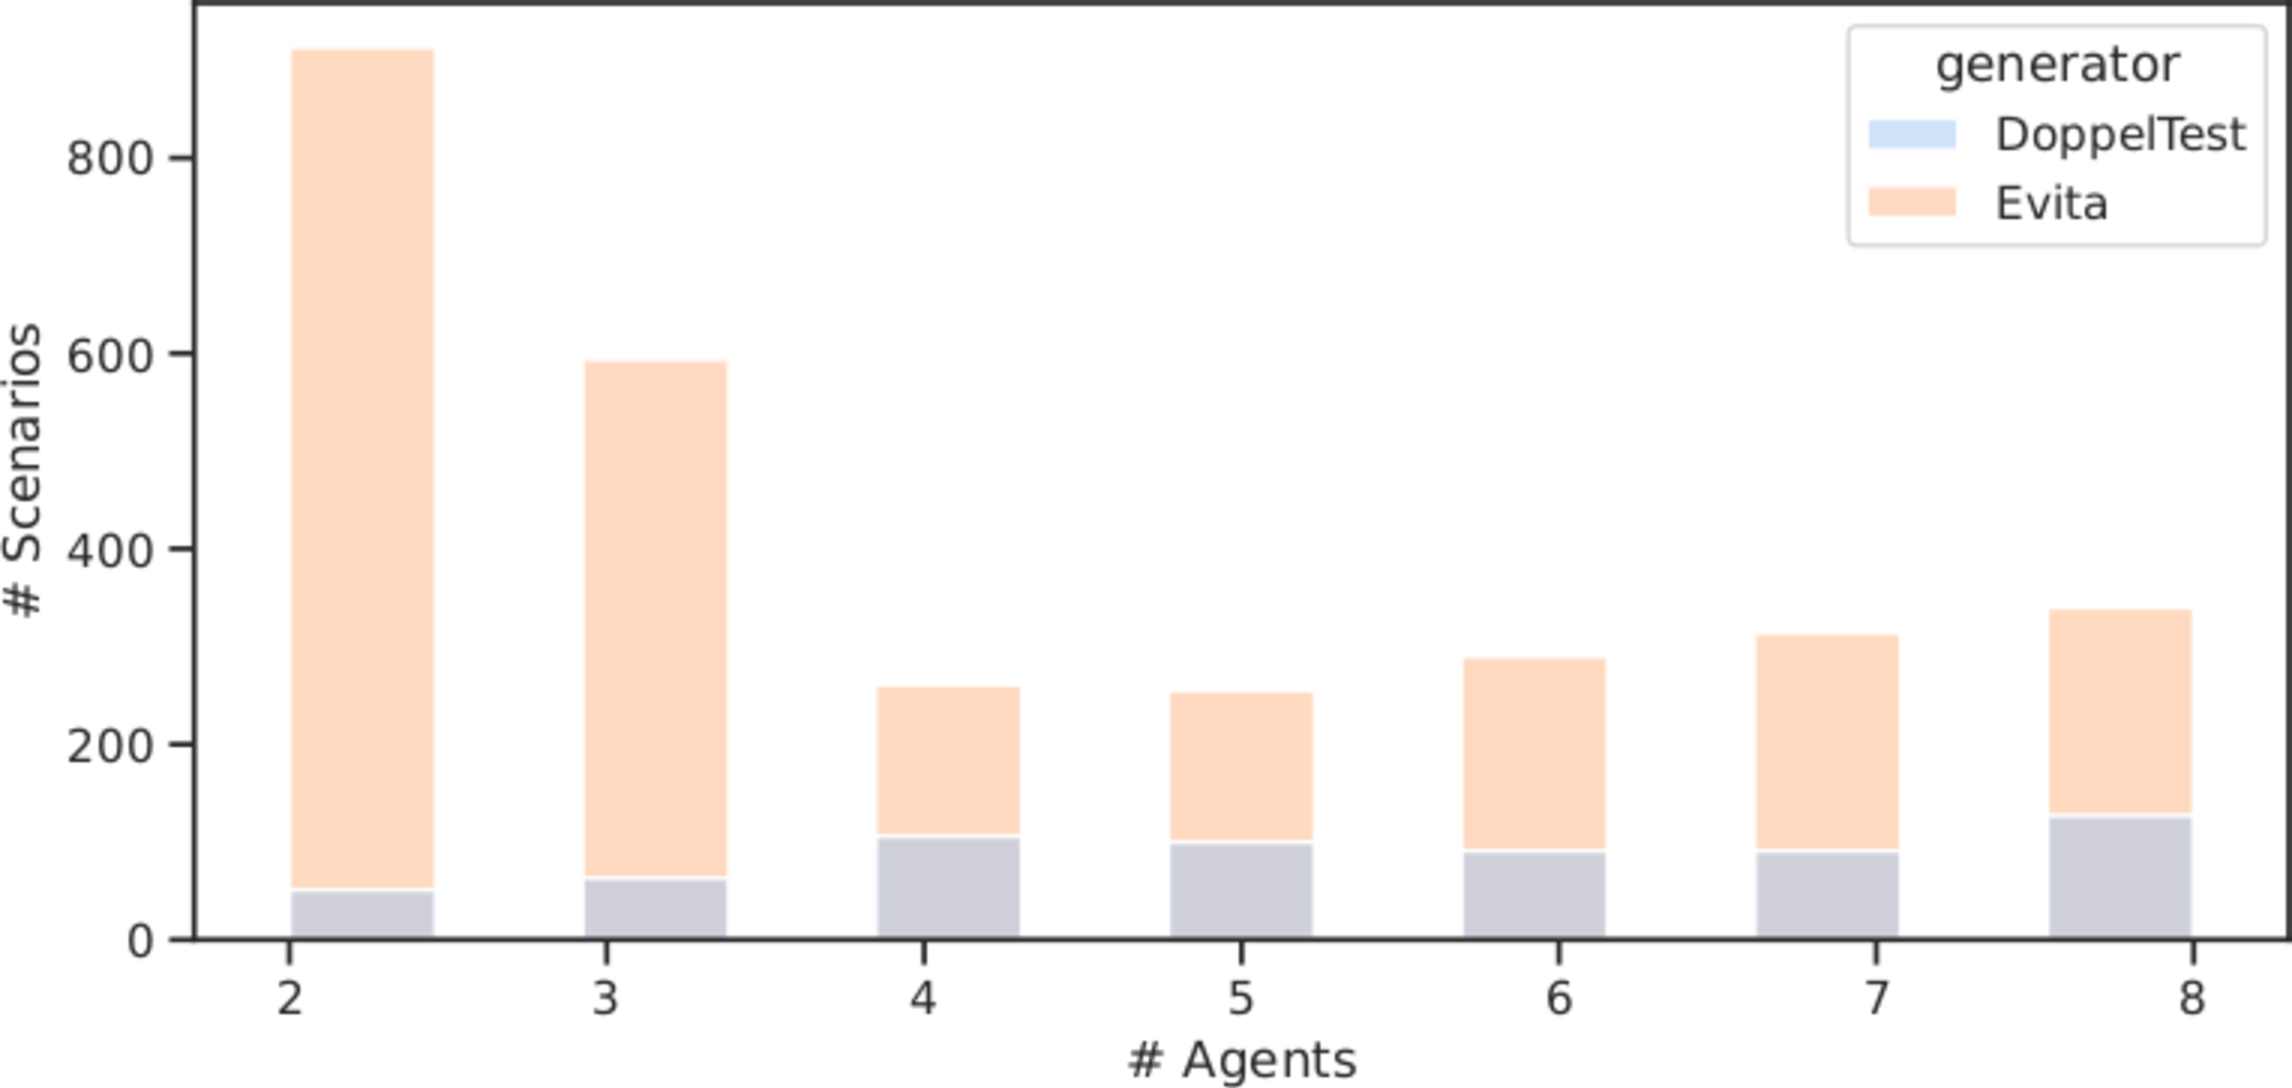
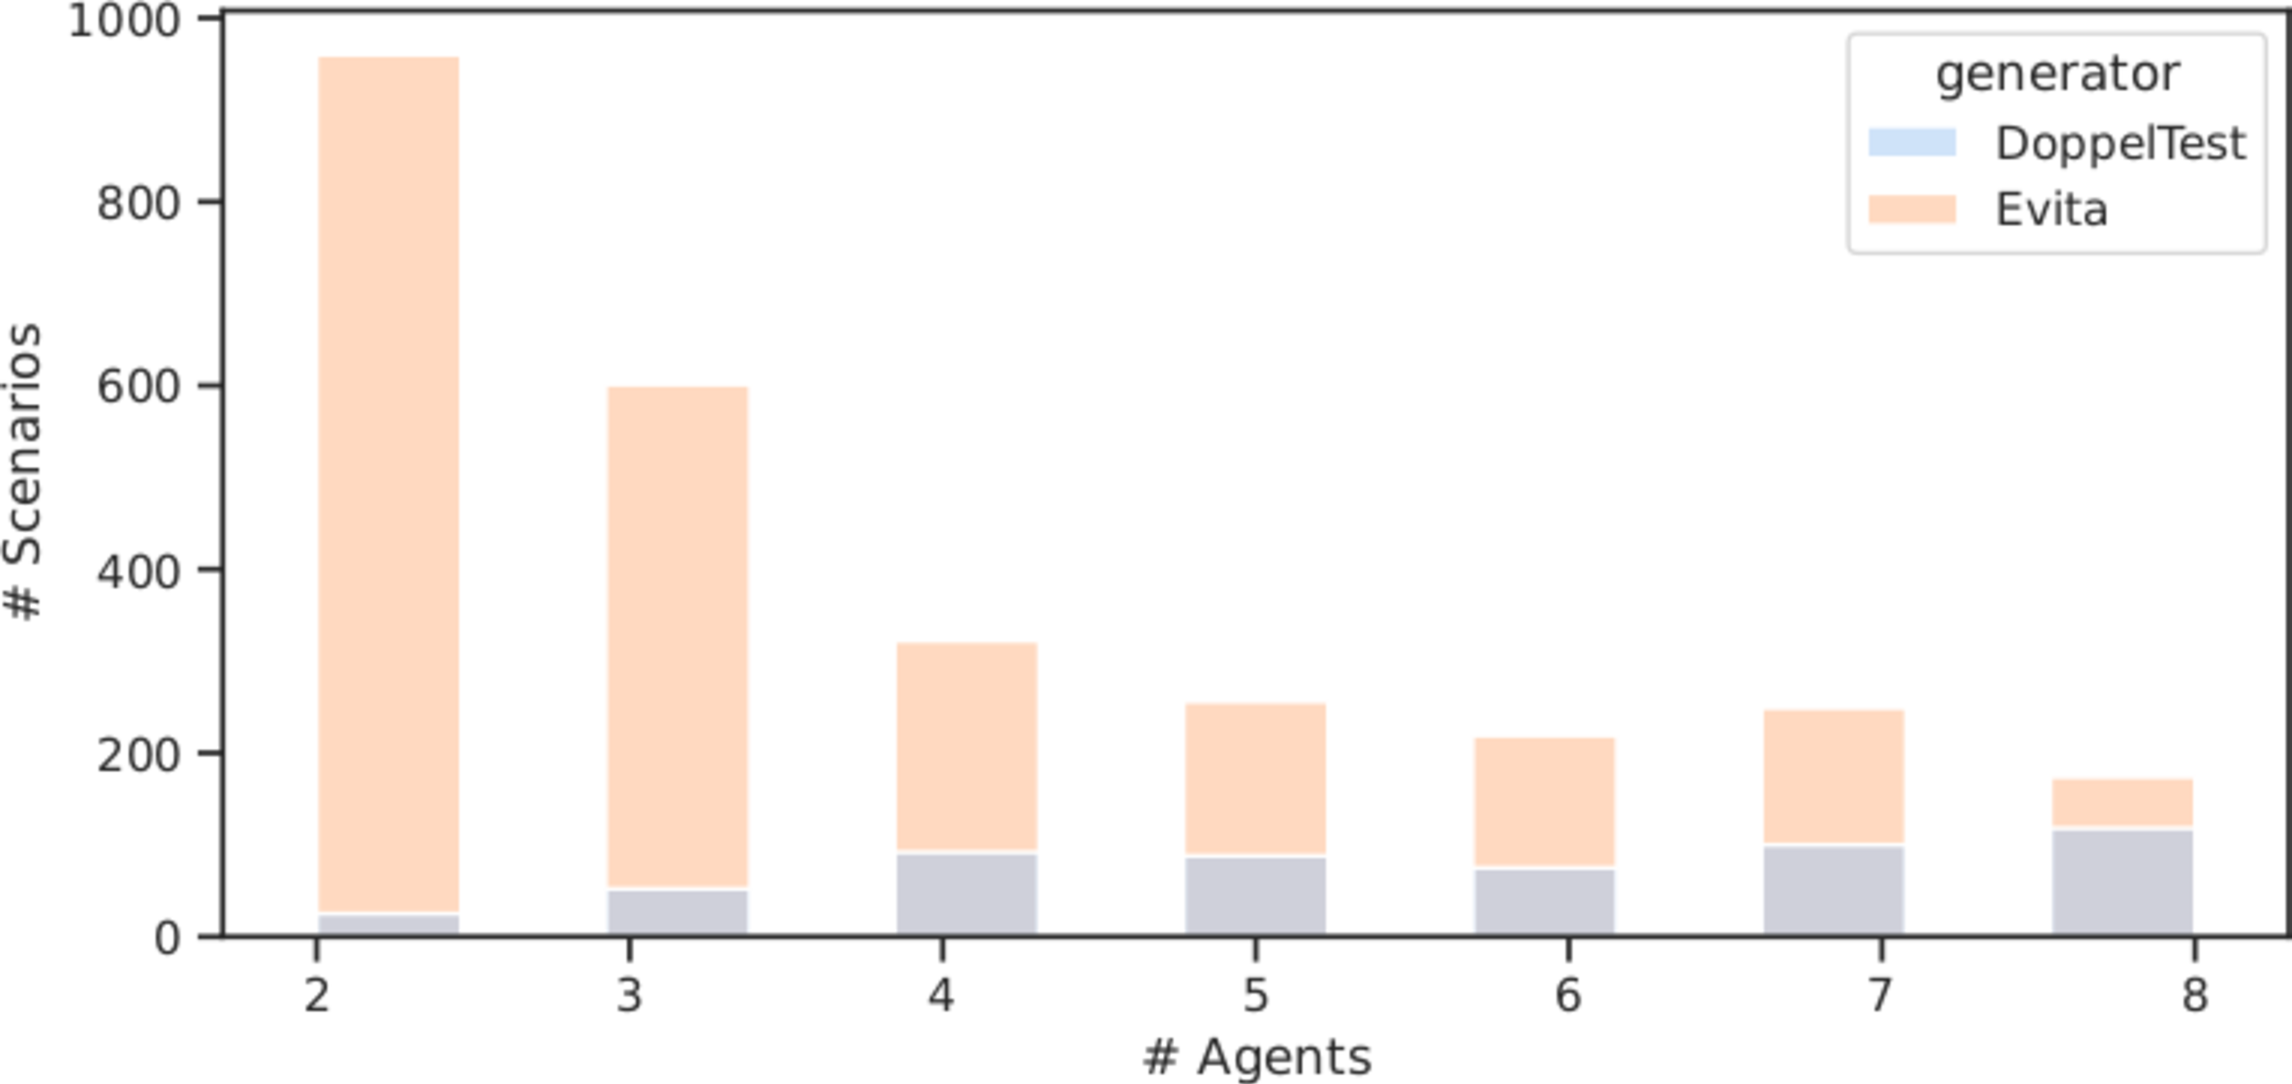
Figure 13: RQ4 – Number of vehicles in the generated scenarios with the FrenetiX experimental setting. a — Cho, b — Cologne, c — US101_09, d — US101_15, e —
US101_23
Figure 13 shows that EVITA generates simpler scenarios than Doppel``Test. Both approaches generate scenarios with any number \(K\) of vehicles, \(2 \leq K\leq 8\). However, EVITA always generates a majority of scenarios with small number \(K\) of vehicles, \(2 \leq K\leq 4\), whereas
Doppel``Test generates a majority of scenarios with high number \(K\) of vehicles, \(5 \leq K\leq 8\).
Both EVITA and Doppel``Test generate a significantly high number of scenarios with many vehicles (\(7\) and \(8\)) for the road networks Cho and
Cologne. We argue that complex road networks require multiple vehicles to generate a wide diversity of interactions.
Figure 14 shows the distribution of scenarios based on the number \(K\) of vehicles, \(2 \leq K\leq 5\) for the Baidu Apollo urban road network.
In the figure, the bars representing the approaches are overlaid. Figure 14 confirms the results in the FrenetiX highway and suburban traffic (Figure 13): EVITA
generates a higher percentage of scenarios with few vehicles than Doppel``Test.
These results confirm the results of RQ1: EVITA systematically triggers critical interactions, collisions, and traffic rule violations while keeping the test cases simple and lightweight, while Doppel``Test relies on complex
scenarios with several vehicles to uncover unique critical situations.

Answer to RQ4. EVITA generates scenarios with fewer vehicles than Doppel``Test. It generates a high number of scenarios with many vehicles when required to obtain a wide range of AVs interactions in complex
road networks.
6.5 RQ5 – How many valid scenarios does EVITA generate?↩︎
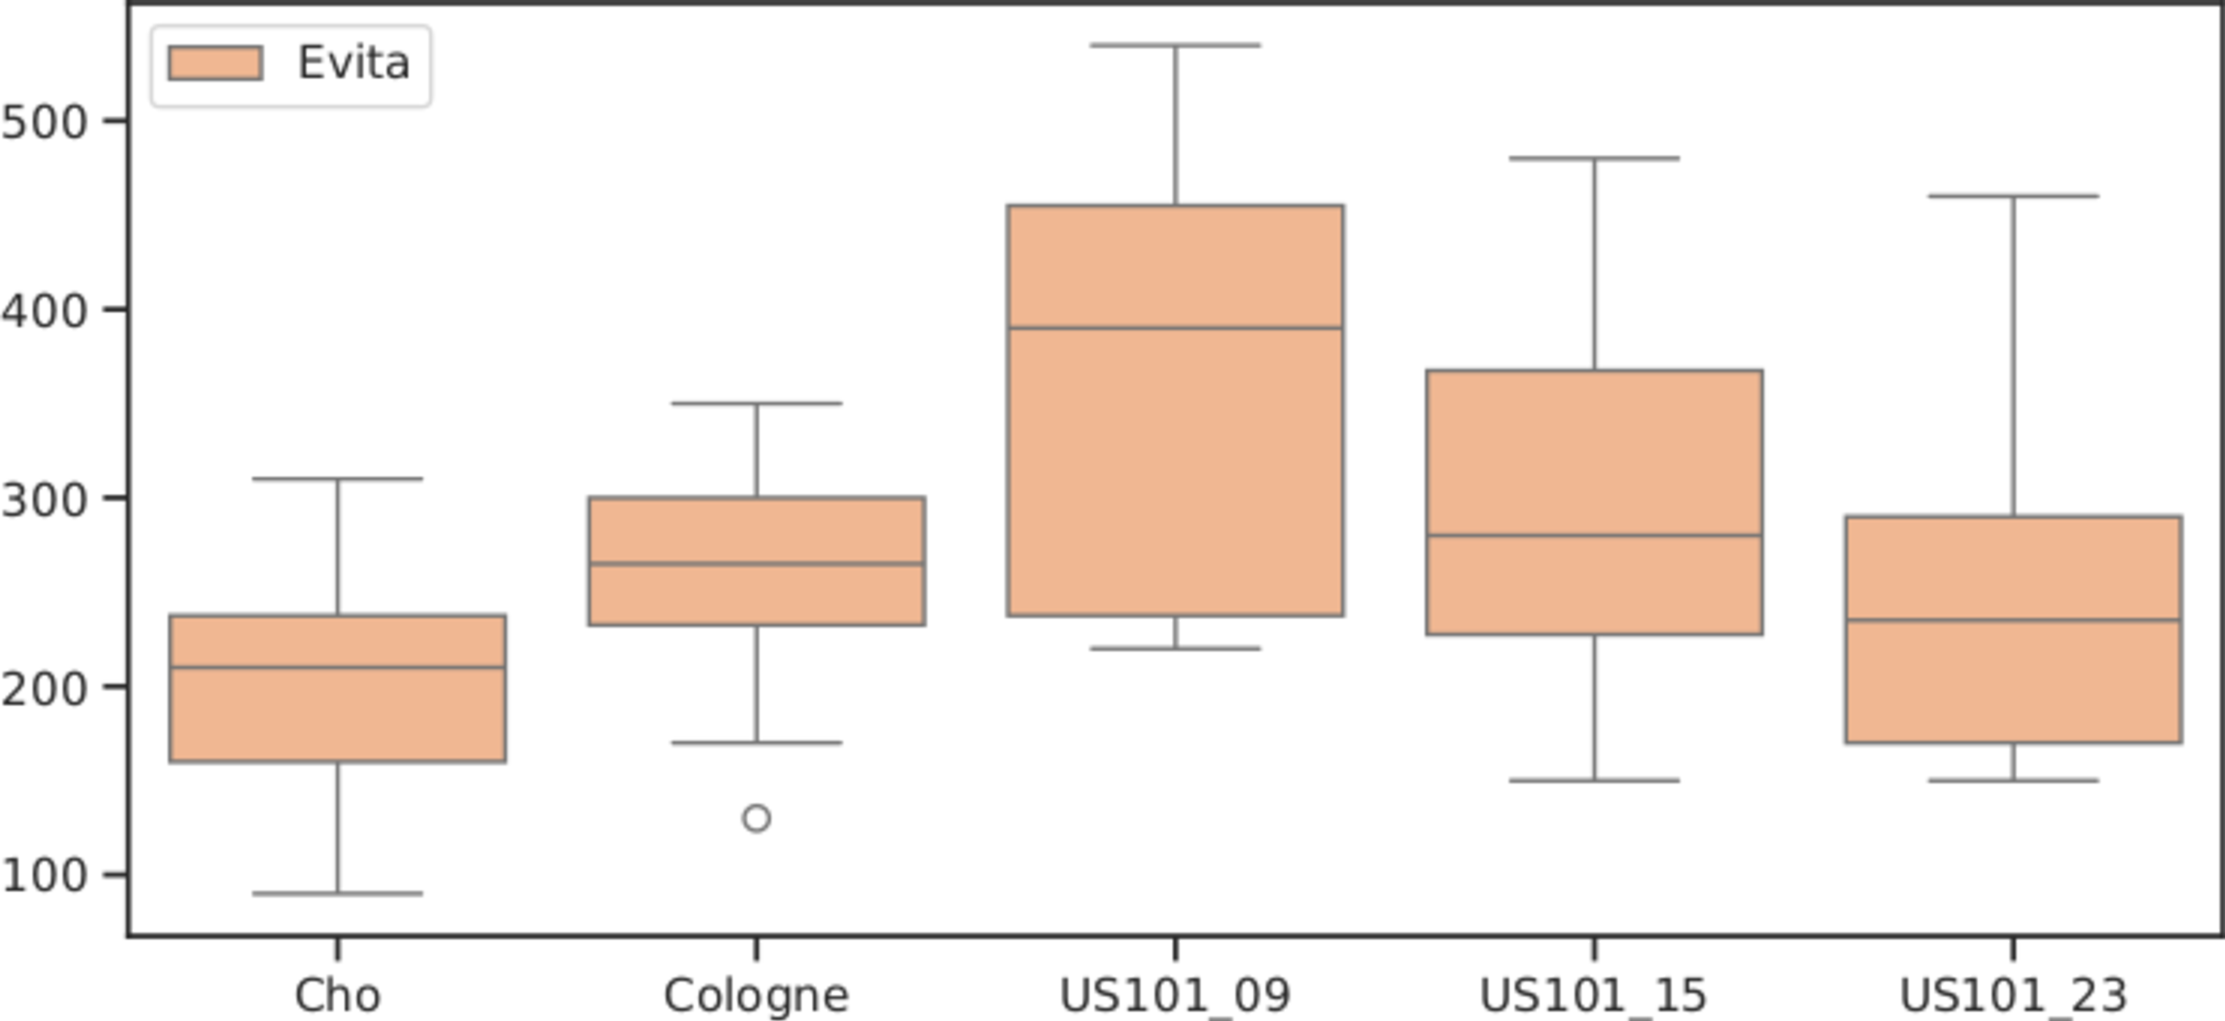
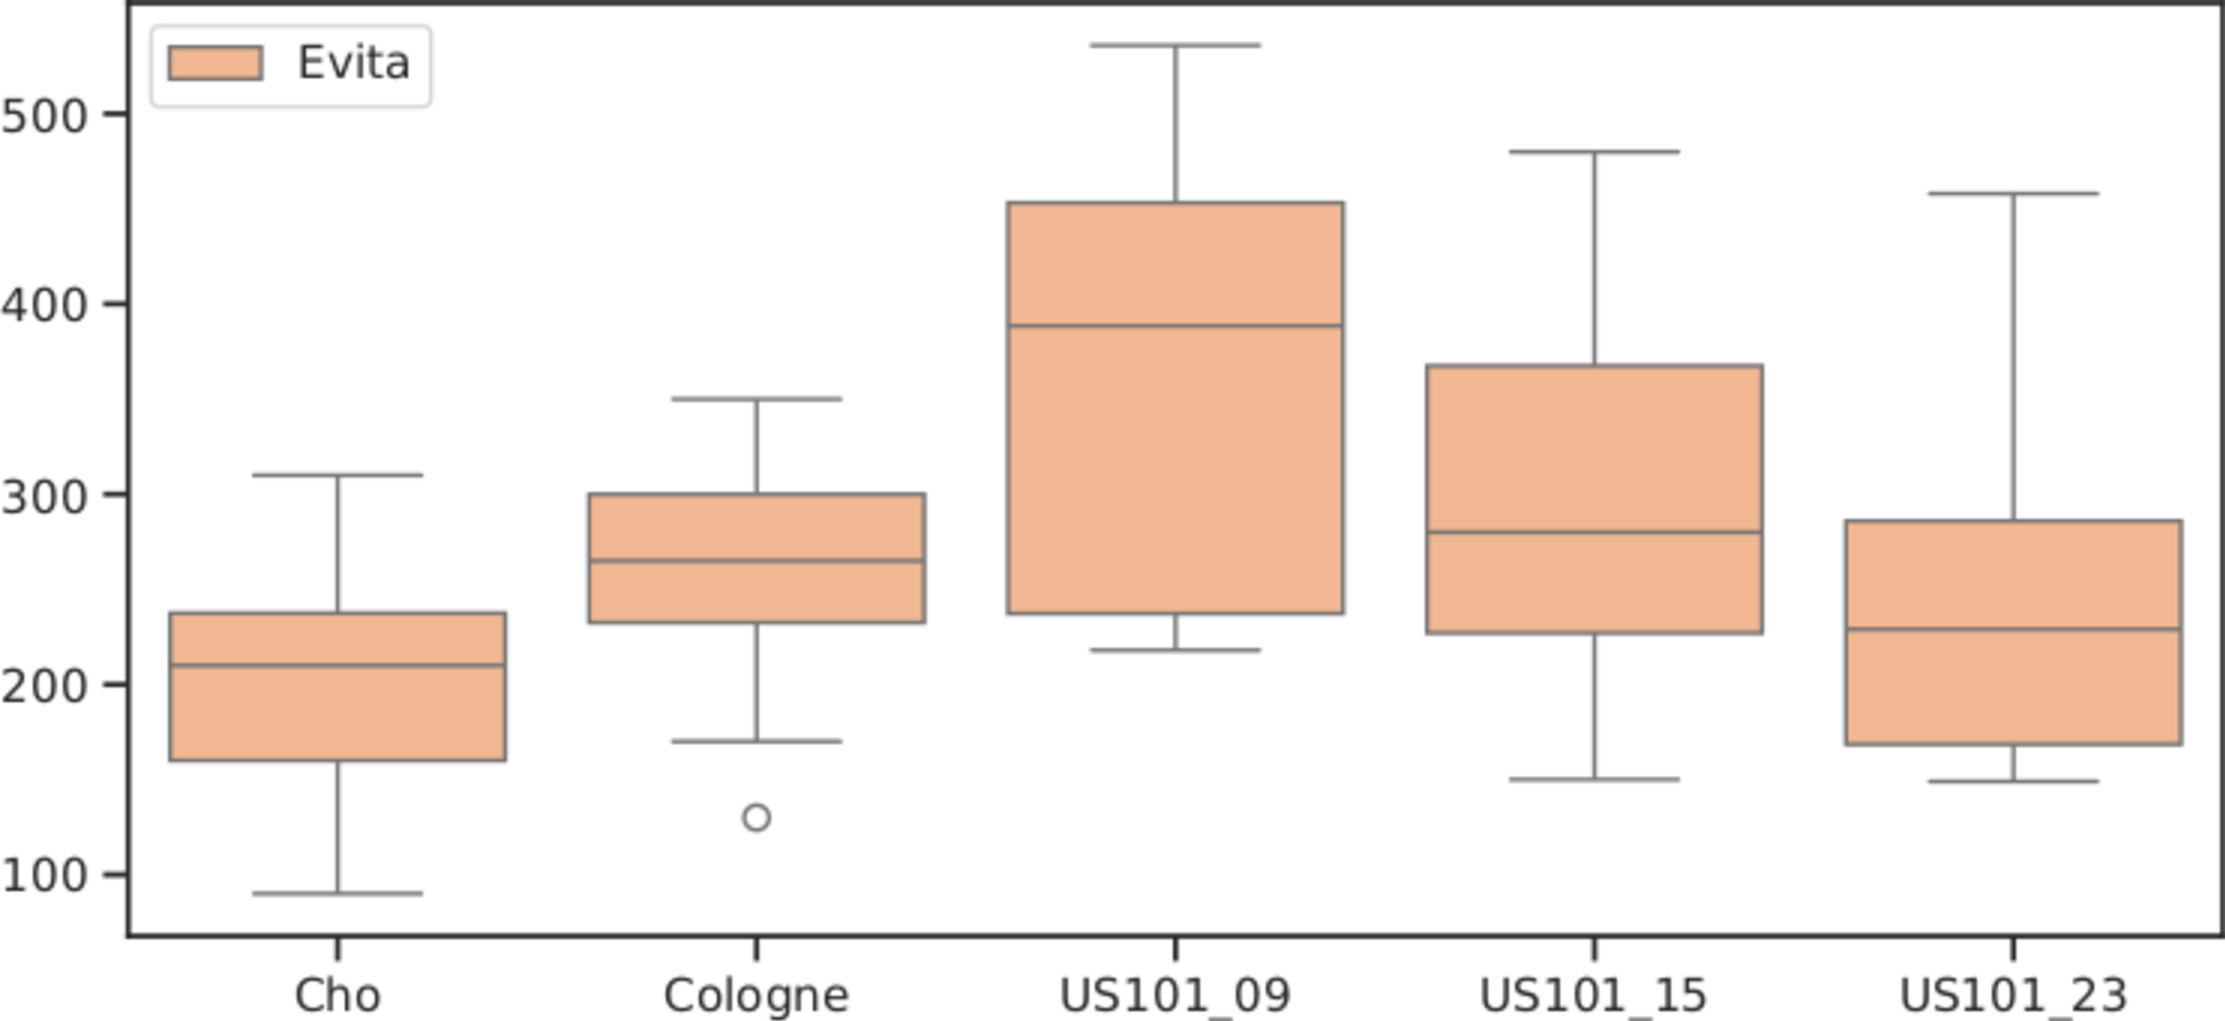
Figure 15: RQ5 – Generation statistics with the FrenetiX experimental setting. a — Total generated scenarios, b — Valid scenarios
RQ5 assesses the effectiveness of EVITA as a test generator, in terms of the percentage of valid scenarios that EVITA generates. Figure 15 reports the number of total and valid scenarios that
EVITA generates for each FrenetiX road network. The almost complete overlapping of the two figures shows that EVITA generates a negligible number of invalid scenarios. EVITA generates between \(200\) and \(400\) scenarios on average for each road network with a budget of \(3\) CPU-hours. It generates a scenario in \(27\)
to \(34\) seconds, depending on the complexity of the network.
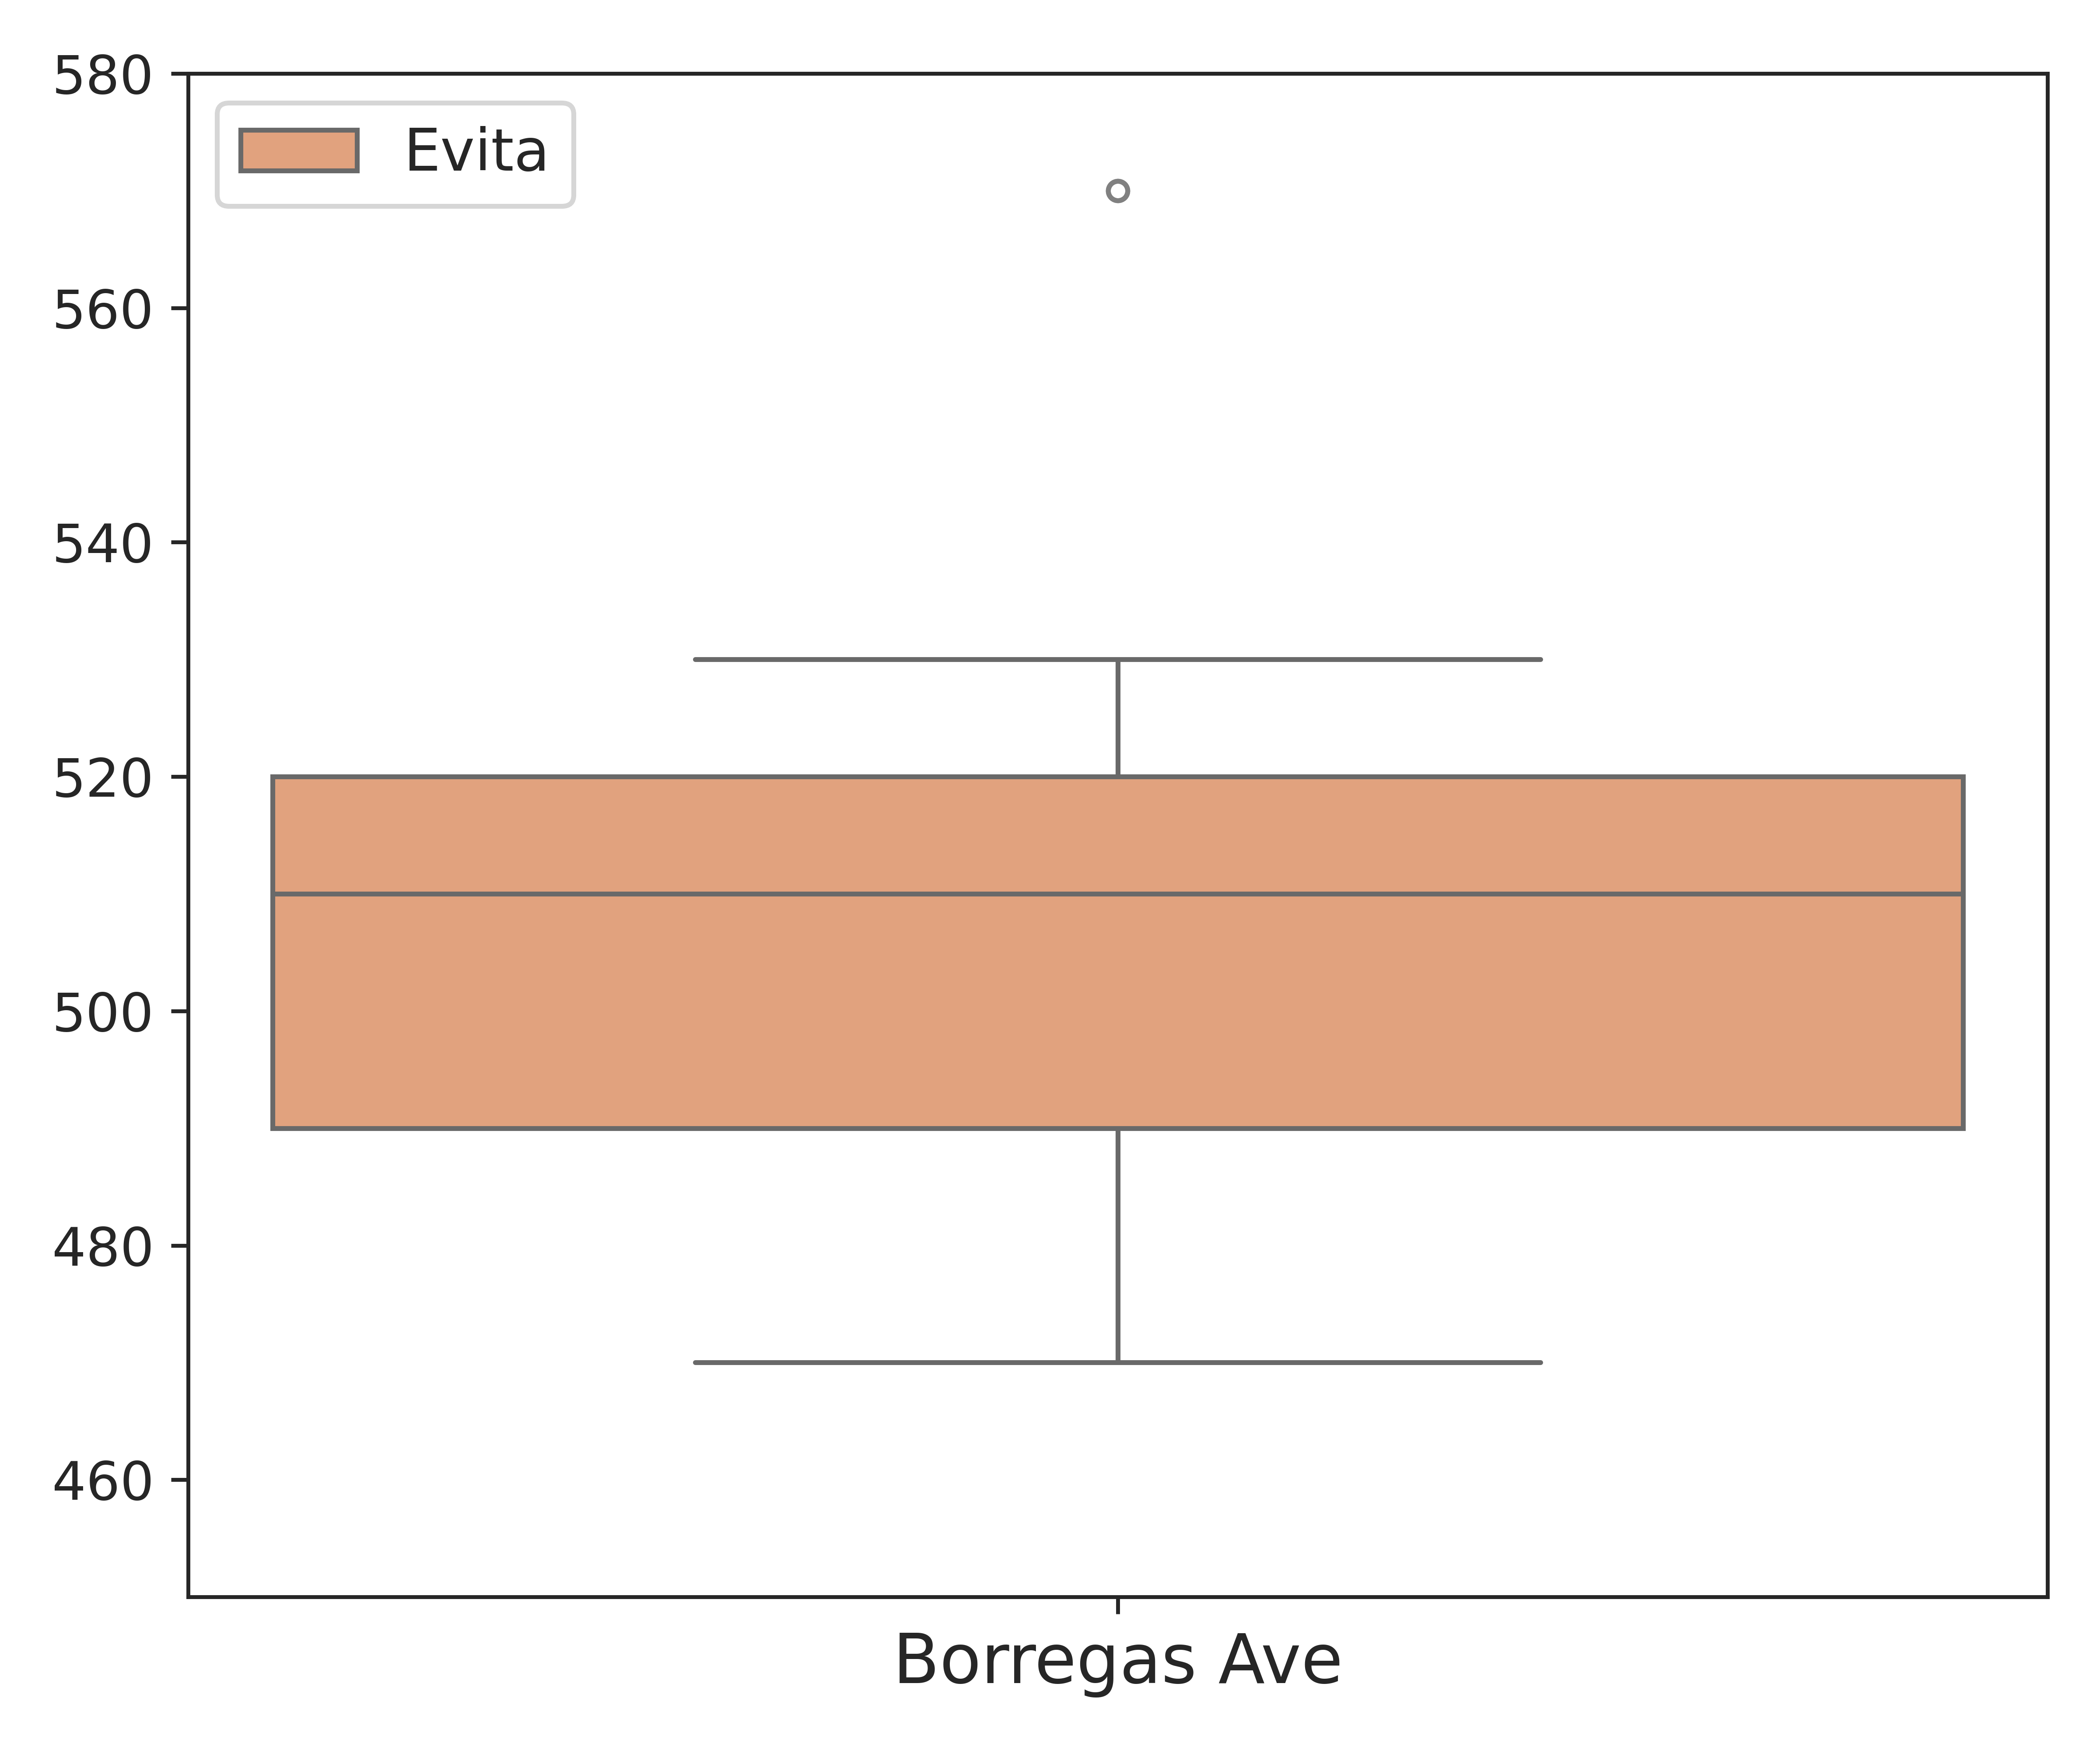
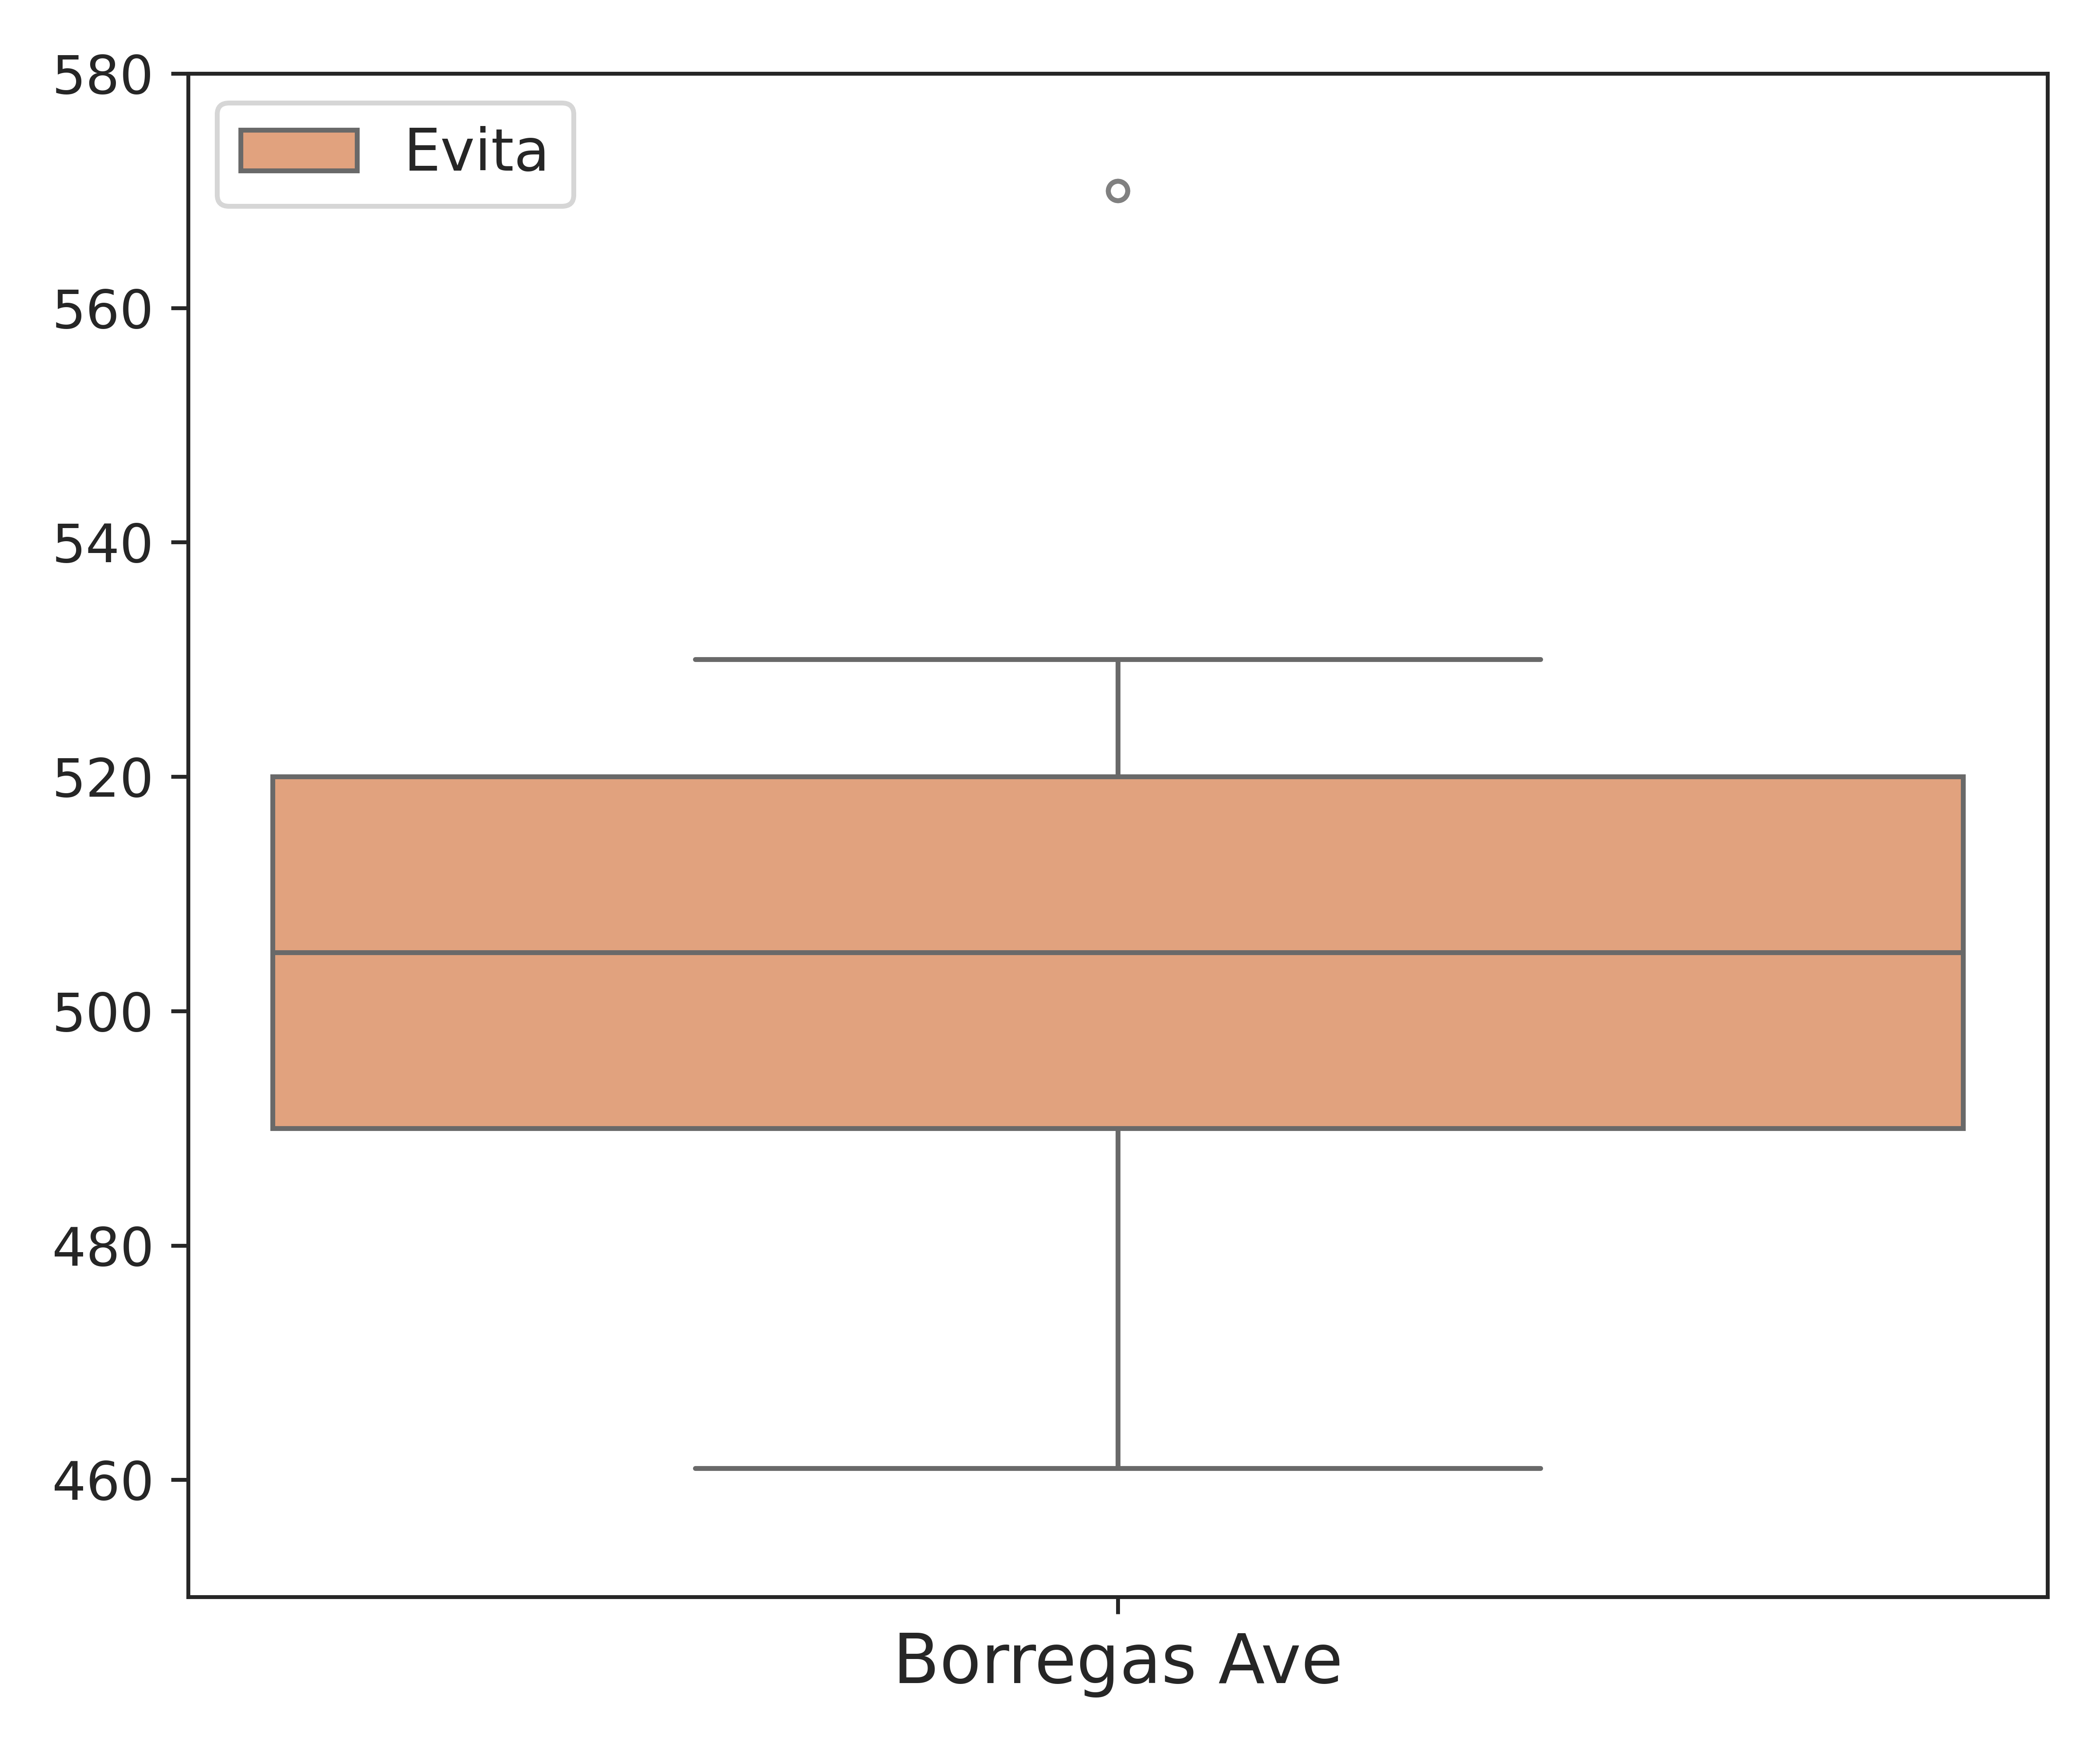
Figure 16: RQ5 – Generation statistics with the Baidu Apollo experimental setting. a — All generated scenarios, b — Valid scenarios
Figure 16 shows the number of total and valid scenarios that EVITA generates for the Baidu Apollo experimental setting. The near overlapping of the two diagrams confirms the results:
EVITA generates a negligible number of invalid scenarios (\(29\) out of \(490\) in the worst case). EVITA generates \(470\) to
\(570\) scenarios on average for the Borregas Ave road network with a budget of \(12\) CPU-hours. It generates a scenario in \(76\) to \(92\) seconds. The generation time for the scenarios of the Baidu Apollo network is higher than the FrenetiX network, due to the parsing operations required to convert between Common``Road and Apollo compatible
scenarios.
Answer to RQ5. EVITA is effective as it generates scenarios quickly, and only a negligible number of them are invalid.
7 Threats to Validity↩︎
We present an overview of the main construction, internal, and external validity threats, and discuss how we mitigated them.
7.1 Construction Validity↩︎
The main threats to the construction validity stem from how we check the interactions and the different settings of EVITA and Doppel``Test in the comparative evaluation.
7.1.0.1 Interaction checks
In the experimental setup for testing FrenetiX, EVITA identifies interactions as changes in consecutively planned trajectories coupled with the presence of specific scenario elements (vehicles, traffic lights, stop signs) within a safety
distance (see conditions C1 and C2 in Section 3). However, a change in a planned trajectory does not necessarily originate from an interaction with such scenario elements; thus, we may suffer from some false
positives. We opted for efficiency over precision and chose a metric that can be quickly computed to guide scenario generation, since it is on the critical path of EVITA. The search algorithm at the core of our approach is robust and works
well with approximate metrics to drive generation towards exposing multiple, diverse interactions. Our sample inspection of the results indicates a negligible impact of false positives on the presented results.
7.1.0.2 Settings
Doppel``Test generates scenarios with an initial velocity of the AVs of \(0\) km/h, while EVITA generates scenarios with any initial non-negative velocity for the AVs. This difference may bias
the comparison of the two approaches. We executed all experiments for EVITA with an initial velocity of \(0\) km/h for all AVs to check for potential bias. The experiments confirm the results reported in
Section 6.
7.2 Internal Validity↩︎
The main threats to the internal validity come from the randomness of the search algorithms and the quality of the prototype.
7.2.0.1 Randomness of the search algorithms
The randomness of search algorithms could lead to misleading results. To mitigate this threat, we followed established guidelines [46]: We repeated the experiments multiple times (10 repetitions) and analyzed the results using statistical tests that consider statistical significance and effect size.
7.2.0.2 Quality of the framework
Possible bugs in the implementation of EVITA and Doppel``Test extensions can undermine the validity of the experiments, for instance, by failing to detect a collision between two vehicles or by recording metrics imprecisely. We
thoroughly tested the framework implementation, and we provide access to a replication package [24] to further validate
the framework and the experiments.
7.3 External Validity↩︎
The main threat to external validity is the limited scope of the experiment, which limits the generalizability of the results. We mitigate this risk by considering two simulators and test subjects (FrenetiX and Baidu Apollo) and six road networks
(Cho, Cologne, US101_09, US101_15, US101_23, Borregas Ave). We modeled the road networks after real road segments, with representative road features, and a wide range of driving
scenarios.
8 Related Work↩︎
The many recent surveys on AVs testing [11], [16], [54], [55] agree that most current approaches focus on testing individual AVs, and exploit search-based algorithms, fuzzing, or artificial intelligence to explore the testing scenario space. Ben Abdessalem et al. [35], [56] combine surrogate and machine-learning models with search-based algorithms to test the safety of some systems, such as the pedestrian detection and emergency braking systems. Gambi et al. [57] propose search-based procedural content generation to generate road structures for testing the lane-keeping systems. Luo et al. [58] propose a search-based approach to find scenarios that expose different combinations of traffic violations.
Other approaches rely on fuzzing. Li et al. [59] propose AV-FUZZER, a fuzzing approach to find collisions. Cheng et al. [33] propose a behavior-guided fuzzing technique to find different behaviors of the ego-vehicle that can potentially lead to different types of violations. The most recent test generator approaches exploit Reinforcement Learning and Generative AI. Lu et al. [60] use Reinforcement Learning to find environments in which the vehicle collides. Tang et al. [61] use LLMs to transform collision reports into critical scenarios. In this paper, we propose search-based algorithms to generate test cases for testing non-cooperative interacting autonomous vehicles.
Only few approaches target the testing of interacting autonomous components. Ben Abdessalem et al. [62] generate tests that expose
feature interactions, which they define as unforeseen interactions among the autonomous modules comprising the \(\mathit{av}\), for instance, cruise control and emergency braking. EVITA targets the interactions
among multiple AVs.
Gambi et al. [63] and Huai et al. [18] generate critical scenarios involving multiple AVs. Gambi et al.’s TIAV [63] is a single-objective
genetic algorithm that identifies critical highway and suburban scenarios by maximizing danger [37]. Huai et al.’s
Doppel``Test [18] is a multi-objective genetic algorithm that identifies scenarios in which the AVs violate traffic rules.
EVITA, TIAV and Doppel``Test share the same basic objective: testing multiple AVs to identify collisions that testing a single AVs misses. EVITA improves the encouraging results of TIAV and Doppel``Test
by emphasizing the various kinds of AVs’ interactions, and exploring the space of AVs interactions to expose a wide variety of critical situations and traffic violations. EVITA generates highway, suburban, and urban scenarios and does not make
assumptions on the ability to control dynamic obstacles such as pedestrians.
Interactions are closely related to the more general concept of causality [64], a vast research field that aims to understand how an event (the cause) brings about another event (the effect). While causality has recently been used in the context of testing AVs [65], its definition remains quite abstract and is often impractical and expensive to compute. To the best of our knowledge, our definition is the first lightweight definition of interactions that is both effective in describing interactions between vehicles in autonomous driving and efficient to compute.
9 Conclusions and Future Work↩︎
In this paper, we propose EVITA, an approach for testing the safety of AVs interactions, identifying safety-critical scenarios, and checking AVs under a large variety of types of interactions. While state-of-the-art approaches [16], [66] test single AVs reacting to pre-programmed NPCs, and thus miss critical
issues that emerge from the interactions of independent AVs, EVITA tests critical scenarios that involve multiple interacting AVs with an original multi-objective search-based approach.
The results of our experiments that we report in the paper confirm that generating scenarios involving multiple interacting AVs can effectively expose a wide range of safety failures in AVs. Our experiments with two popular simulators and different road
networks confirm the generality of EVITA.
EVITA is a relevant step towards ensuring the quality of autonomous driving at scale. It provides a solid foundation and a ready-to-use framework for further investigating AVs interactions, thereby opening up interesting research
directions.
The results presented in this paper contribute to the research on AVs by
providing a precise and accurate definition of AVs’ interactions that enables EVITA to prune irrelevant interactions during test generation, thus boosting the efficiency and effectiveness of test generation,
extending the scope of testing AVs towards testing the interactions among AVs from different manufacturers, and
discussing the results obtained by experimenting in different traffic conditions and with diverse static and dynamic traffic obstacles.
plus 1mu
References↩︎
See the
Common``RoadWeb Page at https://commonroad.in.tum.de↩︎\(\mathit{min\_}\-\mathit{pos\_}\-\mathit{mod}\) and \(\mathit{max\_}\-\mathit{pos\_}\-\mathit{mod}\) are search hyperparameters (see Table 1).↩︎
\(\mathit{min\_}\-\mathit{init\_}\-\mathit{vel}\) and \(\mathit{max\_}\-\mathit{init\_}\-\mathit{vel}\) are search hyperparameters (see Table 1).↩︎
To ease the results discussion, we map the \(\hat{A}\)12 values into labels, following Kitchenham et al.’s classification [47]: For \(\hat{A}\textsubscript{12}> 0.5\): negligible difference (\(\hat{A}\textsubscript{12}\in (0. 5, 0.556)\)), small difference (\(\hat{A}\textsubscript{12}\in [0.556, 0.638)\)), medium difference (\(\hat{A}\textsubscript{12}\in [0.638, 0.714)\)), and large difference (\(\hat{A}\textsubscript{12}\ge 0.714\)). We use a symmetric classification for \(\hat{A}\textsubscript{12}< 0.5\).↩︎
FrenetiX is available on GitHub at https://github.com/TUM-AVS/Frenetix-Motion-Planner↩︎
Baidu Apollo is available on GitHub at https://github.com/ApolloAuto/apollo↩︎