Q2NSViz: An Open-source Standalone Visualizer for Quantum Network Simulations
July 14, 2026
Abstract
The unique and non-classical features of quantum networks make their simulation and intuitive understanding inherently difficult. In this work, we present Q2NSViz, an open-source Python-based visualization tool for replaying and inspecting quantum-network simulation traces. Q2NSViz reconstructs the time evolution of the simulated network state, including physical topology, stored and in-flight qubits, classical bits and packets, measurements, and entanglement relationships. In this way, it exposes not only physical connectivity, but also the dynamic entanglement-induced structure produced, consumed, and transformed by protocol execution. Q2NSViz is built around a decoupled JSON/NDJSON trace contract, a Qt-free replay engine, and an interactive PyQt6 interface, making it a standalone companion to Q2NS and reusable by other simulation backends that emit the same trace format. By turning execution traces into navigable and reproducible visual artifacts, Q2NSViz provides a zero-coding tool for researchers and educators, narrowing the gap between abstract protocol logic and concrete execution.
Quantum Network Visualization , Quantum Network Simulation , Q2NS , Quantum Internet
| Metadata | Description |
|---|---|
| Current code version | v0.1.0 |
| Permanent link to repository | github.com/QuantumInternet-it/q2nsviz |
| Permanent archive (DOI) | doi.org/10.5281/zenodo.21216676 |
| Legal code license | MIT |
| Code versioning system | git |
| Languages, tools, services | Python 3, PyQt6, Matplotlib, Q2NS |
| Compilation requirements, dependencies | Python \(\geq\)3.12, PyQt6 \(\geq\)6.6, Matplotlib \(\geq\)3.7 |
| Developer documentation | Repository README, Doxygen API, bundled example traces |
| Support email | angelasara.cacciapuoti@unina.it |
1 Motivation and Significance↩︎
Quantum networks differ from classical networks because their operation depends on distributed entanglement resources that are stateful and consumed by protocol execution. Entanglement induces a connectivity graph that may diverge from the physical network graph, and that evolves over time as protocols generate, transform, consume, or discard entangled states [1], [2]. Consequently, quantum-network simulations are difficult to interpret from topology or textual logs alone. A meaningful view of the execution must track both classical network events and quantum-state evolution, including the evolving entanglement structure [3], [4]. State-of-the-art quantum-network simulators such as Q2NS provide the execution substrate for these studies, enabling protocol modeling, performance evaluation, and analysis under different physical and architectural conditions [3], [5], [6]. Yet the output of such simulations often remains difficult to inspect: the relevant dynamics are distributed across low-level logs, diagnostics, and trace files. In particular, the entanglement structure produced by the protocol is not directly visible in the raw output, even though it is central to understanding the simulated execution.
In this work, we present Q2NSViz, an open-source standalone Python tool for replaying and inspecting quantum-network traces. Q2NSViz reconstructs a time-resolved view of the simulated execution, combining the physical topology with the evolving quantum states, classical communication, measurements, and entanglement-induced connectivity. It is designed as a coding-free tool for researchers and educators, and reworks the browser-based visualizer introduced with Q2NS into a standalone Python application [3].
Although Q2NS is the reference producer, Q2NSViz relies on a decoupled JSON trace contract: any simulator or script emitting the same format can generate traces that Q2NSViz can replay.
![Figure 1: Q2NSViz replay workflow. The simulator and viewer are decoupled through a typed NDJSON/JSON-array trace that feeds both the desktop application and the portable browser companion shipped with Q2NS [3]. The parser and state-management routines (logic.py) are Qt-free, exposing a programmatic API independent of the GUI.](/article/2607.12444/figures/fig-1.png "fig:")
2 Software Description↩︎
Q2NSViz is organized as a trace-driven replay workflow rather than as a monolithic visualizer. Fig. 1 illustrates the architecture and its core concepts: a decoupled JSON/NDJSON trace format, which acts as the contract between simulator and viewer; a Qt-free replay engine, which parses the trace and reconstructs the simulated state; and a PyQt6 desktop interface, which renders the reconstructed state through interactive views. Keeping the replay logic independent of the frontend lets traces from Q2NS, or from any compatible producer, be inspected through the same execution path.
The replay workflow proceeds from the trace file to the Replay Engine, then through the QuantumVisualizerWindow controller, and finally to the Visualization Interface. Inside the Replay Engine, the EventFileParser parses the
JSON/NDJSON events, while the SimulationStateManager builds the timeline and exposes the simulated network state at any requested time. The controller queries this state through snapshot_at(t) and dispatches it to the network
canvas, information panel, and plots.
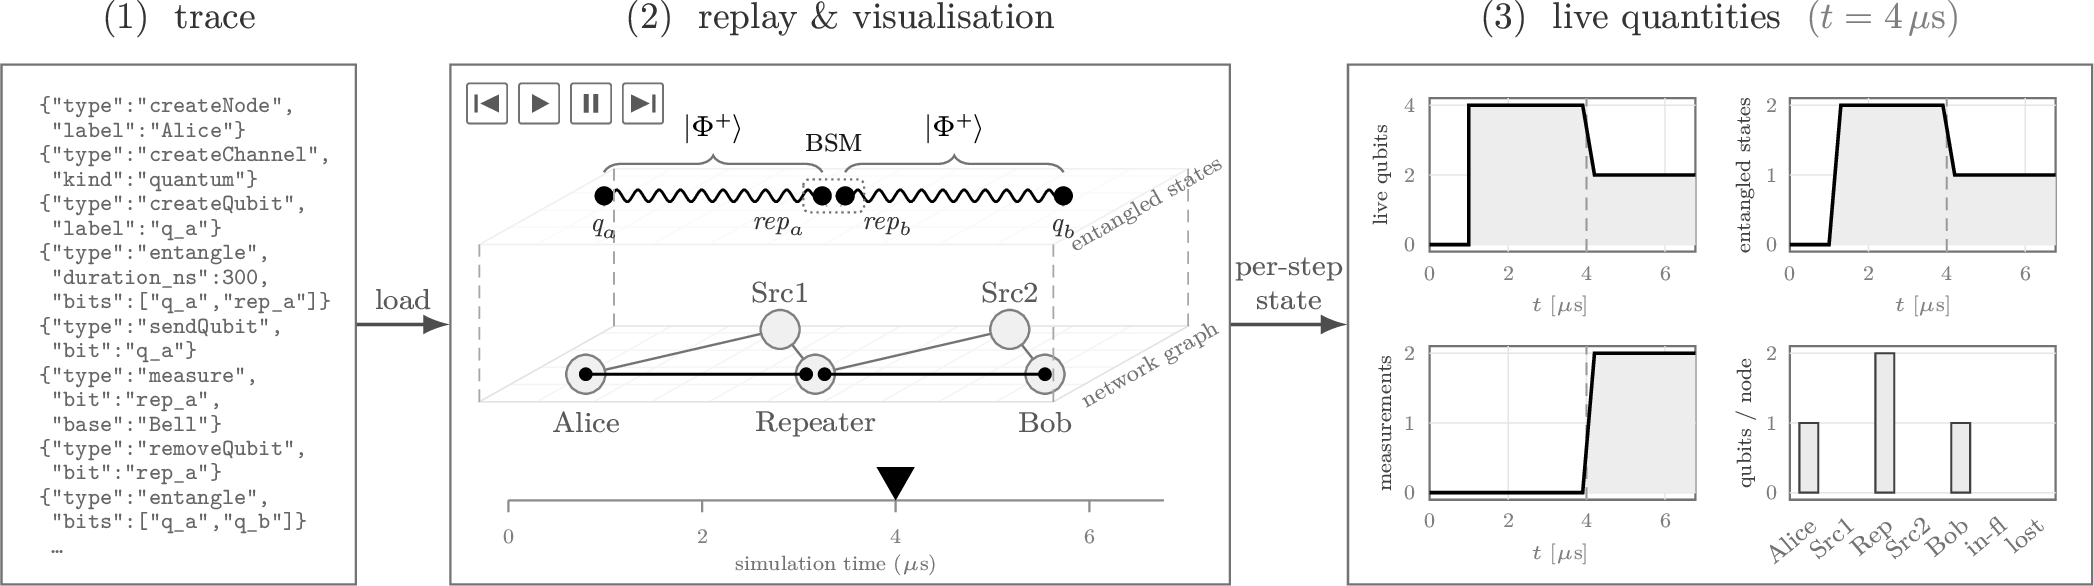
Fig. 2 shows this workflow with a logical view from end-to-end on a repeater-swap trace: the NDJSON events (1) are replayed into the physical and entanglement-graph views (2), together with the live-quantity plots (3). At \(t\approx4\,\mu\)s, the swap is mid-flight: the repeater still holds one memory qubit from each Bell pair \(\ket{\Phi^+}\), and the Bell-state measurement that transfers the entanglement to the end qubits \(q_a\) and \(q_b\) is in progress.
The main entities involved in the replay workflow are:
EventFileParser: ingests the trace file and parses its events into the structured representation.SimulationStateManager: builds a keyframe timeline of parsed events and replays them incrementally, against sparse checkpoints – thus scrubbing costs a checkpoint restore rather than a full re-replay – tracking qubits, cbits, and entanglement relations at any requested simulation time.QuantumVisualizerWindow: acts as the controller between replay engine and interface, advancing the clock in response toControlPanel(user) signals, queryingsnapshot_at(t), and pushing the resulting state to the visualization components.Views: render the current state through the network canvas and the tabbed information panel, including event logs, statistics, entanglement-state views, and charts.
Transport controls (play/step/scrub/speed) let users navigate the timeline and observe the network’s evolution. The network canvas renders network nodes, stored and in-flight qubits and their color-coded state, channel types, and entanglement-induced connectivity. Entanglement is shown through an entanglement graph where qubits are vertices and their entanglement relationships are edges. This view exposes the entanglement connectivity structure and the effects of Bell-state measurements (BSM) and graph-state Pauli measurements via local complementation [3], [7]. Within the information panel, charts plot the number of live qubits, entangled states, and the cumulative measurements over time.
Q2NSViz currently supports thirteen trace event types, summarized in Table ¿tbl:tab:events?. Each type drives a specific update – adding or removing nodes and qubits, toggling edges in the entanglement graph, animating in-flight qubits
and packets, or appending a message to the event log. The entangle, measure and graphMeasure events also accept an optional duration_ns field that models the latency of a state transition
(e.g. unentangled to entangled or alive to measured), shown as a gating ring during the duration_ns window that precedes the event timestamp. On load, the engine also validates the trace, reporting out-of-order timestamps, dangling node and
qubit references. Because the replay engine is Qt-free, it can also be imported directly into a Python script. The graphical interface uses snapshot_at(t) for live views, while the plotting routines sweep it across the timeline to generate
charts.
| Event | Effect on the views |
|---|---|
| createNode | Node card placed on the canvas. |
| createChannel | Quantum or classical link drawn between two nodes. |
| createQubit | Qubit marker appears at its host node. |
| removeQubit | Qubit cleared from the graph, red \(\times\) if lost. |
| entangle | Toggles edge(s) among nodes on the entanglement graph. |
| measure | Bell/Pauli measurement: qubit greyed and removed. |
| graphMeasure | Graph-state \(X/Y/Z\) measurement via local complementation. |
| sendQubit | Qubit animated along the quantum channel over \([t_0,t_1]\). |
| createCbit | Classical-bit marker appears at its host node. |
| sendCbit | Classical-bit marker animated along the classical channel. |
| removeCbit | Classical bit cleared from its node. |
| sendPacket | Classical packet animated along the channel. |
| traceText | Message shown as overlay and in the event-log tab. |
Trace events by semantic category: , , , ,, and .} \end{table}
3 Impact Overview↩︎
Quantum-network simulators are becoming essential tools for studying protocol and network behavior, but their outputs often remain difficult to inspect without detailed knowledge of the simulator internals and debugging abilities. Q2NSViz turns finished simulation traces into portable, time-resolved visual artifacts: any Q2NS run can be archived, replayed, shared, and re-examined as a self-contained file. Users can scrub to the exact instant a protocol misbehaves – an entanglement edge that never forms, a qubit lost in flight, a late correction – rather than reconstructing it from interleaved log lines. Q2NSViz also lowers the knowledge barrier. Together with Q2NS, it ships with example traces covering from basic to advanced quantum communications scenarios, such as from teleportation to graph-state manipulation and transmission over a lossy channel. Users can load any of these traces without writing code and observe how the protocol events modify qubits, classical information, measurements, and entanglement-induced connectivity over time. This makes the tool useful for debugging, education, and demonstrations.
Q2NSViz also embeds non-trivial entanglement manipulation primitives: entanglement created and consumed, swapped across repeaters, and reshaped by local measurements. Because the visualization is driven by a trace contract rather than by Q2NS internals, the same workflow can be reused by any compatible simulator or script, adding a reproducible visual layer for comparing protocol behavior across scenarios and future Q2NS releases.
4 Conclusions↩︎
This article presented Q2NSViz, an open-source standalone tool for replaying and inspecting quantum-network simulation traces. By combining a documented trace format, a Qt-free replay engine, and an interactive Python/PyQt6 interface, Q2NSViz turns simulator output into a time-resolved, navigable, and reproducible representation of quantum-network execution. It therefore complements Q2NS not only as a visual frontend, but as a software layer for inspecting, sharing, and comparing protocol dynamics [3], [4], [7]. By converting finished traces into navigable, shareable artifacts, Q2NSViz strengthens the experimental workflow around quantum-network simulation and provides a reusable basis for future Q2NS releases and compatible simulation backends.
CRediT authorship contribution statement↩︎
F.M: Writing – review, editing, original draft, Visualization, Validation, Software, Investigation, Data curation. M.C: Writing – review & editing, Supervision, Methodology. A.S.C: Writing – review & editing, original draft, Supervision, Project administration, Methodology, Funding acquisition, Conceptualization.
Declaration of competing interest↩︎
The authors declare that they have no known competing financial interests or personal relationships that could have appeared to influence the work reported in this paper.
Data availability↩︎
Q2NSViz, as Q2NS, is openly available on GitHub and archived on Zenodo according to the code metadata.