Causal Supervision of Attention for Affective Behaviour Analysis
July 13, 2026
Abstract
Affective Behaviour Analysis aims to enable machines to infer human affective states from behavioural signals, particularly facial expressions, in real-world environments. The 11th Affective Behaviour Analysis in-the-wild Competition includes the Multi-Task Learning Challenge based on the s-Aff-Wild2 database, where participants develop a unified framework for Valence-Arousal Estimation, Expression Recognition, and Action Unit Detection. This is challenging because emotion-related cues must be distinguished from spurious factors such as identity, illumination, pose, and demographic variation. Attention mechanisms are well suited as they aggregate information from the most informative facial regions, but may still exploit dataset-specific correlations instead of true affective cues. To improve generalization, we propose an attention pooling framework that promotes subject-invariant attention while increasing feature expressiveness. Our method consists of three components. First, we introduce causal supervision to enforce attention on facial regions with invariant predictive value across subjects. Second, we apply a cross-covariance independence regularization between Key (K) and Value (V) projections to encourage complementary, non-redundant representations. Finally, we replace the linear Value projection with a gated nonlinear SwiGLU transformation to increase feature expressiveness and capture finer-grained affective cues. Our method achieves \(CCC_{VA}=0.5123\) for VA estimation on the official validation set, together with \(F1_{EX}=0.3116\) and \(F1_{AU}=0.3974\) for expression recognition and action unit detection, respectively, resulting in an overall \(P\) score (the sum of the individual task metrics) of \(1.2214\).
1 Introduction↩︎
Affective computing [1] aims to develop intelligent systems capable of perceiving, interpreting, and responding to human emotional states by leveraging behavioural signals such as facial expressions, speech, text, and physiological measurements. Learning robust affective representations from these multimodal cues enables more natural human-computer interactions across applications including education [2], healthcare [3], [4], and robotics [5], [6].
Affective analysis is commonly studied through three complementary emotion models, the Ekman categorical model [7], [8], the Russell circumplex model [9], [10], and the Facial Action Coding System (FACS) [11]. To jointly exploit these perspectives, the Affective Behaviour Analysis in-the-wild (ABAW) Competition introduces the Multi-Task Learning (MTL) Challenge based on the Aff-Wild2 dataset [12]–[29], requiring models to simultaneously solve multiple affective tasks while learning shared and task-specific representations.
Despite significant progress, affective behaviour analysis remains challenging as emotions are subjective, dynamic, and context-dependent. In unconstrained settings, facial affect is confounded by factors such as identity, pose, illumination, age, and environment, which are often spuriously correlated with emotion labels. Consequently, deep models may exploit these correlations instead of learning emotion-relevant cues, leading to poor generalisation to unseen subjects.
Addressing this challenge requires representations that capture emotion while remaining invariant to confounding factors such as identity, pose, and illumination. Motivated by causal representation learning, which aims to disentangle causal factors from spurious correlations [30], we propose a causally inspired attention pooling framework that improves both the selection and representation of affective cues. Specifically, the framework emphasizes attention elements that are both invariant and predictive of emotion. It also increases representational capacity by reducing redundancy between the Key (K) and Value (V) representations, enabling a larger fraction of their capacity to be devoted to distinct, task-relevant information. As illustrated in Fig. 1, the framework consists of three components. First, we incorporate causal supervision into attentive patch aggregation to guide attention toward facial regions with invariant predictive value. Second, we introduce a cross-covariance independence regularization between the K and V representations to encourage complementary, rather than redundant, feature encoding. Third, we replace the conventional linear V projection with a SwiGLU-based [31] nonlinear component to increase representational capacity and better model fine-grained affective cues (see Fig. 1 (a)). Together, these components produce more robust and expressive affective representations.
Extensive experiments and ablation studies on the s-Aff-Wild2 dataset demonstrate consistent improvements of our method over standard attention pooling. Under a five-fold cross-evaluation protocol, the proposed method increases the mean multitask score \(P\) (defined as the sum of the task-specific metrics for valence-arousal estimation, expression recognition, and action unit detection) from \(0.8730\) to \(0.9569\) with the DINOv2 [32] visual encoder and from \(1.0524\) to \(1.1948\) with the FRoundation [33] encoder.

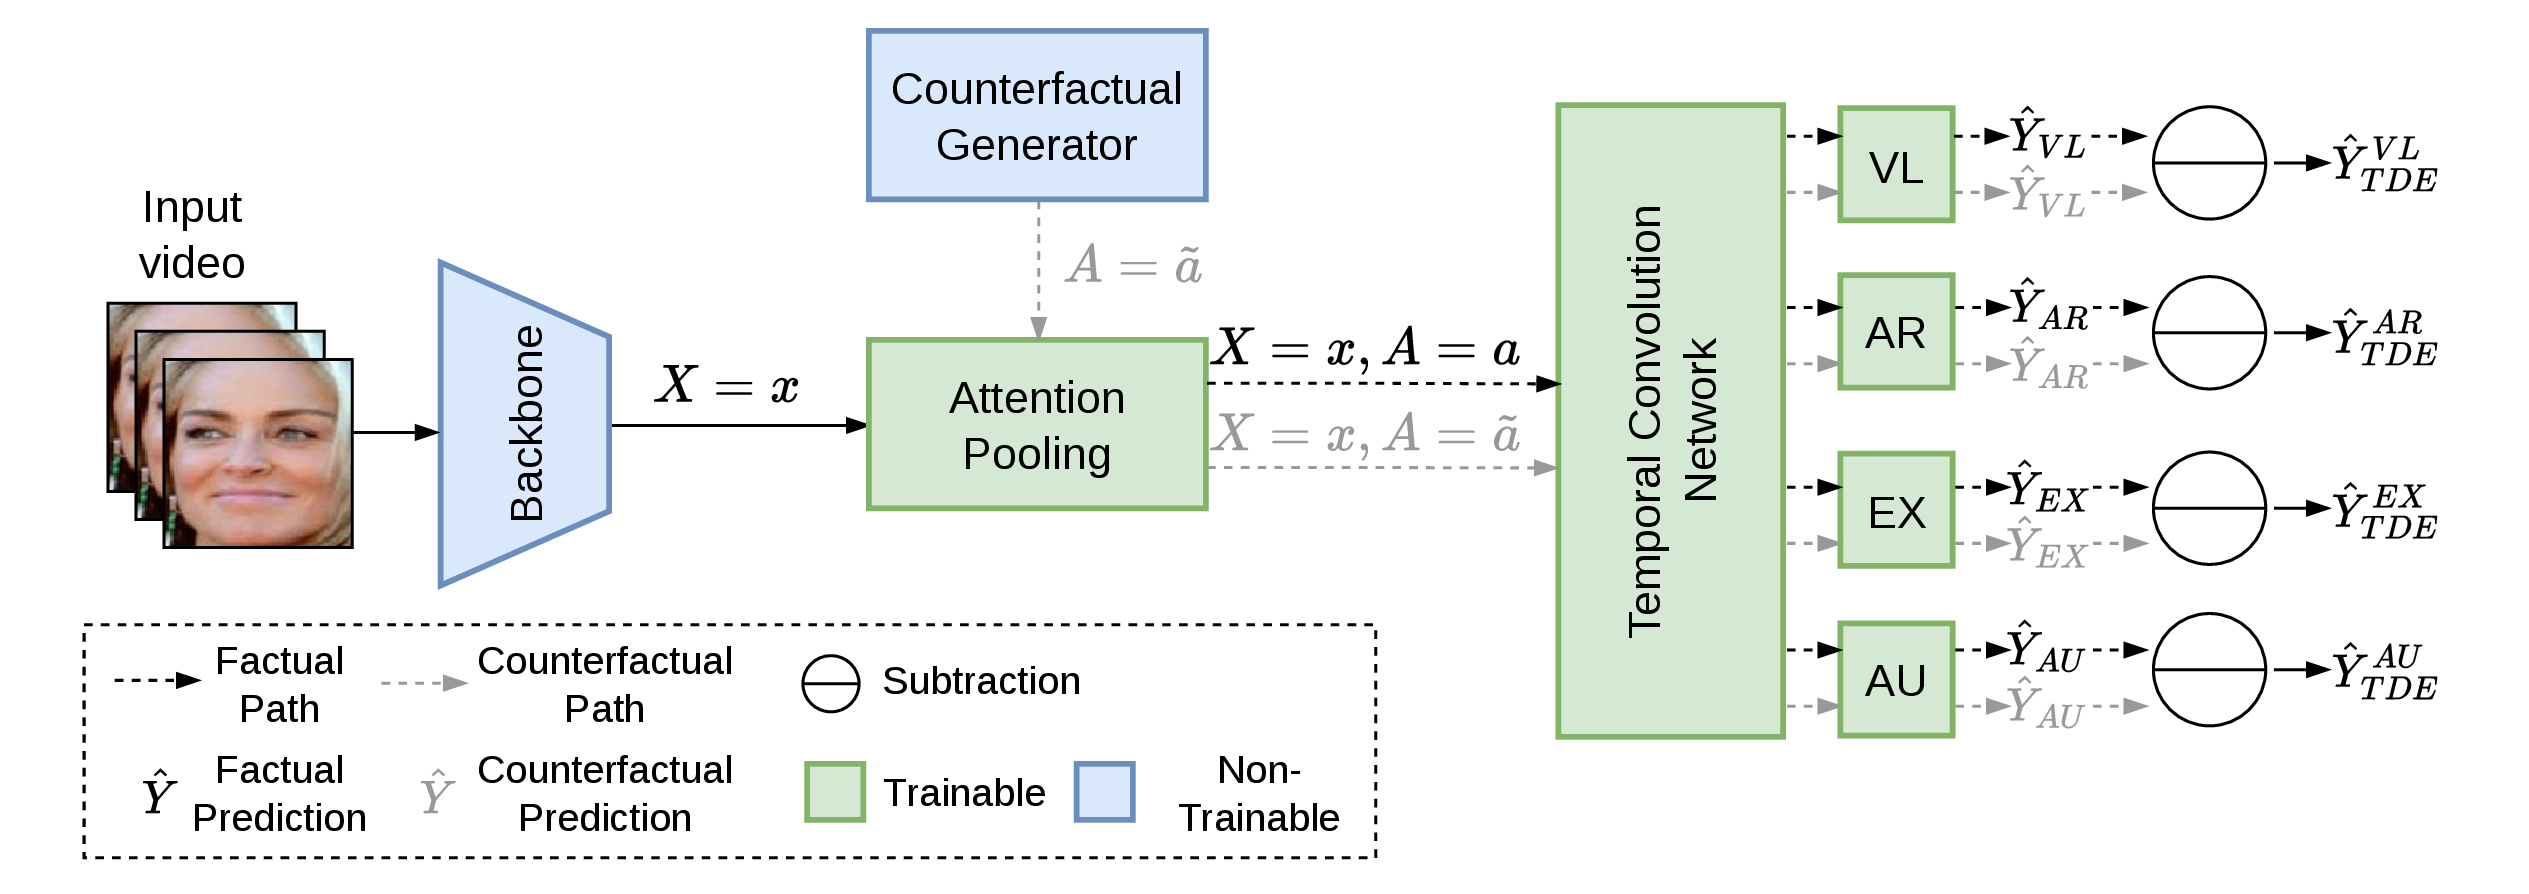
Figure 1: Detailed overview of the proposed framework. (a) Our proposed approach, which augments the baseline with three modifications: counterfactual attention supervision, cross-covariance regularization of the K and V representations, and a nonlinear SwiGLU V projection in place of the standard linear projection. All proposed modifications are highlighted in red. (b) Overview of the multi-task affect estimation framework. Feature representations are first extracted using a frozen backbone. Factual samples (dashed black arrows) and counterfactual samples (dashed grey arrows) are then generated and processed by a temporal encoder, followed by task-specific prediction heads for affect estimation. Finally Total Direct Effect is calculated per task..
2 Method↩︎
Figure 1 (b) provides an overview of the proposed framework. Starting from attentive feature aggregation, we introduce three modifications to improve the robustness and representational capacity of learned affective features: 1) causally motivated supervision that guides attention towards subject-invariant, emotion-relevant facial regions; 2) a cross-covariance independence regularization between the K and V representations to encourage complementary feature encoding; and 3) a SwiGLU-based [31] nonlinear Value projection that increases representational capacity (see Fig. 1 (a)).
The overall framework consists of four stages. First, facial images are converted into patch embeddings using a frozen pre-trained ViT backbone. Second, the patch features are aggregated using cross-attention pooling with a learnable query vector following [34], augmented with the proposed causal supervision and K-V independence regularization. Third, the resulting frame-level representations are modelled temporally using a TCN [35]. Finally, task-specific regression and classification heads produce predictions for the affective analysis tasks. The remainder of this section describes each component of the framework and the associated learning objectives.
2.1 Causal Supervision for Attention↩︎
To improve cross-subject robustness and further emphasize the most important and invariant regions for emotion recognition, we use the Causal Supervision for Attention (CSA) framework [36]. This framework introduces an explicit supervision signal based on causal inference. Given patch features \(X\), attention weights \(A\), and model predictions \(\hat{Y}\), CSA models how attention influences the final prediction and measures the contribution of attention by comparing predictions before and after modifying the attention weights. Specifically, the factual prediction is represented as \(\hat{Y}_{x,a}=\hat{Y}(X=\mathbf{x},A=\mathbf{a})\), while the counterfactual prediction is obtained by manually replacing the attention weights with counterfactual attention weights, \(\hat{Y}_{x,\tilde{a}}=\hat{Y}(X=\mathbf{x},\mathrm{do}(A=\mathbf{\tilde{a}}))\), where the \(\mathrm{do}(\cdot)\) operator [37] denotes an intervention that forces the attention to take the value \(\tilde{a}\) rather than the value it would naturally produce. This allows us to measure how the prediction changes when only the attention mechanism is altered (see Fig. 1 (a)). The difference between the learned attention weights and the counterfactual attention weights is measured using the Total Direct Effect (TDE) (see Fig. 1 (b)) [38],
\[\hat{Y}_\mathrm{TDE}=\hat{Y}_{x,a}-\hat{Y}_{x,\tilde{a}},\]
which captures the direct causal contribution of attention to the model output. CSA maximizes this effect during training by introducing the following auxiliary supervision objective
\[\mathcal{L}_{CSA}=\mathcal{L}(\hat{Y}_\mathrm{TDE},y) \label{eq:csa}\tag{1}\]
\(y\) is the ground-truth label, and \(\mathcal{L}\) is a generic loss function, as this method does not depend on any specific loss formulation.
Counterfactual generation. To generate counterfactual attention vectors, we sample a random vector from a standard Gaussian distribution and normalize it with a softmax operation so that its elements form a valid attention distribution, i.e., they sum to one [36]. Formally, \[\tilde{\mathbf{a}} = \operatorname{Softmax}(\mathbf{z}), \qquad \mathbf{z} \sim \mathcal{N}(\mathbf{0}, \mathbf{I}).\] The resulting counterfactual attention may range from poor (e.g., focusing on background regions) to informative (e.g., emphasizing discriminative facial regions). By maximizing the causal effect over diverse counterfactual attention maps, the model is encouraged to consistently identify causally relevant facial regions, leading to more robust attention.
2.2 Cross-Covariance Regularization↩︎
To encourage complementary Key and Value representations in scaled dot-product attention, we introduce a cross-covariance regularization loss (Fig. 1 (a)) inspired by [39], [40]. Given the Key and Value representations, \(\mathbf{K}\) and \(\mathbf{V}\), we first center them along the token dimension,
\[\overline{\mathbf{K}}=\mathbf{K}-\frac{1}{S}\sum_{s=1}^{S}\mathbf{K}_s, \qquad \overline{\mathbf{V}}=\mathbf{V}-\frac{1}{S}\sum_{s=1}^{S}\mathbf{V}_s,\]
where \(S\) is the number of tokens (or spatial locations). The cross-covariance and corresponding regularization loss are then
\[\mathbf{C}_{KV} = \frac{1}{S} \overline{\mathbf{K}}^{\top} \overline{\mathbf{V}}, \qquad \mathcal{L}_{\mathrm{cov}} = \left\| \mathbf{C}_{KV} \right\|_{F}^{2}. \label{eq:cov}\tag{2}\]
Minimizing \(\mathcal{L}_{\mathrm{cov}}\) reduces redundancy between the Key and Value feature spaces, encouraging complementary representations.
2.3 V projection↩︎
We replace the standard fully connected (linear) value projection with a SwiGLU layer [31], increasing its expressiveness so it can encode finer-grained affective cues before attention-based aggregation. Formally, \[\mathrm{SwiGLU}(\mathbf{x}) = \mathrm{SiLU}(\mathbf{x}\mathbf{W}_1 + \mathbf{b}_1) \odot (\mathbf{x}\mathbf{W}_2 + \mathbf{b}_2),\] where \(\odot\) denotes element-wise multiplication and \(\mathrm{SiLU}(z)=z\,\sigma(z)\) is the Sigmoid Linear Unit activation.
2.4 Training Objectives↩︎
We formulate the multi-task objective using task-specific losses for valence-arousal estimation, expression recognition, and action unit detection. For valence-arousal estimation, we optimize the concordance correlation coefficient (CCC) [41]. For expression recognition, we use Cross Entropy. For AU detection, we employ Binary Cross Entropy: \[\mathcal{L}_{AU}= BCE(\hat{y}_{au}, {y}_{au}),\] where \(y_{au}\) and \(\hat{y}_{au}\) represent the ground-truth and predicted AU labels. The joint task objective is defined as: \[\mathcal{L}_{Task}= \mathcal{L}_{AU} +\mathcal{L}_{EX} +\mathcal{L}_{VA}.\]
Additionally, we incorporate auxiliary supervision through the CSA loss: \[\mathcal{L}_{CSA}= \mathcal{L}_{CSA}^{AU} +\mathcal{L}_{CSA}^{EX} +\mathcal{L}_{CSA}^{VA},\] where each term corresponds to the CSA objective in Eq. 1 of the respective task, as well as cross-covariance regularization in Eq. 2 . The final optimization objective is: \[\mathcal{L}_{Overall}= \mathcal{L}_{Task} +\lambda_{CSA}\mathcal{L}_{CSA}++\lambda_{cov}\mathcal{L}_{cov}.\]
3 Experiments↩︎
To evaluate the effectiveness of our proposed framework, we conduct experiments using two backbones pre-trained on different datasets. The first backbone namely FRoundation [33] is specialised for this challenge and is pre-trained on facial images, while the second DINOv2 [32] is pre-trained on a general-purpose image corpus. We compare the performance of both backbones against the official baseline, which uses a pre-trained ConvNeXt [42] model with frozen convolutional weights and MixAugment [43] data augmentation, on the official validation set. To further assess the generalisability of our method, we perform additional experiments using 5-fold cross-validation. Finally, to investigate the contribution of each component within our framework, we conduct a comprehensive ablation study. The remainder of this section describes the dataset used in this study, the evaluation metrics, and the implementation details.
3.1 Dataset↩︎
For the MTL track, the organizers provide 142,382 training images and 26,876 validation images from the Aff-Wild2 dataset [41]. Continuous Valence and Arousal (VA) annotations are provided in the range \([-1, 1]\). Expression (EX) annotations consist of eight categories: Neutral, Anger, Disgust, Fear, Happiness, Sadness, Surprise, and Other. Action Unit (AU) annotations comprise 12 classes: AU1, AU2, AU4, AU6, AU7, AU10, AU12, AU15, AU23, AU24, AU25, and AU26. Following the removal of samples with invalid annotations (AU labels of \(-1\), VA labels of \(-5\), or EX labels of \(-1\)), the resulting training and validation sets contain 52,154 and 15,440 images, respectively.
3.2 Metrics↩︎
The performance measure \(P\) as specified by the ABAW MTL challenge is calculated by summing the following components: the mean CCC for valence and arousal, the average \(F_1\) Score across all eight expression categories \(F_{EX}\), and the average \(F_1\) Score across all 12 action units \(F_{AU}\). It is mathematically formulated as follows: \[P = \frac{CCC_{AR} + CCC_{VL}}{2} + F_{EX} + F_{AU}.\]
3.3 Implementation Details↩︎
Our method is implemented in PyTorch [44], all experiments are performed on a single NVIDIA RTX A6000 GPU using cropped and aligned facial images resized to \(224 \times 224\) [41]. For feature extraction, we utilize two models sharing a ViT-S architecture (\(16 \times 16\) patches, \(256\) tokens, \(384\) embedding dimensions): FRoundation [33], trained on WebFace4M [45] with the ArcFace loss [46], and DINOv2 [32], pre-trained on the general LVD-142M dataset. The TCN module consists of 3 layers with a kernel size of 5. The attention head size is 64, while the number of heads matches the backbone output dimension. Training uses the AdamW optimizer [47] with a batch size of 8, an initial learning rate of \(8\times10^{-5}\), linear warmup for the first 10% of steps, and a cosine annealing schedule. Models are trained for 15 epochs with early stopping (patience of 5) monitored on a random validation split comprising 15% of the training data rather than the official validation set.
4 Results↩︎
Comparison with the official baseline. A comparison between our method and the official baseline can be found in Table 1. The baseline reports the overall challenge score \(P=0.45\) (row 11), whereas both variants of our method achieve substantially higher scores, reaching \(P=0.9658\) (row 1) with the DINOv2 backbone and \(P=1.2214\) (row 6) with the FRoundation backbone. Among the two configurations, FRoundation achieves the best overall performance, particularly for VA estimation and expression recognition.
| Backbone | Fold | \(CCC_{VL}\) | \(CCC_{AR}\) | \(CCC_{VA}\) | \(F1_{EX}\) | \(F1_{AU}\) | \(P\) |
|---|---|---|---|---|---|---|---|
| DINOv2 | 1 | 0.3683 | 0.2663 | 0.3173 | 0.2504 | 0.3982 | 0.9658 |
| 2 | 0.3726 | 0.3466 | 0.3596 | 0.2497 | 0.3849 | 0.9942 | |
| 3 | 0.2029 | 0.2906 | 0.2468 | 0.1919 | 0.3688 | 0.8074 | |
| 4 | 0.1748 | 0.4352 | 0.3050 | 0.2162 | 0.3696 | 0.8907 | |
| 5 | 0.2712 | 0.5597 | 0.4155 | 0.2816 | 0.4294 | 1.1264 | |
| FRoundation | 1 | 0.5299 | 0.4947 | 0.5123 | 0.3116 | 0.3974 | 1.2214 |
| 2 | 0.4726 | 0.3058 | 0.3892 | 0.3044 | 0.3758 | 1.0694 | |
| 3 | 0.5565 | 0.3952 | 0.4758 | 0.2974 | 0.3989 | 1.1722 | |
| 4 | 0.5165 | 0.3697 | 0.4431 | 0.3129 | 0.3694 | 1.1254 | |
| 5 | 0.6008 | 0.6797 | 0.6403 | 0.3063 | 0.4392 | 1.3858 | |
| ConvNeXt | 1 | - | - | - | - | - | 0.45 |
Five-fold cross-validation. Table 1 presents the results of the five-fold cross-validation, where Fold 1 corresponds to the official validation split. Across all five folds, the FRoundation backbone consistently outperforms DINOv2 in terms of the overall score. The largest improvements are observed for VA estimation, where FRoundation consistently yields higher CCC values for both valence and arousal, resulting in substantially higher combined \(CCC_{VA}\) across all folds. Performance on expression recognition is also consistently improved, with FRoundation achieving higher \(F1_{EX}\) on every fold. In contrast, action unit detection performance remains comparable between the two backbones, with small variations across folds.
| Backbone | SwiGLU | CSA | Cov | \(P\) | |||
|---|---|---|---|---|---|---|---|
| DINOv2 | \(\times\) | \(\times\) | \(\times\) | 0.8730±0.0735 | |||
| \(✔\) | \(\times\) | \(\times\) | 0.8616±0.0972 | ||||
| \(✔\) | \(✔\) | \(\times\) | 0.9036±0.0836 | ||||
| \(✔\) | \(\times\) | \(✔\) | 0.9317±0.1621 | ||||
| \(✔\) | \(✔\) | \(✔\) | 0.9569±0.1193 | ||||
| FRoundation | \(\times\) | \(\times\) | \(\times\) | 1.0524±0.0694 | |||
| \(✔\) | \(\times\) | \(\times\) | 1.1265±0.1275 | ||||
| \(✔\) | \(✔\) | \(\times\) | 1.1555±0.0809 | ||||
| \(✔\) | \(\times\) | \(✔\) | 1.1588±0.1533 | ||||
| \(✔\) | \(✔\) | \(✔\) | 1.1948±0.1207 |
Ablation study. Table 2 presents an ablation study of the proposed framework. Results are reported as the mean and standard deviation of \(P\) over five-fold cross-validation; for clarity, only the composite score is shown. The baseline configuration (linear Value projection without causal supervision or covariance regularization) achieves \(0.8730 \pm 0.0735\) (row 1) and \(1.0524 \pm 0.0694\) (row 6) for the DINOv2 and FRoundation backbones, respectively. Adding SwiGLU alone slightly reduces performance for DINOv2 (row 2) but improves FRoundation (row 7). In contrast, combining SwiGLU with either causal supervision (rows 3 and 8) or covariance regularization (rows 4 and 9) consistently improves performance over the corresponding baselines. The full model achieves the best results on both backbones, reaching \(0.9569 \pm 0.1193\) (row 5) with DINOv2 and \(1.1948 \pm 0.1207\) (row 10) with FRoundation, corresponding to gains of 9.6% and 13.5%, respectively, over the baseline. Overall, the results show that each proposed component contributes to performance, while their combination yields the largest and most consistent improvements across both backbones.
References↩︎
Equal contribution↩︎