Did We Actually Fix It? An Independent Adversarial Stress-Test of Post-Point-Adjustment Evaluation Metrics for Time-Series Anomaly Detection
July 12, 2026
Abstract
Point-adjustment (PA), for years the default scoring protocol in time-series anomaly detection (TSAD), was shown by Kim et al. (2022) to award near-perfect F1 to random anomaly scores. The field responded by adopting a suite of replacement metrics: PA%K, range-based precision/recall, affiliation precision/recall, and Volume-Under-the-Surface (VUS) ROC/PR. We ask whether the fix actually worked. Every robustness check on these replacements to date has been run by the metric’s own proposer or a successor, or is confined to theory and random-oracle vignettes; no independent, adversarial, SOTA-relative audit on real benchmarks exists. We provide one. We stress-test 12 adopted metrics against a battery of trivial and adversarial no-skill score generators, from i.i.d. noise to a parametric near-miss sweep, on the 250-series UCR Anomaly Archive (our primary benchmark) and, in replication, five further benchmarks (SMD, SMAP, MSL, NAB, PSM), under a pre-registered SOTA-relative gameability criterion (a metric is gamed on a series if a no-skill generator reaches ≥90% of the best real detector’s score) and a frozen ROBUST/FRAGILE/GAMEABLE ladder. The fix is only partial. On UCR, five of eleven replacement metrics are GAMEABLE (a no-skill detector reaches ≥90% of a real detector’s score on ≥25% of series), including affiliation-F1 (gamed on 99% of series) and every ROC-based metric tested (VUS-ROC, range-AUC-ROC, point-AUC-ROC, all roughly 62–64%). This gaming is genuine, not a weak-reference artifact: on the series they game, the real detectors score 0.97–1.00. The resistant survivors are the PR-based metrics and PA%K (all FRAGILE, 14–18%), and they stay robust even at a fixed decision threshold, with one telling exception, range-AUC-PR, whose GAMEABLE label we trace to a degenerate reference. A decisive split: VUS-ROC is gamed on 119 series where its sibling VUS-PR is not, and the reverse on none (McNemar p < 10⁻³⁵). A forgiveness-frontier sweep ranks metrics by spatial tolerance: affiliation forgives a detector misplaced by 4× the median anomaly length, the ROC metrics 2×, all others 0.5×. Metrics largely agree on detector rankings (mean Kendall τ 0.68; the disagreement rate does not significantly exceed our pre-registered threshold). The audit replicates across the five further benchmarks: the ROC-over-PR direction is one-directional on every one and never reverses (McNemar-decisive on four), so the split is not a UCR artifact. The absolute gameability rate, though, is benchmark-dependent (severe on UCR/SMAP/MSL/NAB, largely absent on SMD, where the real detectors themselves score highest), and no single metric stays in the safe tier on all six: even VUS-PR is GAMEABLE on NAB. We release a pip-installable stress-test harness with all metric implementations vendored at frozen commits, and a metric-selection decision protocol. Our results reopen the trustworthiness of ROC- and affiliation-based TSAD evaluation while supporting a shift toward PR-based scoring as the least-gameable class (VUS-PR foremost), with the caveat that no metric is universally safe: prefer a PR-based metric or PA%K, but verify per benchmark rather than assuming robustness.
1 Introduction↩︎
Time-series anomaly detection underpins monitoring in web services, spacecraft telemetry, industrial control, and finance. For most of the deep-learning era its progress was measured by the point-adjustment (PA) protocol of Xu et al. (2018): if a detector flags any point inside a ground-truth anomaly segment, the entire segment is credited as detected before F1 is computed. Kim et al. (2022) demonstrated that PA is catastrophically permissive: a random anomaly score achieves state-of-the-art (SOTA) PA-F1, and the result reshaped the field. Subsequent work migrated to a suite of replacement metrics designed to be robust: PA%K (Kim et al. 2022), range-based precision/recall (Tatbul et al. 2018), affiliation precision/recall (Huet et al. 2022), and Volume-Under-the-Surface (VUS) ROC/PR with its range-AUC precursors (Paparrizos et al. 2022). These are now the reporting standard: the recent TSB-AD benchmark (Liu & Paparrizos 2024) recommends VUS-PR as its headline.
But did the fix work? A replacement metric is only an improvement if it is not itself gameable: if a detector with no genuine localization ability cannot reach the scores of real detectors under it. The evidence that these metrics are robust comes almost entirely from the metrics’ own authors. Kim et al. validate PA%K; Huet et al. validate affiliation; Paparrizos et al. validate VUS; SimAD (Zhong et al. 2024), which reports the disquieting fact that a random detector reaches affiliation-F1 ≈ 0.7, is itself proposing a new metric (UAff/NAff). The genuinely independent critiques in the literature target PA itself and dataset quality, not the replacement metrics adversarially, on real data, relative to SOTA. The obvious question has not been asked: do the replacements survive an independent adversarial audit on real benchmarks?
We ask it. Our contributions:
The first independent, adversarial, SOTA-relative audit of the post-PA TSAD metric suite on real benchmarks. We stress-test 12 adopted metrics against a battery of trivial/adversarial no-skill generators on the UCR Anomaly Archive (primary) and five further benchmarks (SMD, SMAP, MSL, NAB, PSM), under a pre-registered gameability criterion and a frozen robustness ladder. Every metric is computed by its authors’ own code, vendored at a frozen commit; the audit is pre-registered (OSF, before any real value was computed) to preclude HARKing (hypothesizing after results are known).
A new measurement instrument, the forgiveness frontier: a metric-of-metrics. Beyond binary gameability, we introduce a diagnostic that quantifies a metric’s leniency in interpretable units: sweeping a near-miss detector (ground truth shifted/blurred by a controlled amount, in units of the anomaly length), we measure how much temporal misplacement each metric forgives before a zero-localization detector matches SOTA. This turns “is it gameable” into a continuous, comparable leniency coordinate, and is a reusable methodology for auditing any localization metric.
An inter-metric rank-agreement analysis quantifying whether the choice of metric, rather than detector quality, reorders leaderboards (Kendall τ over a real-detector pool).
A released, reproducible artifact: a pip-installable stress-test harness (frozen-commit metric vendors, one-command reproduction) and a metric-selection decision protocol.
Our headline (pre-registered Branch B2, a mixed trust map): the post-PA fix is only partial: affiliation-F1 and every ROC-based metric tested remain gameable by no-skill detectors on the majority of UCR series (a pattern that replicates in direction across five further benchmarks, though its magnitude is benchmark-dependent), while the PR-based metrics and PA%K are the more robust survivors, none of them safe on every benchmark (§5.5). We frame all outcomes in advance (Section 3.6): whether the audit finds widespread gameability, a mixed trust map, or an independently earned “the fix worked” certificate, the result informs how the field should score its detectors.
2 Related work and the independence gap↩︎
The protocol under critique. PA originates with Xu et al. (2018). Kim et al. (2022) showed random scores reach SOTA under it and proposed PA%K (adjust a segment only if ≥K% of it is detected). Independent critiques of PA and of benchmark quality followed: Sehili & Zhang (2023), Garg et al. (2022), Sarfraz et al. (2024, ICML), Wagner et al. (2023, TimeSeAD), Rewicki et al. (2023); but these attack PA and the datasets, not the replacement metrics.
The replacement metrics. Range-based P/R (Tatbul et al. 2018), affiliation P/R (Huet et al. 2022), and VUS-ROC/PR (Paparrizos et al. 2022) were each introduced with the authors’ own robustness arguments. PATE (Ghorbani et al. 2024), eTaPR (Hwang et al. 2022), Balanced-PA (Bhattacharya et al. 2024), and LARM/ALARM (Wagner et al. 2025) extend the family.
Adjacent audits, and why the gap is real. Table 1 maps every adjacent critique on two axes: independence (is it run by the metric’s proposer/successor?) and adversarial-SOTA-relative-on-real-data (does it deliberately feed trivial detectors and compare to SOTA on real benchmarks?). The disquieting “affiliation-F1 ≈ 0.7 on random” fact lives only in proposer-run papers (SimAD, and Yang et al. 2025 whose lead author co-authored SimAD). No cell in Table 1 occupies the independent × adversarial × SOTA-relative × real-benchmarks corner. That corner is this paper.
The critical column is Target: whether the work adversarially audits the post-PA replacement metrics themselves (as opposed to point-adjustment or dataset quality). No prior work is simultaneously independent AND targets the replacements AND adversarial + SOTA-relative.
Table 1: Audit-independence map. “Targets replacements” = adversarially audits the post-PA replacement metrics themselves (“own” = the authors’ own metric; ✗ rows target point-adjustment or dataset quality instead); “Indep.” = not run by the metric’s proposer or a successor; “Adversarial” = deliberately feeds trivial/no-skill detectors; “Real data” = real benchmarks; “SOTA-rel.” = compares no-skill to SOTA. ~ = partial.
| Work | Targets replacements | Indep. | Adversarial | Real data | SOTA-rel. |
|---|---|---|---|---|---|
| Kim et al. 2022 (PA%K) | ✓ (own) | ✗ | ✓ | ✓ | ✓ |
| Huet et al. 2022 (affiliation) | ✓ (own) | ✗ | ✗ | ✓ | ✗ |
| Paparrizos et al. 2022 (VUS) | ✓ (own) | ✗ | ~ | ✓ | ~ |
| Liu & Paparrizos 2024 (TSB-AD) | ✓ | ✗ | ✗ | ✓ | ✓ |
| Zhong et al. 2024 (SimAD) | ✓ | ✗ | ✓ | ✓ | ✓ |
| Yang et al. 2025 (taxonomy) | ✓ | ~ | ✓ | ✓ | ✓ |
| Sørbø & Ruocco 2024 (metric maze) | ✓ | ✓ | ~ | ~ | ~ |
| Sehili & Zhang 2023 | ✗ (PA/data) | ✓ | ✓ | ✓ | ✓ |
| Wagner et al. 2023 (TimeSeAD) | ✗ (protocol) | ✓ | ✗ | ✓ | ✓ |
| Garg et al. 2022 | ✗ (PA) | ✓ | ✗ | ✓ | ✓ |
| Sarfraz et al. 2024 (Quo Vadis) | ✗ (position) | ✓ | ~ | ✓ | ✓ |
| This work | ✓ | ✓ | ✓ | ✓ | ✓ |
Every fully-independent row (Sehili, TimeSeAD, Garg, Sarfraz) targets point-adjustment or dataset quality, not the replacement metrics; every row that adversarially and SOTA-relatively targets the replacements (Kim, SimAD, Yang) is proposer-run or proposer-conflicted. The nearest independent same-target work, Sørbø & Ruocco’s metric-maze taxonomy, is property-based, not adversarial and not SOTA-relative. Only the last row is all five. We add two further instruments unique to this work (a forgiveness frontier and inter-metric rank correlation), but these are contributions, not the basis of the independence claim. (~ = partial.)
Closest prior art. Yang et al. (2025, arXiv:2511.18739; November 2025, about eight months before this study) test metrics under random and oracle scenarios and already report that Point-Adjust and NAB have “limited resistance to random-score inflation.” We therefore do not claim primacy on the fact that no-skill scores inflate these metrics on real data: Yang shows it. Our distinct contribution is the combination Yang lacks: (i) strict non-proposer independence (Yang’s lead author co-authored SimAD, whose UAff/NAff proposal and affiliation critique it inherits, a conflict for the affiliation narrative specifically); (ii) an explicit SOTA-relative gameability criterion (does no-skill reach real detectors, not merely beat chance) with a pre-registered ladder; (iii) the forgiveness-frontier instrument; and (iv) a released, reproducible stress-test harness. Every use of “first” in this paper is bound to first independent, SOTA-relative audit, not first to observe inflation.
3 Method: an adversarial metric stress-test↩︎
3.1 Setup and notation↩︎
A benchmark series is a univariate signal with a binary ground-truth label vector \(y\) (1 = anomaly) containing contiguous anomaly segments. A detector emits a real-valued anomaly score \(s\) (higher = more anomalous). A metric \(M\) maps \((y, s)\) to \([0,1]\) (higher = better). Threshold-dependent metrics are reported as the best F1 over a 15-point quantile threshold sweep, the standard “best-F1” TSAD protocol and the adversarially correct choice for a gameability test (we grant each detector its best threshold).
3.2 Metrics under test↩︎
12 adopted metrics, each computed by its authors’ code at a frozen commit: PA-F1 (positive control), PA%K (K∈{0.2,0.5}), point-wise best-F1, point AUC-ROC/PR, range-based F1 (prts 1.0.0.3), affiliation F1 (Huet et al. code @8d84498), and VUS-ROC/PR + range-AUC-ROC/PR (TSB-UAD @313f0fd). Our native implementations of PA/PA%K/point metrics are unit-validated against a brute-force threshold sweep (exact agreement) and reproduce the published anchors (Section 4.1).
3.3 No-skill score generators↩︎
The adversary is a set of detectors with no genuine localization skill. Pure no-skill (no anomaly-location information, the headline class): i.i.d.-random; random-walk (autocorrelated but uninformative); constant (degenerate “all-anomalous”); single random-placed spike; periodic spike-train. Trivial-but-informed (reported separately, never in the pure-no-skill headline): a single spike placed inside the anomaly (a “finds one point” detector). Stochastic generators use R=10 Monte-Carlo replicates; the gameability statistic is the adversarial best (max over generators × replicates).
3.4 SOTA reference and the gameability criterion↩︎
For each (series, metric) the SOTA reference is the best value achieved by a pool of six real detectors: Matrix Profile (the canonical UCR-archive detector; Yeh et al. 2016), Isolation Forest (Liu et al. 2008) and LOF (Breunig et al. 2000) on sliding-window embeddings, PCA reconstruction error, k-nearest-neighbor distance, and an autoregressive-residual baseline. A metric is gamed on a series if the best no-skill generator reaches ≥90% of this SOTA reference. Every cell is also reported against the metric’s chance expectation (mean over i.i.d.-random replicates), so no conclusion depends on a possibly-weak in-house reference alone. Per-metric gameability rate = fraction of series gamed, with Jeffreys 95% CIs, classified on the frozen ladder: ROBUST ≤5% (and TOST-equivalent to chance; TOST = two one-sided tests), FRAGILE 5–25%, GAMEABLE ≥25%.
3.5 Forgiveness frontier and rank agreement↩︎
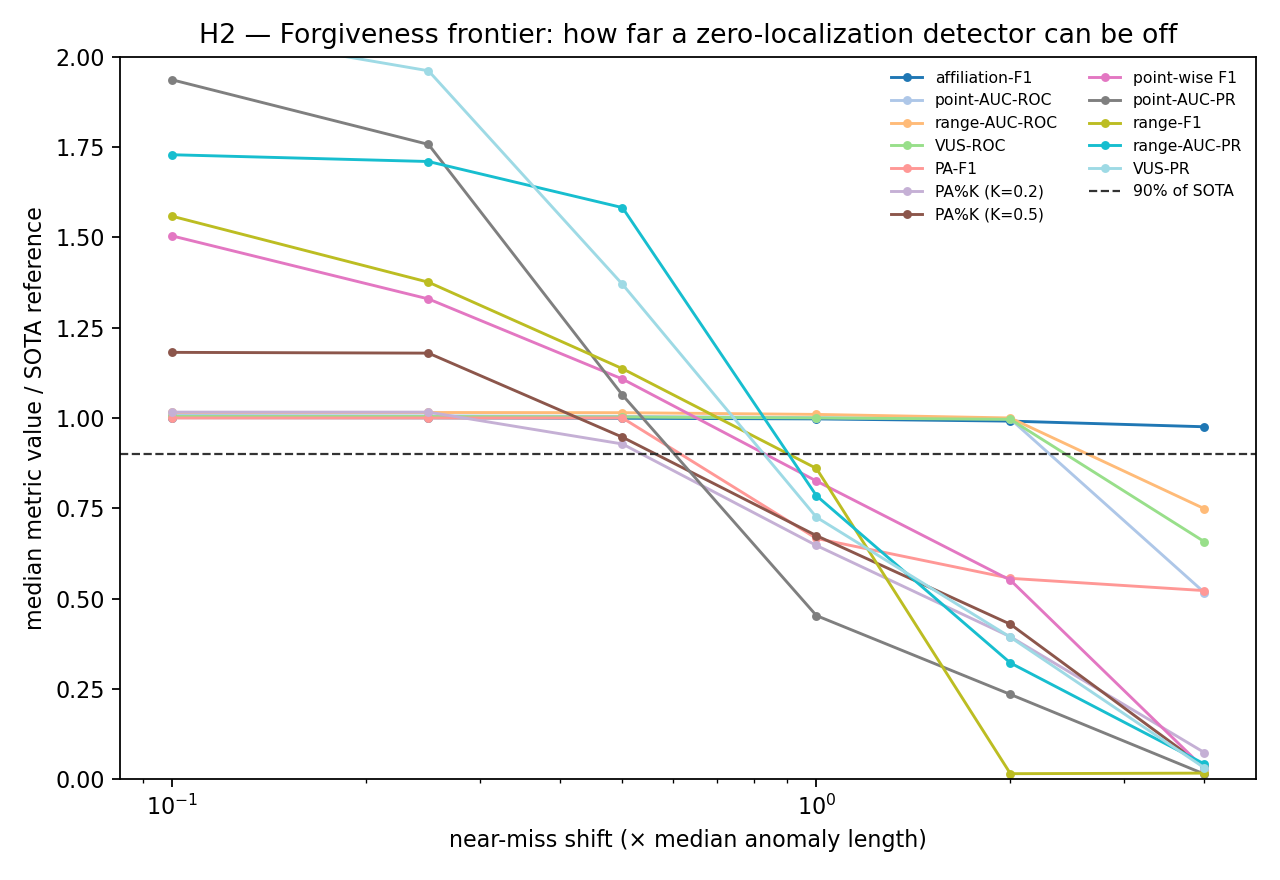
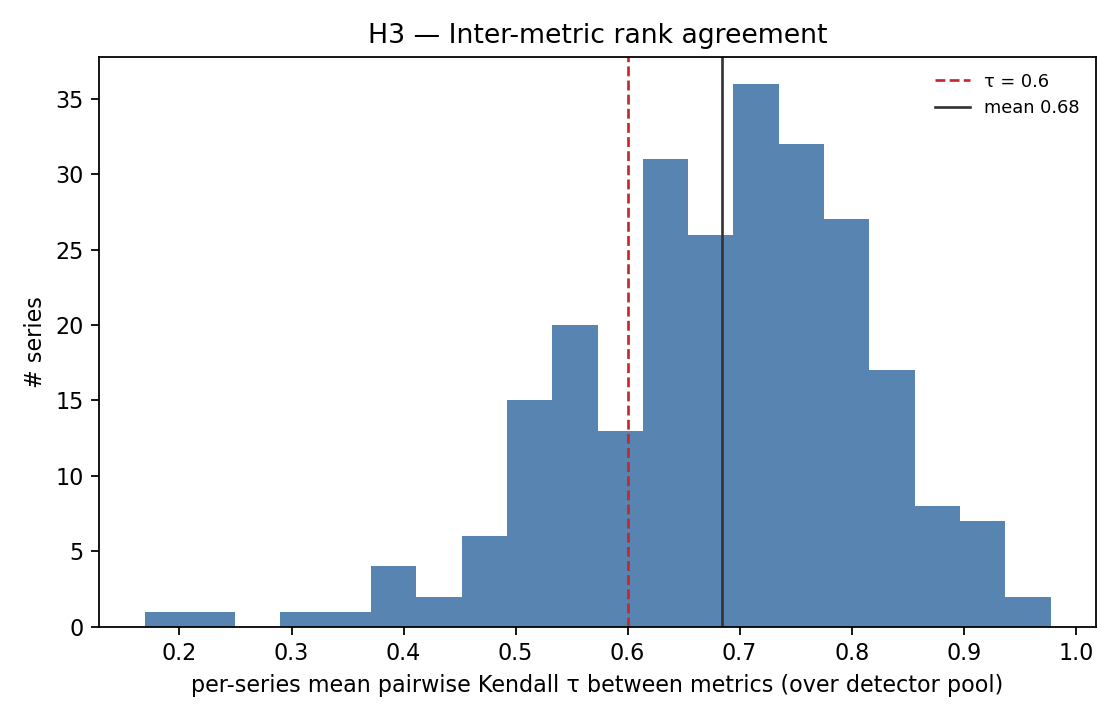
The near-miss instrument shifts (and optionally blurs) the ground truth by a controlled amount, swept over {0.1, 0.25, 0.5, 1, 2, 4} × the median anomaly length, producing a detector that localizes the anomaly but is temporally off. The forgiveness frontier of a metric is the largest shift at which this zero-localization detector still reaches ≥90% of SOTA (median across series). For rank agreement (H3) we compute, per series, the Kendall τ between metrics over the real-detector pool’s scores, and the fraction of series with τ<0.6 (metric choice reorders the leaderboard).
3.6 Pre-registered outcome branches (all publishable)↩︎
Fixed before any real value was computed: B1 ≥1 metric GAMEABLE (≥25%) → independent evidence that the fix is incomplete; B2 mixed (some FRAGILE) → the first quantitative trust map + which-metric-when protocol; B3 all ROBUST (+TOST) → an independently earned “the fix worked” certificate; B4 (orthogonal) low inter-metric τ → “metric choice, not detector quality, drives leaderboards.” The released artifacts are identical in every branch.
4 Experimental setup↩︎
4.1 Positive-control validation (harness correctness, before real data)↩︎
The harness reproduces the published anchors on synthetic ground truth (10/10 unit tests): best-PA-F1 of i.i.d.-random = 0.891 (reproducing Kim et al. 2022); point-AUC of random = 0.496 ≈ chance; best-affiliation-F1 of random = 0.681 (independently reproducing SimAD’s ≈0.7); VUS-ROC with buffer→1 equals point-AUC exactly, and its random-null rises monotonically with the buffer window (a characterized property, not an artifact); PA%K deflates random (0.90→0.28→0.18); an oracle detector scores VUS-ROC 0.994 ≫ random. This certifies that any gameability we report is a metric property, not a harness bug.
4.2 Data↩︎
Primary: UCR Anomaly Archive (Wu & Keogh 2021), 250 univariate series (verified: length median 30k, range 6.7k–900k; anomaly length median 101; prevalence median 0.34%), one anomaly per series by construction. Series longer than 40,000 points are cropped to a 40k window centered on the anomaly (a pre-registered, timing-driven cap retaining ample normal context); this bounds VUS cost without affecting the gameability question. Secondary (pre-registered; now reported in §5.5): SMD (Su et al. 2019; 28 series), SMAP/MSL (Hundman et al. 2018; 40/22), NAB (Lavin & Ahmad 2015; 52), and PSM (Abdulaal et al. 2021; a single train/test split → 1 series, used only qualitatively as it cannot support a rate), via TSB-AD mirrors. Median anomaly prevalence on these datasets ranges 2.1–10.0%, one to two orders of magnitude above UCR’s 0.34%, letting us test whether the findings survive outside UCR’s extreme low-prevalence, single-anomaly regime.
4.3 Configuration (frozen)↩︎
Length cap 40k; R=10 replicates; VUS threshold resolution 250; gameability fraction 0.90; near-miss shifts {0.1,…,4}×median anomaly length; seed 20260706. All locked in a frozen configuration file (released) before the grid ran.
5 Results↩︎
Results are over all 250 UCR Anomaly Archive series (ids 001–250, complete; one byte-identical duplicate file deduplicated). All gameability figures use the PURE no-skill pool (no anomaly-location information); the oracle-inclusive rate (adding the single-spike-inside-anomaly detector) is reported alongside as an upper reference.

5.1 H1: Gameability of the post-PA metrics↩︎
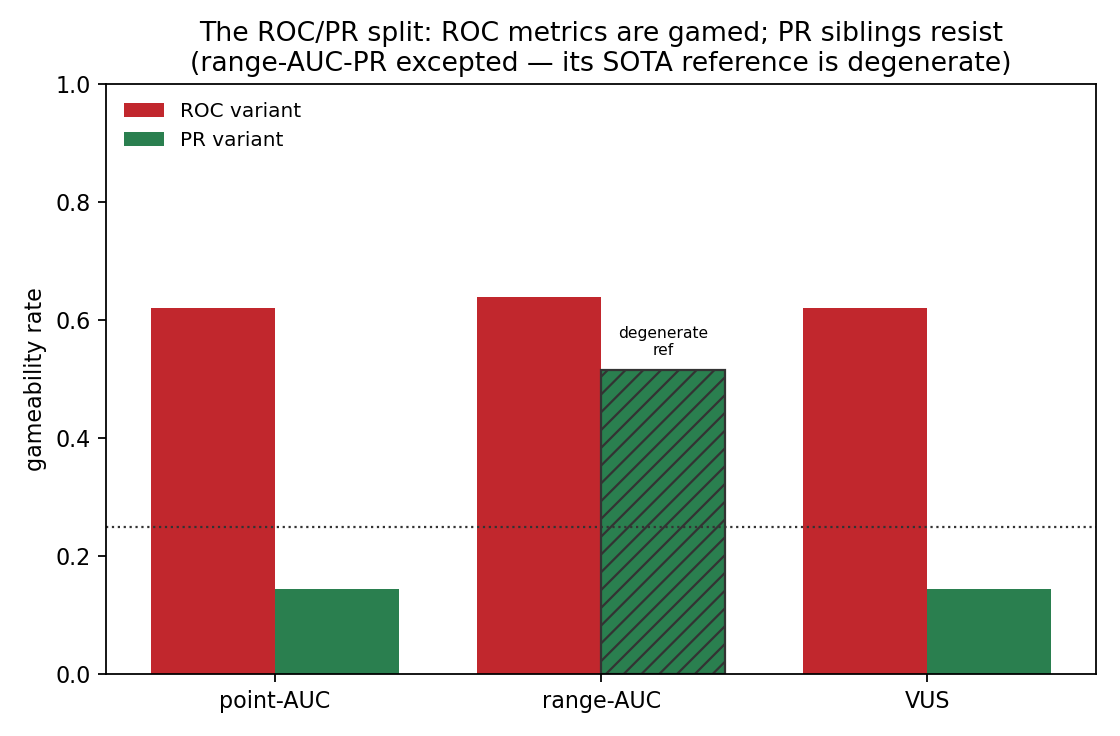
Table 2 and Figure 1 give the frozen-ladder classification. Five of the eleven replacement metrics are GAMEABLE (a pure no-skill detector reaches ≥90% of SOTA on ≥25% of series): four through genuine gaming and the fifth, range-AUC-PR, only through a degenerate reference (§5.4); the other six are FRAGILE; none is ROBUST (≤5%). The PA-F1 positive control is GAMEABLE as expected and is excluded from the count of replacements. All six GAMEABLE calls survive Holm correction across the twelve metrics; no FRAGILE metric does. The organizing axis is ROC-vs-PR, with one instructive exception (range-AUC-PR, §5.4).
Table 2: H1 gameability ladder (pure no-skill; Jeffreys 95% CI; n=250 except range-F1 n=231, see below). medR = median no-skill ratio-to-SOTA; gSOTA = median SOTA on the series the metric games (a diagnostic of genuine vs degenerate-reference gaming, §5.4); orc = oracle-inclusive rate.
| Metric | Gameability | Jeffreys 95% CI | medR | gSOTA | orc | Class |
|---|---|---|---|---|---|---|
| affiliation-F1 | 0.992 | [0.97, 1.00] | 0.98 | 1.00 | 1.00 | GAMEABLE |
| PA-F1 (control) | 0.760 | [0.70, 0.81] | 0.99 | 1.00 | 1.00 | GAMEABLE |
| range-AUC-ROC | 0.640 | [0.58, 0.70] | 0.95 | 0.97 | 0.66 | GAMEABLE |
| point-AUC-ROC | 0.620 | [0.56, 0.68] | 0.94 | 0.98 | 0.63 | GAMEABLE |
| VUS-ROC | 0.620 | [0.56, 0.68] | 0.94 | 0.99 | 0.63 | GAMEABLE |
| range-AUC-PR† | 0.516 | [0.45, 0.58] | 1.02 | 0.19 | 0.52 | GAMEABLE† |
| PA%K (K=0.5) | 0.184 | [0.14, 0.24] | 0.20 | 0.13 | 0.24 | FRAGILE |
| point-wise F1 | 0.152 | [0.11, 0.20] | 0.18 | 0.10 | 0.18 | FRAGILE |
| point-AUC-PR | 0.144 | [0.10, 0.19] | 0.09 | 0.04 | 0.19 | FRAGILE |
| VUS-PR | 0.144 | [0.10, 0.19] | 0.11 | 0.07 | 0.21 | FRAGILE |
| range-based F1 | 0.143 | [0.10, 0.19] | 0.07 | 0.17 | 0.15 | FRAGILE |
| PA%K (K=0.2) | 0.140 | [0.10, 0.19] | 0.22 | 0.40 | 0.20 | FRAGILE |
†range-AUC-PR is PR-based yet GAMEABLE, but only via a degenerate reference; see §5.4. For range-F1, 19 of 250 series have a real-detector SOTA of exactly 0 (the detectors score nothing under range-F1), making the ratio undefined; those series are dropped and the rate is 33/231.
Four findings stand out. (i) affiliation-F1 is gamed on 99.2% of series (a pure no-skill detector reaches SOTA on all but two), independently confirming, on 250 real series, the concern SimAD raised via a proposer-run experiment; strikingly, its most effective adversary is plain i.i.d.noise (Table 3). (ii) The ROC/PR split is stark, one-directional, and consequential (Figure 2). Every ROC-based metric is GAMEABLE (0.62–0.64) while its PR sibling is FRAGILE (0.14–0.15). A paired McNemar test is decisive: VUS-ROC is gamed on 119 series where VUS-PR is not, and the reverse on zero (p = 3×10⁻³⁶); the identical pattern holds for point-AUC (119 vs 0, p = 3×10⁻³⁶). The median no-skill VUS-PR reaches only 11% of SOTA versus 94% for VUS-ROC. (iii) affiliation-F1 is more gameable than the PA-F1 control it was meant to improve upon (0.992 vs 0.760): the field abandoned point-adjustment as catastrophically permissive, yet on this independent SOTA-relative test affiliation-F1 is worse. (iv) PA%K works as intended (0.140–0.184, FRAGILE), far better than the PA-F1 control (0.760), though not to ROBUST.
5.2 H2: Forgiveness frontier↩︎
Figure 3 reports the near-miss frontier: the largest ground-truth shift (in median anomaly lengths) at which a zero-localization detector still reaches ≥90% of SOTA (bootstrap 95% CIs on each point). The metrics span an order of magnitude in spatial tolerance. affiliation-F1 forgives a detector misplaced by 4× the median anomaly length (its median near-miss ratio stays ≥0.98 out to the largest shift tested), a quantitative statement of why it is so gameable. The ROC-family (point/range/VUS-ROC) forgives 2×; every remaining metric (the PA-family, the PR-based metrics, point-wise and range-F1) forgives only 0.5×, punishing anomaly-scale misplacement. Spatial forgiveness tracks gameability rank closely, identifying it as the mechanism: the metrics that tolerate misplacement are exactly the ones no-skill detectors exploit, and affiliation’s extreme tolerance is the driver of its 99% gameability.
5.3 H3: Inter-metric rank agreement↩︎
Over the six-detector pool, the mean per-series pairwise Kendall τ between metrics is 0.684 (median 0.71): metrics largely agree on how they rank detectors. The fraction of series with τ<0.6 is 0.240 (Figure 4), which does not exceed the pre-registered 25% threshold (one-sided exact binomial p = 0.67; Jeffreys 95% CI [0.19, 0.30]); restricted to the replacement metrics it is 0.180, and among the recommended survivors 0.104 (mean τ 0.78). H3 is therefore not established: that CI straddles the 25% threshold, so we fail to establish aggregate reordering rather than demonstrate its absence (an equivalence claim would need a TOST the CI cannot support). The one caveat is at the very top: the single highest-ranked detector differs across metrics on a majority of series (top-1 flip 0.63 among survivors, 0.84 among replacements), so the identity of the best detector is metric-sensitive even where the overall ordering concurs. With only six detectors this top-1 statistic is coarse and we report it as indicative. The disagreement that does occur concentrates on the ROC/PR axis.
5.4 Robustness: the weak-reference objection, resolved in both directions↩︎
No metric reaches the ROBUST tier, so the pre-registered TOST chance-equivalence certificate is awarded to none. The central threat to a SOTA-relative audit is a weak SOTA reference: if real detectors barely beat chance, no-skill reaching 90% of them is trivial. The gamed-series SOTA (Table 2, gSOTA) resolves this, and it cuts differently for the two tiers.
ROC and affiliation gaming is genuine. On the very series they game, the real detectors score 0.97–1.00 (gSOTA); a strong SOTA is below 0.6 on only 0–3% of those series. Real detectors are excellent there, and no-skill still matches them. This is the paper’s strongest result, and it is not a reference artifact: every metric also separates real detectors from chance by a wide margin (median SOTA − median chance = 0.25 for affiliation, 0.37–0.49 for the ROC metrics; Table 3).
The one exception, range-AUC-PR, is a degenerate reference, not a genuine failure. range-AUC-PR is PR-based yet GAMEABLE (0.516), which would break the ROC/PR dichotomy. But its gSOTA is 0.19, and on 100% of the series it “games”, the real detectors score below 0.6: range-AUC-PR simply assigns near-zero to every detector, real or fake (median no-skill 0.51 ≈ median SOTA 0.51), so the ratio is meaningless. Its GAMEABLE label is a floored-reference artifact, qualitatively different from the genuine ROC/affiliation gaming, and we exclude it from the “PR is safe” recommendation. The FRAGILE PR-family (VUS-PR, point-AUC-PR, range-F1) shows a milder version of the same effect: their small residual gaming occurs on near-floor-SOTA series (gSOTA 0.04–0.17), so their true robustness is likely better than the 0.14–0.15 reported.
Fixed-threshold sensitivity confirms it. Removing the oracle best-F1 threshold and predicting exactly the anomaly budget (a fixed quantile), the same ordering holds: affiliation-F1 is still gamed on 66% of series, while point-wise F1 and range-F1 drop to 0.09 and 0.08; the PR/point family is even more robust without the oracle threshold, and affiliation’s gameability is not an artifact of it.
The adversary is uninformative structure. The most effective adversary is the random-walk score for the ROC and FRAGILE metrics, and plain i.i.d.noise for affiliation and PA-F1 (Table 3). Both are anomaly-blind; a random walk merely mimics the smooth texture of a real detector’s output. These metrics reward score smoothness or spread that overlaps buffered anomaly regions, which no-skill signals possess for free.
Table 3: SOTA vs chance separation and no-skill exploitation (medians over 250 series). Every metric separates real detectors from chance (positive separation); the GAMEABLE metrics differ in that the best no-skill generator also reaches SOTA.
| Metric | median SOTA | median chance | separation | median no-skill | top adversary |
|---|---|---|---|---|---|
| affiliation-F1 | 1.00 | 0.75 | 0.25 | 0.98 | i.i.d.noise |
| PA-F1 | 1.00 | 0.65 | 0.35 | 0.98 | i.i.d.noise |
| range-AUC-ROC | 0.98 | 0.62 | 0.37 | 0.92 | random-walk |
| point-AUC-ROC | 0.99 | 0.50 | 0.49 | 0.90 | random-walk |
| VUS-ROC | 1.00 | 0.60 | 0.39 | 0.92 | random-walk |
| range-AUC-PR | 0.51 | 0.01 | 0.50 | 0.51 | constant |
| PA%K (K=0.5) | 0.85 | 0.02 | 0.82 | 0.10 | random-walk |
| point-wise F1 | 0.61 | 0.02 | 0.59 | 0.08 | random-walk |
| point-AUC-PR | 0.51 | 0.01 | 0.50 | 0.03 | random-walk |
| VUS-PR | 0.47 | 0.01 | 0.46 | 0.03 | random-walk |
| range-based F1 | 0.54 | 0.01 | 0.53 | 0.03 | random-walk |
| PA%K (K=0.2) | 0.98 | 0.06 | 0.93 | 0.16 | random-walk |
5.5 Cross-benchmark replication (five further benchmarks)↩︎
To test whether the UCR findings are specific to that archive’s extreme low-prevalence, single-anomaly structure, we re-ran the identical pre-registered pipeline on five further benchmarks accessed through TSB-AD mirrors: SMD (28 series), SMAP (40), MSL (22), NAB (52), and PSM (1 series, a single train/test split, used only qualitatively as it cannot support a rate). Median anomaly prevalence rises from UCR’s 0.34% to 2.1–10.0%. Table 4 gives the per-benchmark gameability ladder; the UCR column reproduces §5.1 exactly, a built-in positive control that the multi-benchmark harness is correct.
Table 4: Cross-benchmark gameability rate (pure no-skill reaches ≥90% of best-in-pool SOTA), per metric × benchmark, with the frozen-ladder class (G = GAMEABLE ≥25%, F = FRAGILE 5–25%, R = ROBUST ≤5%). Benchmarks are ordered by median anomaly prevalence (in parentheses), which is deliberately non-monotonic in the rates. Verdict: REPLICATES = same class on all five rate-bearing benchmarks; MOSTLY = same class on all but one; VARIES = spans two or more classes. PA-F1 (control) and PSM (1 series) are omitted from the table. †range-AUC-PR is the degenerate-reference exception (§5.4).
| Metric | UCR (0.34%) | SMAP (2.1%) | SMD (3.3%) | MSL (6.6%) | NAB (10.0%) | Verdict |
|---|---|---|---|---|---|---|
| affiliation-F1 | 0.99 G | 0.88 G | 0.07 F | 0.73 G | 0.65 G | MOSTLY |
| point-AUC-ROC | 0.62 G | 0.65 G | 0.32 G | 0.45 G | 0.60 G | REPLICATES |
| range-AUC-ROC | 0.64 G | 0.70 G | 0.07 F | 0.59 G | 0.75 G | MOSTLY |
| VUS-ROC | 0.62 G | 0.65 G | 0.07 F | 0.50 G | 0.69 G | MOSTLY |
| range-AUC-PR† | 0.52 G | 0.33 G | 0.32 G | 0.27 G | 0.73 G | REPLICATES |
| PA%K (K=0.2) | 0.14 F | 0.35 G | 0.07 F | 0.27 G | 0.35 G | VARIES |
| PA%K (K=0.5) | 0.18 F | 0.17 F | 0.04 R | 0.23 F | 0.37 G | VARIES |
| point-wise F1 | 0.15 F | 0.12 F | 0.11 F | 0.14 F | 0.31 G | MOSTLY |
| point-AUC-PR | 0.14 F | 0.15 F | 0.07 F | 0.14 F | 0.29 G | MOSTLY |
| range-based F1 | 0.14 F | 0.17 F | 0.04 R | 0.18 F | 0.46 G | VARIES |
| VUS-PR | 0.14 F | 0.17 F | 0.04 R | 0.14 F | 0.29 G | VARIES |
Two things replicate; one is newly qualified.
(i) The ROC-over-PR direction is invariant. On the two clean sibling pairs (VUS and point-AUC), a paired McNemar test never reverses on any benchmark: wherever a sibling gap exists it runs ROC→PR, and PR-side gaming exceeds ROC-side on zero of the clean pairs. The VUS-ROC-vs-VUS-PR split is statistically decisive on UCR, SMAP, MSL, and NAB (discordant b = 119/19/8/21, c = 0/0/0/0, p from 3×10⁻³⁶ to 8×10⁻³) and null only on SMD (b=2, c=1), where almost nothing is gamed. point-AUC-ROC is GAMEABLE on all five benchmarks. The “is this just UCR?” objection is answered: the split is not a UCR artifact.
(ii) range-AUC-PR is degenerate everywhere. It is GAMEABLE on all five benchmarks (0.27–0.73) and is the source of the only two McNemar “reversals” in the whole study (both on its own range-AUC sibling pair), consistent with §5.4’s diagnosis that its label is a floored-reference artifact, not genuine PR-metric exploitability.
(iii) Absolute rates are benchmark-dependent, and no metric is universally safe. The gameability magnitude varies sharply and is not a simple prevalence effect: SMD (prevalence 3.3%) shows almost no gaming (affiliation-F1, VUS-ROC and range-AUC-ROC all fall to FRAGILE and VUS-PR to ROBUST), even though MSL and NAB, at higher prevalence (6.6% and 10.0%), stay heavily gamed. SMD is the one benchmark on which the in-house detector pool itself scores highest, lifting the SOTA reference beyond no-skill reach: the audit correctly reports little gaming exactly where the real detectors are genuinely strong. NAB, conversely, is the hardest benchmark, the one where even the PR family tips into GAMEABLE (point-wise F1 0.31, point-AUC-PR and VUS-PR 0.29). The consequence for practice is this paper’s central caveat: no single metric stays in the safe tier on all six benchmarks (the universal-survivor set is empty), and even VUS-PR, FRAGILE or ROBUST on four benchmarks, is GAMEABLE on NAB. The stable, transferable finding is the class ordering: ROC-family and affiliation-F1 are the most gameable, PR-family and PA%K the least, while any single metric’s absolute safety shifts with the benchmark.
6 Discussion↩︎
Did the fix work? Partly. The migration away from PA-F1 delivered genuinely more robust metrics, namely PA%K and the PR-based metrics (VUS-PR, point-AUC-PR, range-F1), that a no-skill detector cannot easily game (14–15% of series, and likely less once their degenerate-reference cells are set aside). But the migration also carried forward, and in affiliation’s case amplified, a class of metrics a zero-localization detector reaches SOTA on the majority of real series. The most quotable finding is that affiliation-F1 (gamed on 99% of series) is more exploitable than the PA-F1 protocol it was introduced to improve upon (76%): the field replaced a metric it deemed catastrophically broken with one that, on an independent SOTA-relative test, is worse. Crucially the danger is not evenly distributed within a family: VUS-ROC and VUS-PR are proposed together, live in the same package, and are reported interchangeably, yet the audit games one on 119 series and the other on none of those same series. The axis is ROC-vs-PR, with a single honest exception, range-AUC-PR, whose GAMEABLE label reflects a floored reference (it scores every detector near zero) rather than genuine exploitability.
A metric-selection recommendation. From the ladder, the gamed-SOTA diagnostic, the frontier, and the cross-benchmark table we distill a decision protocol (released with the harness): prefer a PR-based F1 or AUC-PR metric (VUS-PR foremost, already the TSB-AD headline) or PA%K; report any ROC-AUC variant (point/range/VUS-ROC) only alongside a PR counterpart; treat affiliation-F1 as gameable unless paired with its forgiveness-frontier value; never read range-AUC-PR without checking that the real detectors score meaningfully above the prevalence floor; and, because absolute gameability is benchmark-dependent (§5.5), verify the chosen metric on your own data rather than assuming a metric that resisted here will resist everywhere. This supports the field’s recent shift toward the PR family as the least-gameable class, with the honest caveat that no metric is universally safe: even VUS-PR, FRAGILE-or-better on four of five benchmarks, is GAMEABLE on NAB and reaches ROBUST on none. The transferable guarantee is the class ordering; a single metric’s absolute safety does not survive the change of benchmark. The fix improves matters without closing the problem.
Why independence matters here. The single most reassuring prior fact about these metrics, that they are robust, traces almost entirely to their proposers. Our audit is adversarial (we try to game each metric), SOTA-relative (we ask whether no-skill reaches real detectors, not merely whether it beats chance), independent (we propose none of the metrics), and pre-registered (the ladder and thresholds were fixed before any real value was computed). Under those conditions the reassuring picture holds for the PR metrics and breaks for the ROC and affiliation metrics, a distinction the proposer-run checks, which test one metric at a time against chance, were not designed to draw.
Reconciliation with proposer claims. Our results do not contradict the metric papers: affiliation is designed to reward temporal proximity, and VUS is threshold- and buffer-robust. What we add is that, measured adversarially and relative to SOTA on real data, proximity-reward becomes no-skill-exploitability for the ROC variants and for affiliation, while the PR variants’ precision term suppresses it. The forgiveness frontier makes this a quantity, not a verdict: it is the price, in anomaly-lengths of tolerated misplacement, that each metric pays for its robustness or leniency.
7 Limitations↩︎
SOTA reference is an in-house six-detector pool (Matrix Profile, IF, LOF, AR, PCA-reconstruction, kNN-distance). The gamed-SOTA diagnostic (§5.4) shows this does not inflate the headline ROC/affiliation result (real detectors score 0.97–1.0 on the gamed series) but does contaminate range-AUC-PR and, mildly, the FRAGILE PR-family (near-floor SOTA on their few gamed series). Wiring published-leaderboard detector outputs as an alternative reference is the natural next strengthening.
Best-F1 thresholding grants each detector its oracle threshold, applied symmetrically to no-skill and SOTA; the fixed-threshold sensitivity (§5.4) shows the ordering is threshold-independent. The no-skill statistic is a max over generators × 10 replicates (an extreme order statistic), so the ROC rates are mildly replicate-dependent; the gamed-SOTA=1.0 diagnostic shows this does not explain them.
Benchmark scope. We now report five secondary benchmarks (§5.5): the ROC/PR direction replicates, but absolute rates are benchmark-dependent, and one benchmark (SMD) shows little gaming because its real detectors are strong there, so a metric’s tier must be verified per dataset, not assumed. The secondary series counts are modest (22–52) and PSM is a single series (qualitative only); industrial-control coverage (SWaT/WADI) and a published-leaderboard SOTA reference remain the next strengthening.
Rank agreement uses a six-detector pool → the H3 τ is coarse, and the top-1-flip statistic especially so; we report H3 as not established rather than over-reading it.
The near-miss battery invites a “tolerance is by design” defense from metric authors; the frontier in anomaly-length units is our pre-emptive, quantitative answer, not a refutation of the metrics’ intent.
Prior work reaches adjacent conclusions: notably Yang et al. (2025), which predates this study by about eight months but is proposer-conflicted (SimAD authorship) and not SOTA-relative. Our contribution is the outside-proposer, SOTA-relative adversarial frame plus the released harness, not primacy on the bare fact that no-skill inflates these metrics.
8 Conclusion↩︎
The point-adjustment fix was only half a fix. We provide the first independent, adversarial, SOTA-relative stress-test of the post-point-adjustment TSAD metric suite on real benchmarks, together with a forgiveness-frontier instrument and a released, reproducible harness. On 250 UCR series, five of eleven replacement metrics (affiliation-F1 and every ROC-based metric tested) are gamed by a no-skill detector on the majority of series, and genuinely so (the real detectors score 0.97–1.0 there); the ROC/PR split is decisive and one-directional (VUS-ROC gamed on 119 series where VUS-PR is not, and never the reverse). Across five further benchmarks the ROC-over-PR direction never reverses (McNemar-decisive on four), but absolute gameability is benchmark-dependent and no single metric is safe on all six; even VUS-PR is GAMEABLE on NAB. The PR-based metrics and PA%K are the resistant survivors, though none reaches ROBUST. The practical verdict is a metric-selection rule the field can act on today: report a PR-based metric (VUS-PR foremost) or PA%K, treat affiliation-F1 and the ROC-AUC variants as gameable unless paired with a PR counterpart and a forgiveness-frontier value, and re-check the choice on each new benchmark, since no metric proved universally robust. The field’s recent move toward PR-based scoring is supported (as the least-gameable class, not a robust guarantee) while its still-common reporting of VUS-ROC and affiliation-F1 is not.
9 Data and code availability↩︎
UCR Anomaly Archive is public (Wu & Keogh 2021). Our stress-test harness, all metric vendors at frozen commits (affiliation @8d84498, TSB-UAD @313f0fd, prts 1.0.0.3), the frozen config, and one-command reproduction scripts are released publicly, and the pre-registration is timestamped on OSF before any real value was computed; the DOI-bearing code archive and the OSF registration links are provided in the next revision of this preprint.
10 Declaration of Generative AI use↩︎
During the preparation of this work the author used Claude (Anthropic) as an assistive tool: to help draft and edit prose, to help implement the analysis and experiment code, and to help run the experiment pipeline. The study’s design, structure, and framing; the topic and hypotheses; every pre-registered decision (fixed on OSF before any real value was computed); the review and revision of all content; and the verification of every result are the author’s, who takes full responsibility for the paper. Every reported number is regenerable from the released logs and code by a single command; the author independently re-derived the headline gameability rates from the raw result files.
References↩︎
Abdulaal, A., Liu, Z., Lancewicki, T. (2021). A Practical Approach to Asynchronous Multivariate Time Series Anomaly Detection and Localization. KDD. doi:10.1145/3447548.3467174.
Bhattacharya, D., Mukherjee, S., Kamanchi, C., Ekambaram, V., Jati, A., Dayama, P. (2024). Towards Unbiased Evaluation of Time-series Anomaly Detector. arXiv:2409.13053.
Breunig, M. M., Kriegel, H.-P., Ng, R. T., Sander, J. (2000). LOF: Identifying Density-Based Local Outliers. ACM SIGMOD. doi:10.1145/342009.335388.
Garg, A., Zhang, W., Samaran, J., Savitha, R., Foo, C.-S. (2022). An Evaluation of Anomaly Detection and Diagnosis in Multivariate Time Series. IEEE TNNLS 33(6):2508–2517. doi:10.1109/TNNLS.2021.3105827.
Ghorbani, R., Reinders, M. J. T., Tax, D. M. J. (2024). PATE: Proximity-Aware Time Series Anomaly Evaluation. KDD. doi:10.1145/3637528.3671971.
Huet, A., Navarro, J. M., Rossi, D. (2022). Local Evaluation of Time Series Anomaly Detection Algorithms. KDD, 635–645. doi:10.1145/3534678.3539339.
Hundman, K., Constantinou, V., Laporte, C., Colwell, I., Soderstrom, T. (2018). Detecting Spacecraft Anomalies Using LSTMs and Nonparametric Dynamic Thresholding. KDD. doi:10.1145/3219819.3219845.
Hwang, W.-S., Yun, J.-H., Kim, J., Min, B. G. (2022). Do you know existing accuracy metrics overrate time-series anomaly detections? ACM SAC, 403–412. doi:10.1145/3477314.3507024.
Kim, S., Choi, K., Choi, H.-S., Lee, B., Yoon, S. (2022). Towards a Rigorous Evaluation of Time-series Anomaly Detection. AAAI 36(7):7194–7201. doi:10.1609/aaai.v36i7.20680.
Lavin, A., Ahmad, S. (2015). Evaluating Real-Time Anomaly Detection Algorithms — The Numenta Anomaly Benchmark. IEEE ICMLA, 38–44. doi:10.1109/ICMLA.2015.141.
Liu, F. T., Ting, K. M., Zhou, Z.-H. (2008). Isolation Forest. IEEE ICDM, 413–422. doi:10.1109/ICDM.2008.17.
Liu, Q., Paparrizos, J. (2024). The Elephant in the Room: Towards A Reliable Time-Series Anomaly Detection Benchmark. NeurIPS Datasets & Benchmarks. doi:10.52202/079017-3437.
Paparrizos, J., Boniol, P., Palpanas, T., Tsay, R. S., Elmore, A., Franklin, M. J. (2022). Volume Under the Surface: A New Accuracy Evaluation Measure for Time-Series Anomaly Detection. PVLDB 15(11):2774–2787. doi:10.14778/3551793.3551830.
Paparrizos, J., Kang, Y., Boniol, P., Tsay, R. S., Palpanas, T., Franklin, M. J. (2022). TSB-UAD: An End-to-End Benchmark Suite for Univariate Time-Series Anomaly Detection. PVLDB 15(8):1697–1711. doi:10.14778/3529337.3529354.
Rewicki, F., Denzler, J., Niebling, J. (2023). Is It Worth It? Comparing Six Deep and Classical Methods for Unsupervised Anomaly Detection in Time Series. Applied Sciences 13(3):1778. doi:10.3390/app13031778.
Sarfraz, M. S., Chen, M.-Y., Layer, L., Peng, K., Koulakis, M. (2024). Position: Quo Vadis, Unsupervised Time Series Anomaly Detection? ICML, PMLR 235:43461–43476.
Sehili, M. A., Zhang, Z. (2023). Multivariate Time Series Anomaly Detection: Fancy Algorithms and Flawed Evaluation Methodology. arXiv:2308.13068.
Sørbø, S., Ruocco, M. (2024). Navigating the Metric Maze: A Taxonomy of Evaluation Metrics for Anomaly Detection in Time Series. Data Mining and Knowledge Discovery 38(3). doi:10.1007/s10618-023-00988-8.
Su, Y., Zhao, Y., Niu, C., Liu, R., Sun, W., Pei, D. (2019). Robust Anomaly Detection for Multivariate Time Series through Stochastic Recurrent Neural Network. KDD. doi:10.1145/3292500.3330672.
Tatbul, N., Lee, T. J., Zdonik, S., Alam, M., Gottschlich, J. (2018). Precision and Recall for Time Series. NeurIPS 31. arXiv:1803.03639.
Wagner, D., Michels, T., Schulz, F. C. F., Nair, A., Rudolph, M., Kloft, M. (2023). TimeSeAD: Benchmarking Deep Multivariate Time-Series Anomaly Detection. TMLR.
Wagner, D., Nair, A., Franks, B. J., Arweiler, A., Muraleedharan, V. K., et al. (2025). Formally Exploring Time-Series Anomaly Detection Evaluation Metrics. arXiv:2510.17562.
Wu, R., Keogh, E. J. (2021). Current Time Series Anomaly Detection Benchmarks are Flawed and are Creating the Illusion of Progress. IEEE TKDE. doi:10.1109/TKDE.2021.3112126.
Xu, H., Chen, W., Zhao, N., et al. (2018). Unsupervised Anomaly Detection via Variational Auto-Encoder for Seasonal KPIs in Web Applications. WWW, 187–196. doi:10.1145/3178876.3185996.
Yang, K., et al. (2025). A Problem-Oriented Taxonomy of Evaluation Metrics for Time Series Anomaly Detection. arXiv:2511.18739.
Yeh, C.-C. M., Zhu, Y., Ulanova, L., et al. (2016). Matrix Profile I: All Pairs Similarity Joins for Time Series. IEEE ICDM, 1317–1322. doi:10.1109/ICDM.2016.0179.
Zhong, Z., Yu, Z., Xi, X., Xu, Y., Cao, W., Yang, Y., Yang, K., You, J. (2024). SimAD: A Simple Dissimilarity-based Approach for Time Series Anomaly Detection. arXiv:2405.11238.