Answering Without Referring: How AI Search Rewrites the Web's Economic Bargain
July 08, 2026
Abstract
Search engines have long allocated attention on the web by routing users from queries to websites. AI search changes this arrangement because information needs can be resolved inside the intermediary. Using URL-level Comscore U.S. desktop clickstream, we compare ChatGPT and Google information-seeking occasions and exploit ChatGPT Search access expansions to estimate traditional search displacement. ChatGPT produces outbound clicks in only 5.2% of conversation sessions, far below Google’s referral ratio. The remaining clicks are not a scaled-down Google stream: they skew toward specialized destinations and away from ad-supported sites. Wider access cuts search use by 9.4%, with search-referral losses largest for informational categories. Our findings identify a central economic shift in digital intermediation: AI search might satisfy information needs inside the intermediary while weakening the referral bargain that has linked search, traffic, and content production on the open web.
Answering Without Referring:
How AI Search Rewrites the Web’s Economic Bargain
Qiaoni Shi, Kai Zhu, and Kai Gu
Bocconi University, Milan, Italy
This version: July 2026
Keywords: AI search; web traffic; digital intermediation; attention economy; search advertising.
1 Introduction↩︎
Search engines lowered the cost of finding information [1], [2] and became the web’s dominant mechanism for allocating attention [3], [4]. For two decades, the economic bargain was simple: users expressed information needs, search engines ranked and monetized queries, and destination websites received visits they could convert into advertising impressions, subscriptions, purchases, or brand equity [4]–[7]. The bargain was implicit rather than contractual: search engines captured value at the query, while content producers supplied information and captured value after the click.
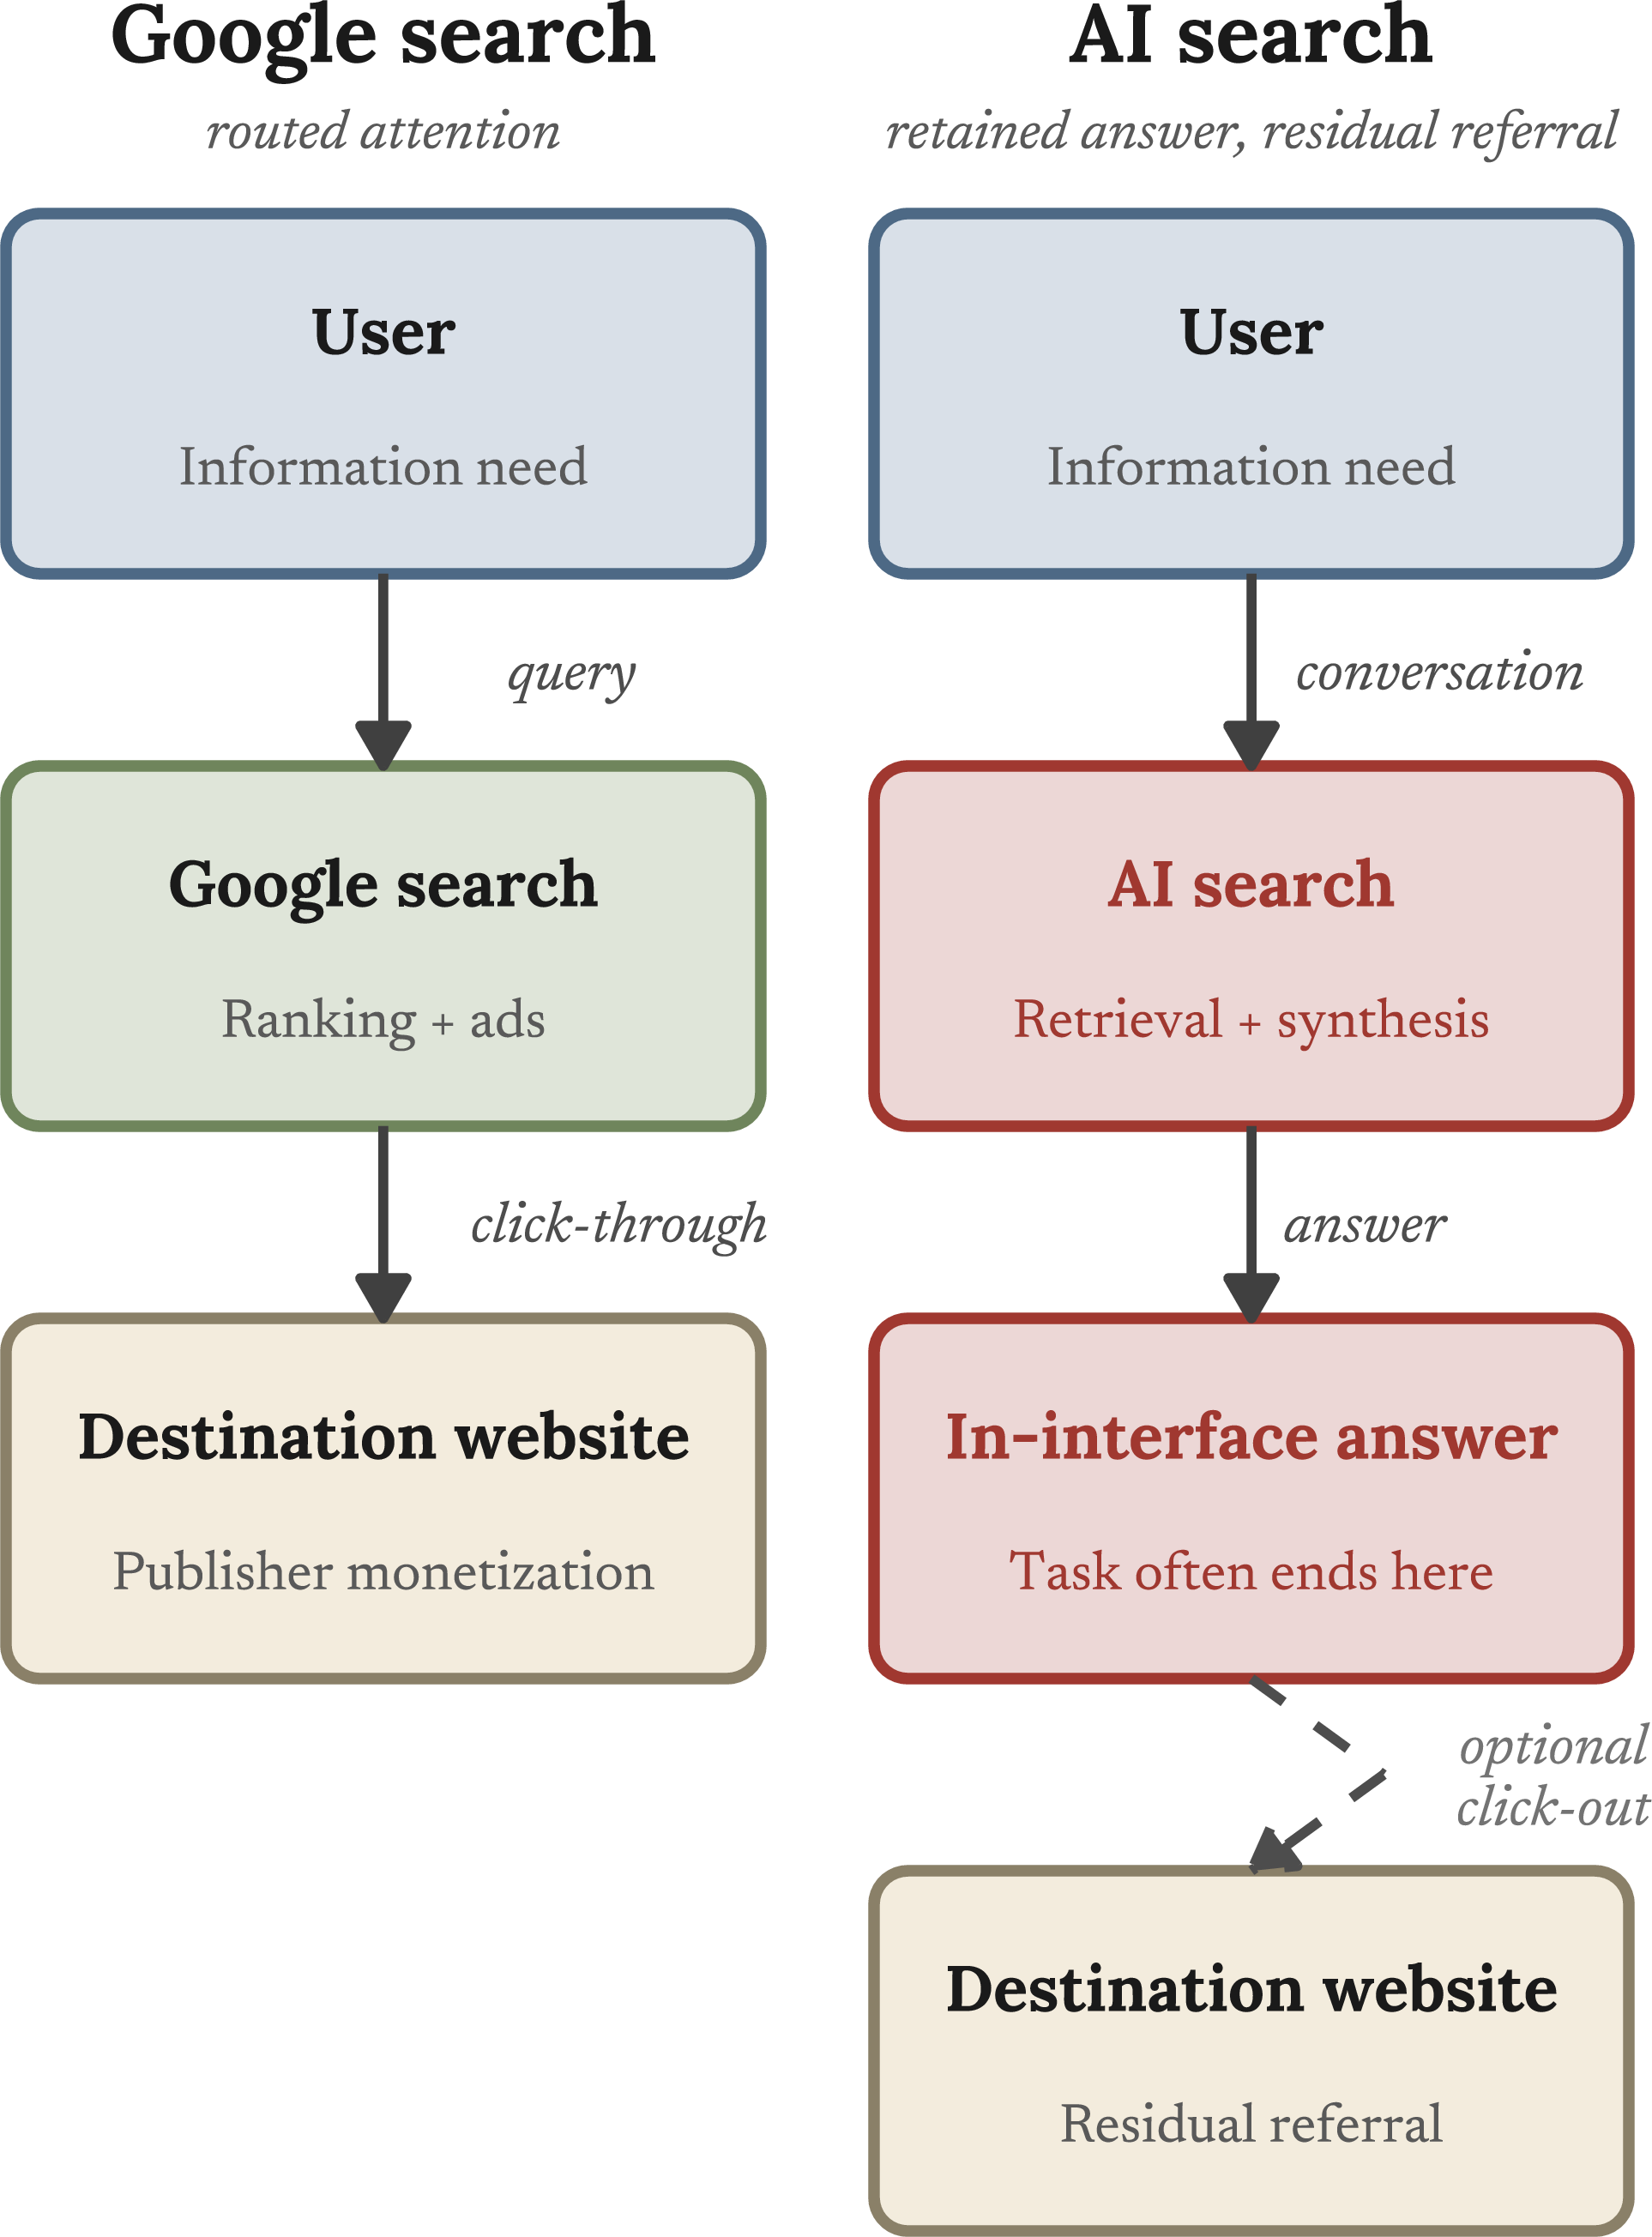
AI search, an answer interface that combines web retrieval with language-model synthesis, changes this bargain by moving resolution inside the intermediary. Instead of returning only ranked links, the interface can retrieve from websites, synthesize a response, and satisfy the information need before the user visits a source. 1 contrasts this architecture with Google search. Google monetizes the query and routes attention through a click; AI search may end with an in-chat answer, leaving websites only an optional residual click-out stream.
This is a paradigm shift in the web’s traffic economy: discovery no longer has to culminate in a visit, because the intermediary can resolve the need before the user reaches a source. Citations and links can preserve attribution, but they do not recreate the attention, ad impression, conversion opportunity, or subscriber relationship attached to a visit. That difference is economically consequential because traffic remains central to content publishing, digital advertising, and online commerce [8]–[10]. The empirical question is therefore how often AI search retains information needs, where the residual referrals go, and whether wider access reduces traditional search.
A growing academic literature documents pieces of this transition. Recent work has been valuable in measuring how LLM adoption changes online behavior, whether LLM use substitutes for or complements traditional search, and how publishers respond to generative AI [10]–[12]. A closely related paper documents ChatGPT referrals in destination-side e-commerce traffic [13]. We build on these studies by examining user-side information seeking under AI search—that is, language-model interfaces with web retrieval—including absorbed sessions that leave no destination-side trace, and by comparing those occasions with traditional search across the open web.
We provide that user-side view using URL-level Comscore U.S. desktop clickstream from October 2024 through July 2025, a window that spans the initial ChatGPT Search rollout. The data record the same household’s page loads, timestamps, and HTTP referrers, allowing us to reconstruct ChatGPT conversation sessions, traditional search queries, and outbound referrals. We compare ChatGPT sessions and Google queries within the same household-week and estimate within-household, within-week differences in routing. We then exploit three expansions of ChatGPT Search access: October 31 2024 for paid subscribers, December 16 2024 for free logged-in users, and February 5 2025 for anonymous browsers [14]. A stacked difference-in-differences design pools cohorts newly eligible at each date and compares them with reweighted households without pre-expansion ChatGPT or Claude activity to estimate the effect of wider access on traditional search use [15], [16].
Three results characterize how AI search changes the web’s traffic allocation. First, ChatGPT retains most expressed information needs. It produces a clean outbound click in only 5.2% of conversation sessions, compared with 31.1% of Google queries, and the gap persists within the same household and week. Second, the residual traffic is not a proportional sample of traditional search traffic. Users invoke ChatGPT relatively more in reference and tool-oriented browsing contexts, but ChatGPT clicks out most often in technical and e-commerce contexts; its referrals favor reference, academic, developer, and tools/SaaS destinations and avoid much of the ad-supported web. Third, wider access to ChatGPT Search reduces traditional search queries by 9.4% on average and 17.0% after twenty weeks, with the loss concentrated in informational categories.
The paper’s primary contribution is to identify the routing margin through which AI search reallocates attention. Traditional search reduced search costs while usually routing users onward; AI search can reduce those costs by resolving the task inside the intermediary. By measuring sessions that do and do not exit the AI interface, comparing ChatGPT and Google within household-week, and using access expansions to estimate search displacement, we connect three margins that are usually observed separately: retention inside AI search, the composition of residual referrals, and downstream substitution away from traditional search. Our claim is deliberately narrower than a welfare claim: we measure a change in observable traffic allocation, not consumer surplus, publisher revenue, or long-run content production.
The findings contribute to three literatures. First, we extend research on attention, search, and digital intermediation by distinguishing intermediaries that route filtered information needs from answer interfaces that can resolve those needs themselves [2]–[4], [8], [9]. Second, we complement research on generative-AI adoption, productivity, and online participation by tracing how use inside the AI interface changes behavior outside it [17]–[22]. Third, we extend emerging evidence on AI search and website traffic by observing absorbed information-seeking occasions across the web, comparing intermediaries within households, and identifying traditional search displacement after access expansions [10]–[13].
The paper proceeds as follows. 2 describes the data and methods. 3 presents the results. 4 discusses implications and future research.
2 Data and Method↩︎
URL-level Comscore U.S. desktop clickstream data are well suited to the routing questions we study because they follow the same households across intermediaries and over time. The raw data contain foreground and background requests; we construct a foreground-visit layer for user-facing browsing and retain timestamps, HTTP referrers, search-query URLs, ChatGPT conversation endpoints, and surrounding browsing contexts. This user-side view lets us observe both referrals to destination websites and information-seeking occasions that leave no destination-side trace. The rest of this section defines the panel, user-side units, referral measures, domain taxonomy, access-expansion cohorts, and adoption patterns that support these tests.
2.0.0.1 Data and units.
The full Comscore sample contains between 168,467 and 238,315 active U.S. desktop households per month. A balanced sub-panel of 45,386 households appears with at least four foreground page loads in every month; we use it only for the traditional search displacement analysis. A foreground visit is an analytic page-load layer with a valid HTML MIME type and response code. This restriction removes assets, background requests, and redirects from the raw clickstream. A search query is a foreground Google, Bing, or Yahoo load whose URL matches the platform’s search pattern. Online Appendix Sections 5.1–5.3 document panel construction, traffic cleaning, and endpoint coverage.
2.0.0.2 Conversation sessions.
Raw ChatGPT records do not map one-to-one to occasions of user information seeking. ChatGPT is a single-page application, so one conversation can generate repeated endpoint loads as the user sends messages, revisits the tab, or continues the exchange. Each conversation-endpoint URL contains a conversation identifier. We define a conversation session as the maximal sequence of loads on one machine that share this identifier, opening a new session when the same identifier reappears after more than one hour. A different identifier always begins a new session. This construction deduplicates repeated loads without combining distinct conversations. It also gives ChatGPT a user-side unit comparable to a Google query: one occasion on which a household brought an information need to an intermediary. Online Appendix 5.4 reports the threshold sensitivity.
2.0.0.3 Referrals.
We observe an outbound referral when a foreground visit to a third-party website carries ChatGPT or a search engine in its HTTP referrer; a visit with no observable referrer is treated as a direct visit rather than a referral from search or another external source. A clean referral further removes self-referential traffic, platform-internal navigation, and search-results pages reached from another source. We keep genuine user clicks and exclude machine-initiated programmatic requests, following the URL patterns in Online Appendix 6.1.
These user-side events provide a common denominator for comparing where attention ends. For platform \(p\), we define the referral ratio as the share of conversation sessions or search queries that produce at least one clean outbound referral. Its complement is absorptiveness, the share that ends without a clean referral. We compare one ChatGPT conversation session with one Google query because each represents an occasion on which a household brought an information need to an intermediary. The measures do not condition on a results-page impression or destination visit. They describe traffic rather than consumer welfare: an absorbed session may be valuable to the user even though it creates no observable visit for a website.
2.0.0.4 Domain classification and category shares.
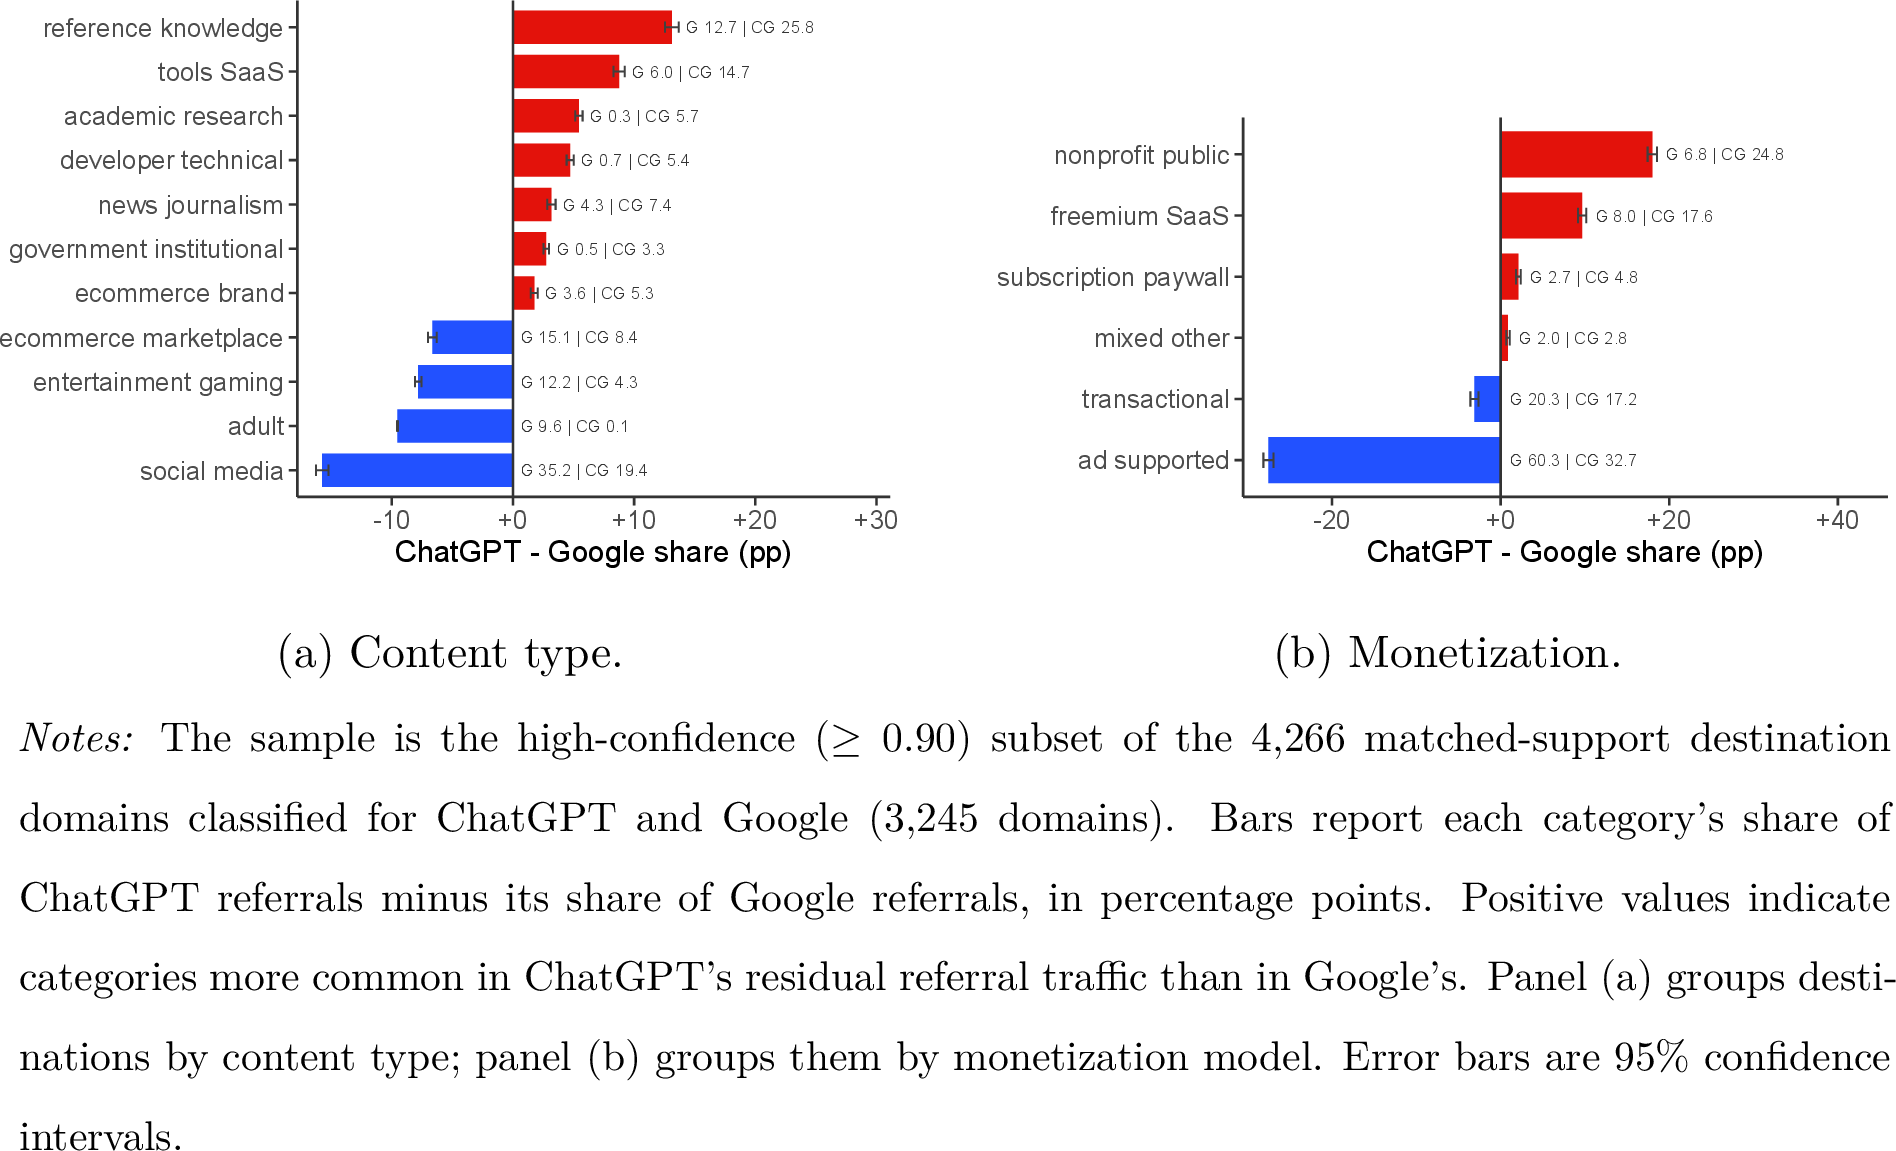
We classify 4,266 matched-support destination domains into content-type and monetization categories. A high-confidence subset of 3,245 domains supports content-type comparisons, surrounding-context labels, and displacement-by-category results (Online Appendix 7). For category \(C\) and event set \(E\), we report the difference in category shares: \[\Delta_E(C)=\operatorname{Share}_{\text{CG},E}(C)-\operatorname{Share}_{\text{G},E}(C).\] Positive values mean that category \(C\) is more common for ChatGPT than for Google in the event set being analyzed. In the user-intent analysis, \(E\) is classifiable surrounding-context anchors; in the destination-composition analysis, \(E\) is clean outgoing referrals.
2.0.0.5 Access expansions and design.
OpenAI extended ChatGPT Search to paid subscribers on October 31, 2024, free logged-in users on December 16, and anonymous browsers on February 5, 2025. We define cohorts using pre-expansion signals that remain fixed afterward. The paid-subscriber group contains 84 households (\(P\)); the logged-in group contains 2,440 API-dominant households (\(L\)); and the anonymous-browser group contains 1,358 anonymous-dominant households (\(A\)). The pooled treated sample contains 3,882 households. The preferred \(N_{\mathrm{itt}}\) control contains households with no pre-expansion ChatGPT or Claude activity (Claude being the closest competing chat-search assistant). We reweight treated observations toward the American Community Survey distribution using age by household-income cells. Each treated cohort appears only in its own stack and is matched to its own \(N_{\mathrm{itt}}\) control, defined as the households with no ChatGPT or Claude activity as of that expansion’s date; the control pool therefore shrinks for later expansions. Online Appendix Sections 10.1–10.2 give the endpoint classifier, cohort-threshold sensitivity, and balance diagnostics.
2.0.0.6 Adoption.
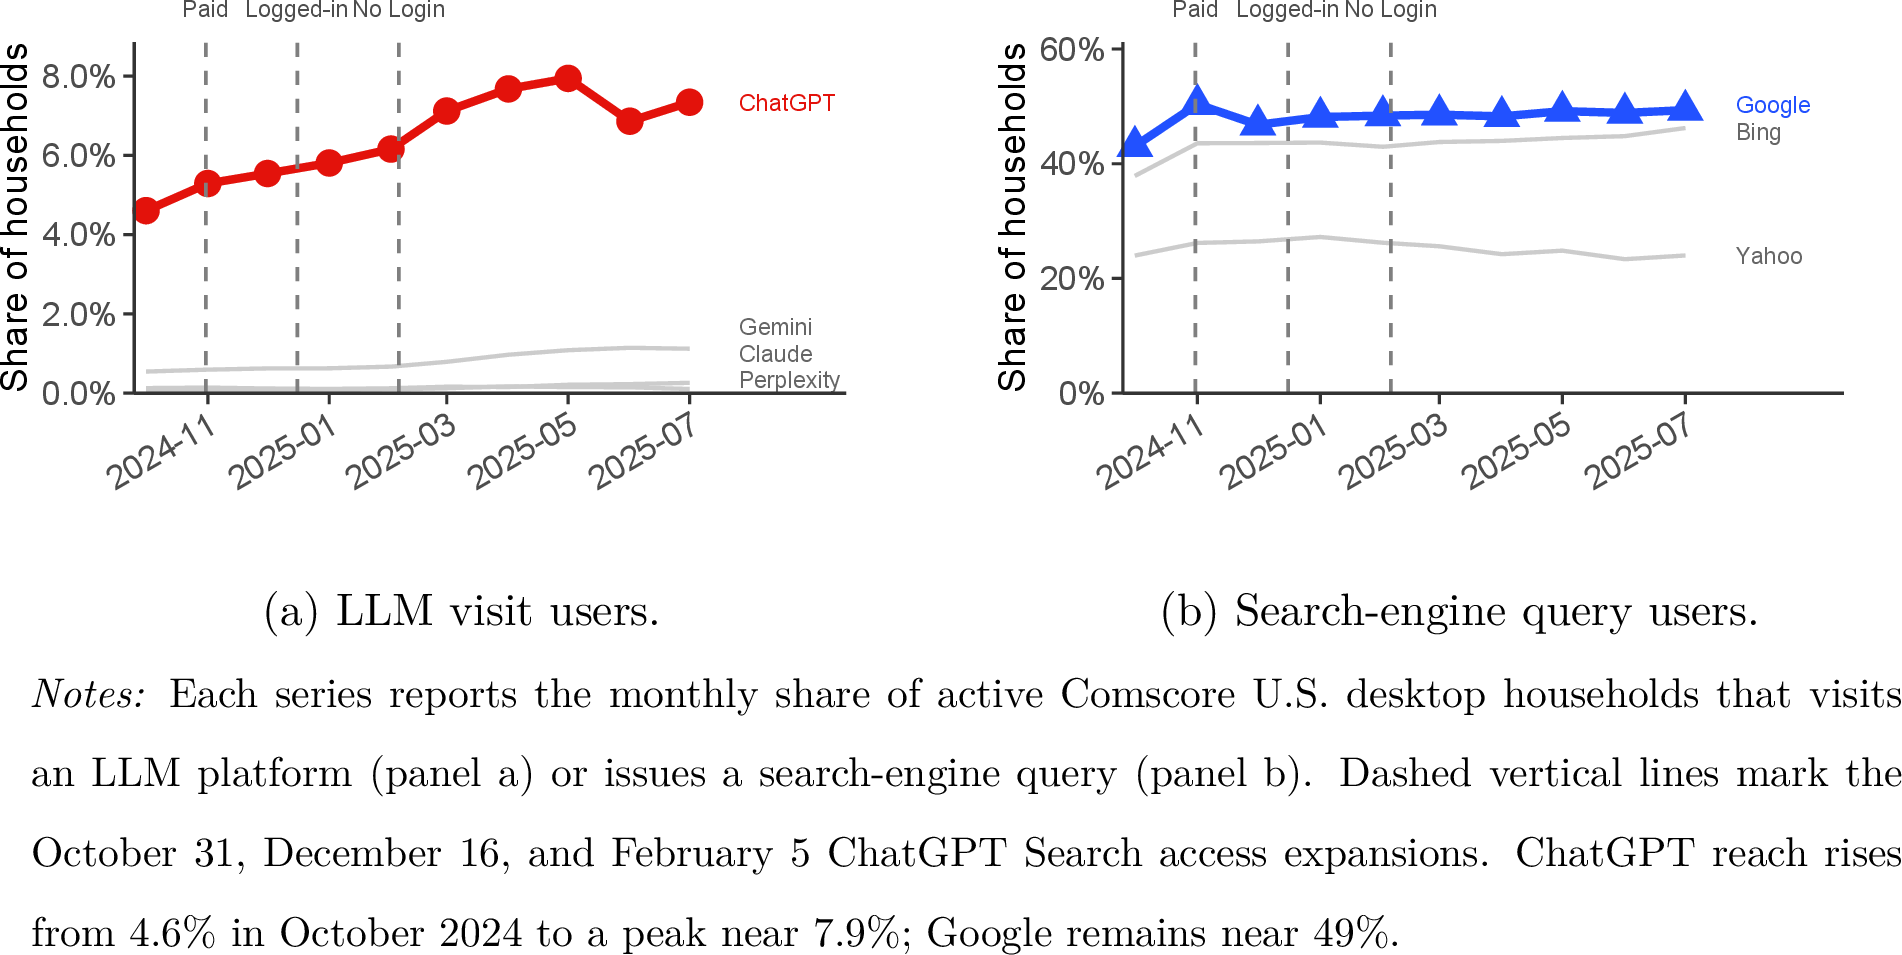
ChatGPT’s monthly active-household reach rises from about 4.6% in October 2024 to a peak near 7.9% in mid-2025 (2). Gemini, Claude, and Perplexity remain below 1.5%, while Google’s reach stays near 49%. We infer search-enabled ChatGPT conversation sessions from an audited endpoint signal, after subtracting contemporaneous non-search surfaces within the session.1 This inferred search-use series rises by approximately a factor of forty-five per active household from November 2024 to its April 2025 peak. Because adoption trends alone cannot show whether this activity adds new tasks or displaces traditional search, the displacement analysis below relies on the access-expansion design.
3 Results↩︎
We organize the findings in three steps. We first measure how often information-seeking occasions exit each intermediary. We then examine the browsing contexts in which the residual referral traffic occurs and which destinations receive it. Finally, we use the three access expansions to estimate whether AI search displaces traditional search. This sequence moves from user-side retention, to differential routing, to causal substitution.
3.1 AI search retains most information-seeking occasions↩︎
3.1.0.1 Measuring routing from the intermediary.
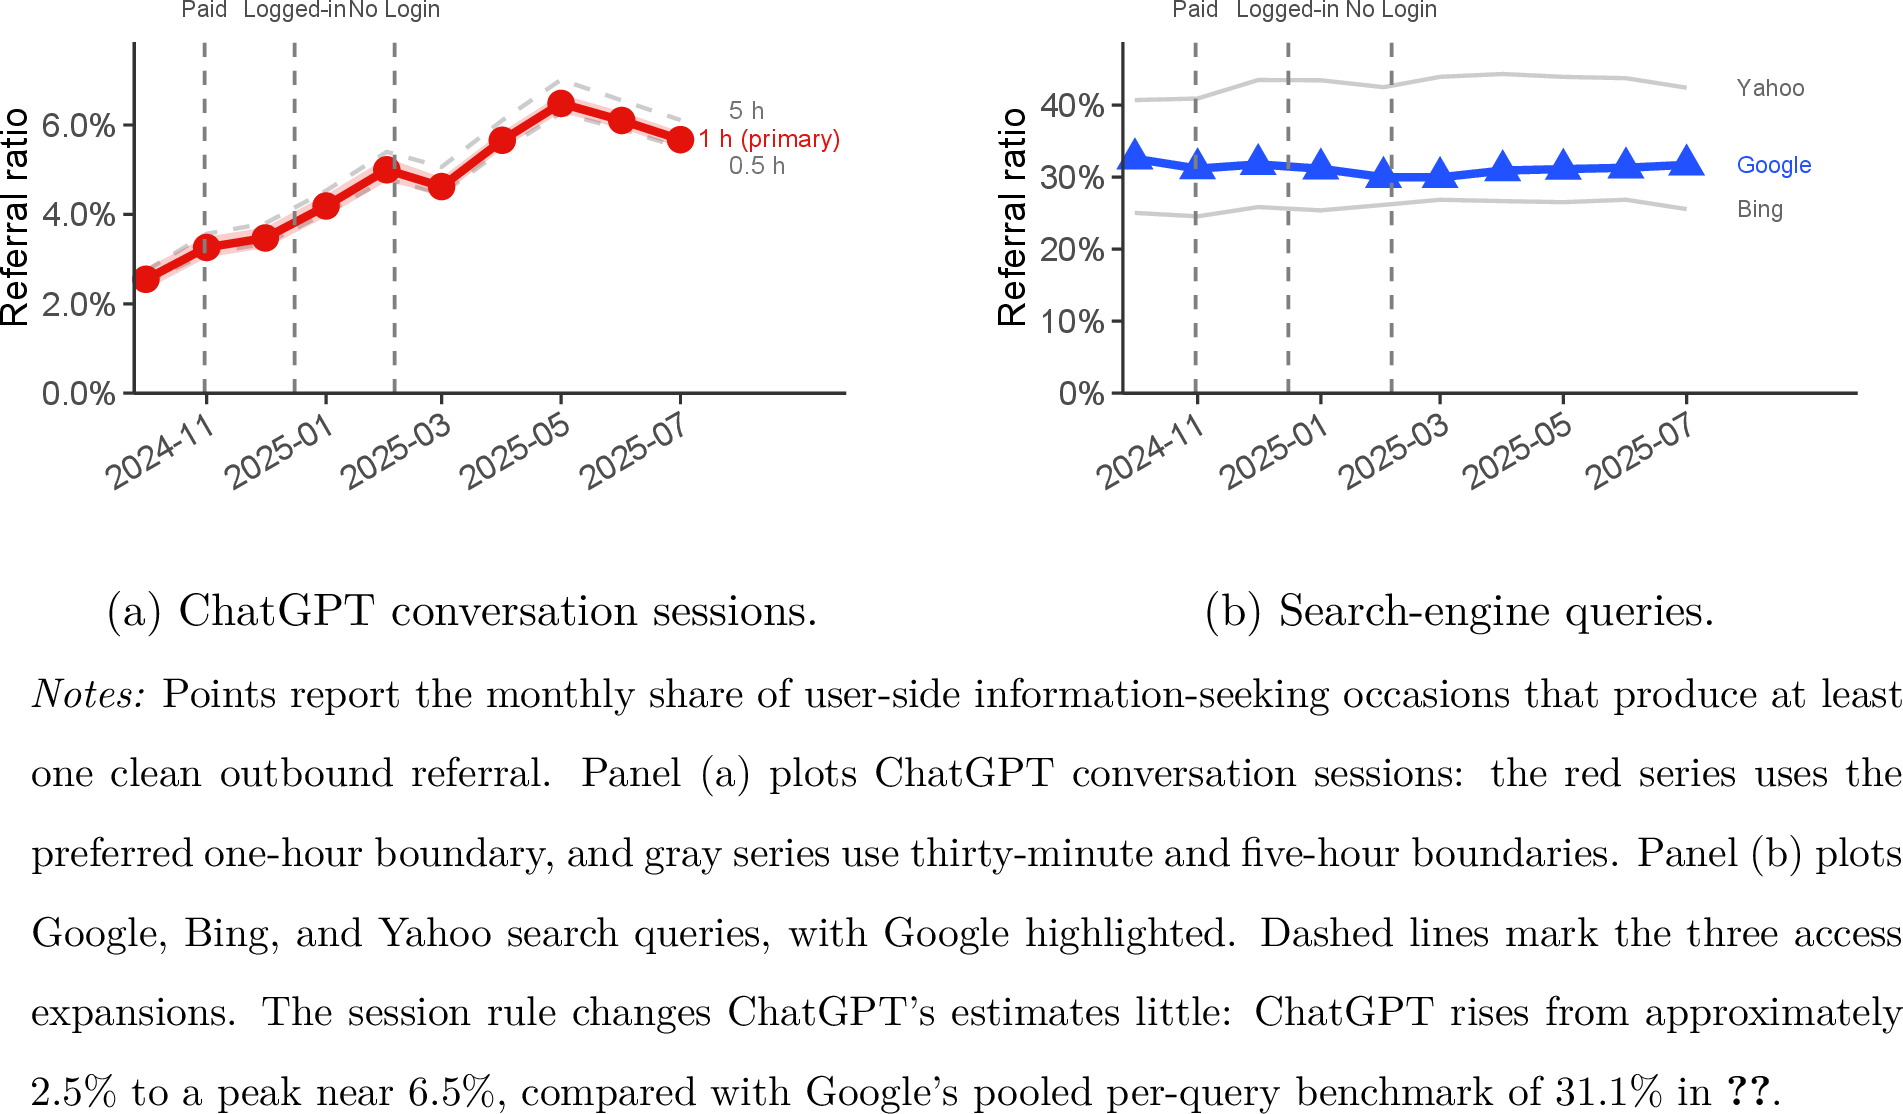
The central measurement decision is the denominator. A click-through rate begins with a results-page impression or a displayed link. We instead begin with an information-seeking occasion observed at the intermediary and ask whether it produces at least one clean referral. For ChatGPT, that occasion is a conversation session; for Google, it is a query. A conversation can contain several messages and repeated page loads before any click occurs. We therefore count the whole exchange once, using the conversation identifier, and ask whether that exchange ever generated a clean referral. 3 varies the session boundary from thirty minutes to five hours. The estimates move little, showing that the comparison does not depend on the one-hour boundary.
ChatGPT routes substantially fewer information-seeking occasions than Google. Its monthly referral ratio rises from approximately 2.5% to a peak near 6.5%, but remains far below Google’s per-query ratio (3). Pooled across the sample, ChatGPT produces a clean referral in 5.2% of sessions, compared with 31.1% of Google queries (1). The household-level pattern is starker: 74.4% of 56,578 ChatGPT-active households never produce a clean ChatGPT referral during the ten-month window, compared with 9.6% of 291,747 Google-querying households.
| Metric | ChatGPT | |
|---|---|---|
| User-side event | Search query | Conversation session |
| Total events | 61,453,859 | 409,133 |
| Total clean referrals | 31,345,265 | 166,915 |
| Referral ratio | 31.1% | 5.2% |
| Active households | 291,747 | 56,578 |
| Zero-referral household share | 9.6% | 74.4% |
These measures describe observable traffic, not whether a task was completed or whether the intermediary created value for the user. A session without a clean referral may end with a satisfactory answer, an abandoned task, or a destination visit whose referrer was stripped. A session with a referral may contain several messages but enters the ratio only once. Absorptiveness therefore identifies where observable attention ends while remaining agnostic about the user’s welfare and the reason no click occurred.
Public benchmarks support the scale of the result but also show why definitions matter.2 Industry reports using per-query or bounded-session denominators generally place ChatGPT outbound routing between approximately 3% and 7%, which contains our pooled estimate and overlaps most of the monthly series. Estimates based on clicks per continuous visit can be much larger because one visit can contain several information-seeking occasions and several clicks. Server-side estimates, by contrast, can be lower when browsers strip AI referrers, while our clean-referral filter excludes authentication, infrastructure, and automated requests that broader click counts may retain.
3.1.0.2 Comparing the same household across intermediaries.
The raw gap can combine persistent differences between the households that use each intermediary, common changes across weeks, task selection across intermediaries, and differences created by the interfaces themselves. We make progress on the first two factors by restricting the analysis to household-weeks active on both ChatGPT and Google and estimating \[\text{Referral ratio}_{itq} = \beta\,\mathbf{1}\{q=\text{ChatGPT}\}+\alpha_i+\gamma_t+\varepsilon_{itq}, \label{eq:ref-ratio}\tag{1}\] where the dependent variable is the share of intermediary-\(q\) information-seeking occasions for household \(i\) in week \(t\) that produce a clean referral. The dual-active restriction pairs observations from the same household and week. Household fixed effects remove time-invariant differences across panelists, while week fixed effects absorb common calendar shocks. Standard errors are clustered by household.
In this paired sample, the raw referral ratios are 8.1% for ChatGPT and 39.6% for Google, a 31.5 percentage-point (pp) difference. These means differ from the aggregate rates because the regression weights household-week-intermediary cells rather than individual information-seeking events. Adding household and week fixed effects yields \(\hat{\beta}=-0.290\) (\(SE=0.002\); Online Appendix 6.2). The modest change from the raw gap indicates that persistent household composition and common weekly conditions explain little of the difference. It does not, however, hold the underlying task fixed: even in the same week, a household may bring different information needs to ChatGPT and Google. This comparison does not separate differences in the tasks brought to each intermediary from differences created by the intermediaries. 3.2 examines those information needs using surrounding browsing.
3.2 AI search is selective in intent and destination↩︎
3.1 shows that most information-seeking occasions do not leave ChatGPT. We now examine the traffic that remains. We first use surrounding browsing to characterize the information needs households bring to each intermediary and the contexts in which ChatGPT routes. We then examine which websites receive those residual clicks and whether traffic concentrates on the same destinations across households.
3.2.0.1 User intent and conditional routing.
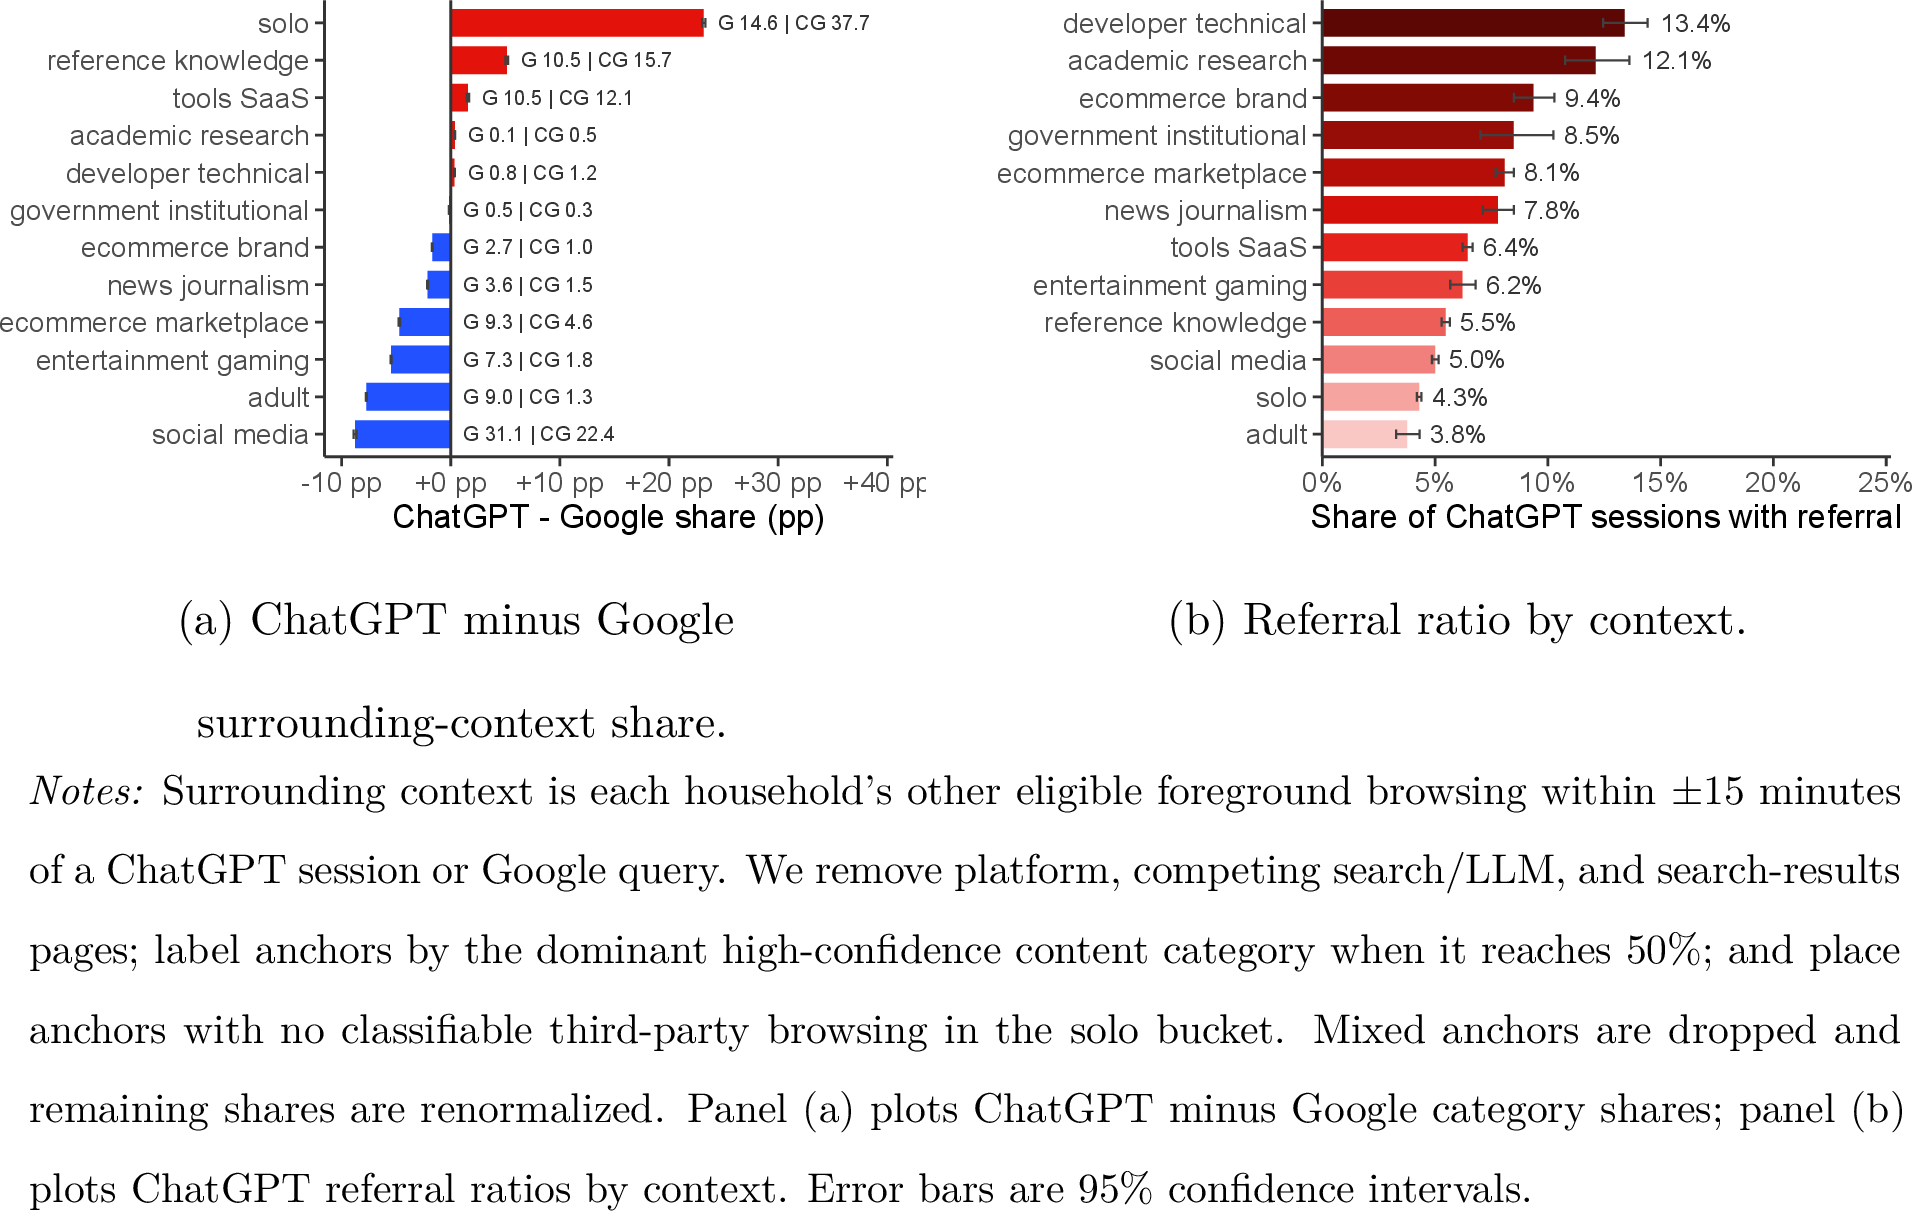
We do not observe prompt text, so we use the household’s other foreground browsing within fifteen minutes of each ChatGPT session or Google query as a behavioral proxy for intent, which we call the surrounding context. Using this taxonomy, we exclude self-referential traffic and search-results pages, then assign each anchor to the dominant content category in its surrounding context. Panel (a) of 4 compares the context mix surrounding ChatGPT and Google use. Panel (b) asks, conditional on a ChatGPT session occurring in a given context, whether that session produces a referral. Online Appendix 8 tests alternative windows, contamination rules, session gaps, and dominance thresholds.
Households use ChatGPT for a distinct mix of tasks. The largest difference is that ChatGPT sessions are far more likely to occur solo—with no other eligible browsing in the surrounding window—than Google queries (+23.1 pp), so the chat itself is often the household’s only observed task environment. ChatGPT use is also relatively concentrated in reference/knowledge (+5.2 pp) and tools/SaaS (+1.6 pp), and less concentrated in social media (\(-8.7\) pp), adult (\(-7.7\) pp), entertainment/gaming (\(-5.5\) pp), and e-commerce marketplace (\(-4.7\) pp) contexts. Conditional routing follows a different ordering. ChatGPT’s referral ratio is highest in developer/technical contexts (13.4%), academic research (12.1%), and e-commerce brands (9.4%), and lowest in adult, social, and reference/knowledge contexts. The tasks that draw households to ChatGPT are therefore not necessarily the tasks that send them back to the web: reference needs are prevalent but often retained, whereas technical and e-commerce needs are more likely to produce a click.
The surrounding-context proxy above also lets us probe task selection more directly. Adding a surrounding-context fixed effect to the same household-week comparison on the context-classifiable sample barely moves the ChatGPT coefficient, from \(-0.302\) to \(-0.300\) (\(SE=0.002\); Online Appendix 12). This check does not hold prompts or exact tasks fixed, but it shows that the broad browsing context around the occasion does not explain the routing gap.
3.2.0.2 Destination composition.
Outgoing referrals still matter because they are the observable visits that websites can attribute, monetize, and convert into audience relationships. Destination composition applies the category-share difference above to clean outgoing referral clicks. It therefore describes the traffic that exits each intermediary, not all information-seeking occasions that begin there. Relative to Google referrals, ChatGPT’s residual referrals contain more reference/knowledge websites by 13.1 pp, tools/SaaS by 8.7 pp, academic research by 5.4 pp, and developer/technical websites by 4.7 pp (5). They contain less social media by 15.8 pp and fewer ad-supported websites by 27.6 pp. The monetization tilt favors non-profit/public, freemium SaaS, and subscription websites over ad-supported and transactional destinations. This is especially consequential for visit-funded sites: AI search’s smaller referral pool also bypasses the ad-supported destinations most dependent on routed attention. AI search therefore does not distribute its smaller referral pool proportionally across the websites that traditional search served; this ordering is robust to the classifier-confidence and taxonomy choices (Online Appendix 7.3).
3.2.0.3 Concentration across the market and within households.
Concentration has different meanings at the aggregate and household levels. Aggregate concentration pools referrals across all households and asks whether total traffic converges on the same destinations. By this measure, ChatGPT’s referral pool is less concentrated than Google’s: the floor-corrected normalized Herfindahl index—which equals one when all referrals converge on a single destination and zero when they spread as evenly as the destination count allows (Online Appendix 9.1)—is between 1.87 and 3.47 times higher for Google across five support cutoffs (2). Google referrals converge on large destinations such as YouTube, Reddit, and Wikipedia. ChatGPT instead sends relatively more traffic to lower-volume academic, reference, and tool-oriented websites (6).

| Support cutoff | ChatGPT | Google/ChatGPT | |
|---|---|---|---|
| Top 100 | 0.0360 | 0.0674 | 1.87 |
| Top 1,000 | 0.0148 | 0.0396 | 2.67 |
| Top 10,000 | 0.0078 | 0.0270 | 3.47 |
| Matched support | 0.0131 | 0.0352 | 2.68 |
| Full domain set | 0.0055 | 0.0191 | 3.47 |
Household concentration asks a different question: within a household-week, how evenly does each intermediary distribute that household’s referrals across destinations? Among household-weeks with at least one or two referrals from each intermediary, the ChatGPT–Google difference is statistically indistinguishable from zero (3). At the five- and ten-referral thresholds, the difference becomes positive, indicating greater concentration among heavier ChatGPT users. The two levels reconcile through cross-household heterogeneity. Google appears concentrated in aggregate because many households converge on the same large websites. ChatGPT appears dispersed in aggregate because different households reach different specialty websites, not because each household distributes its attention more evenly. Aggregate diversification is therefore a between-household pattern rather than a within-household one. Online Appendix 9 reports support-cutoff, long-tail, and robots.txt analysis.
| \(\geq 1\) ref | \(\geq 2\) refs | \(\geq 5\) refs | \(\geq 10\) refs | |
|---|---|---|---|---|
| ChatGPT indicator | \(-0.001\) | \(0.000\) | \(0.035^{***}\) | \(0.056^{***}\) |
| (0.002) | (0.002) | (0.003) | (0.006) | |
| Mean normalized HHI, Google | 0.072 | 0.071 | 0.075 | 0.077 |
| Mean normalized HHI, ChatGPT | 0.069 | 0.070 | 0.107 | 0.130 |
| Household FE | Yes | Yes | Yes | Yes |
| Week FE | Yes | Yes | Yes | Yes |
| Observations | 48,641 | 35,644 | 12,684 | 3,721 |
Together, the surrounding-context and destination results explain how ChatGPT’s referral stream differs from Google’s. Households arrive at the AI intermediary with a different mix of information needs; click-out occurs in only some contexts; and the outgoing traffic that remains reaches a different set of websites. Different households then reach different specialty destinations, making the aggregate referral pool appear broad even when household-level attention is not. The surrounding context provides a behavioral, context-based reading of these patterns, not a prompt classification or an identified mechanism. The evidence remains consistent with both intent selection and intermediary-driven retention.
3.3 Wider AI search access reduces traditional search↩︎
The preceding results show that ChatGPT retains many information-seeking occasions and routes a different residual stream. The next question is whether wider access changes traditional search use itself. This margin matters because search queries are the source of search-advertising inventory and the starting point for many website referrals. If AI search merely adds a new channel for separate tasks, traditional search need not fall. If households substitute toward AI search, fewer information needs enter the search engines that previously routed traffic onward.
We use two complementary access-based comparisons. The preferred design pools the three access expansions and compares each treated cohort with its own reweighted \(N_{\mathrm{itt}}\) control: paid subscribers gaining access on October 31, 2024 (\(P=84\)), free logged-in users on December 16 (\(L=2{,}440\)), and anonymous browsers on February 5, 2025 (\(A=1{,}358\)). A narrower December 16 comparison contrasts logged-in users with anonymous users who gain access later; it has less power but compares households already using ChatGPT. For household \(i\), stack \(s\), and calendar week \(t\), let \(W_{ist}=t-t_s^*\) denote relative week, with \(t\) indexed in calendar weeks. We estimate \[Y_{ist}=\sum_{w\neq-1}\beta_w \mathbf{1}\{W_{ist}=w\}\operatorname{Treated}_{is} +\alpha_{si}+\gamma_{st}+\varepsilon_{ist}, \label{eq:stacked}\tag{2}\] with stack-by-household and stack-by-week fixed effects and standard errors clustered by household. The outcome is weekly Google, Bing, and Yahoo search-query loads. The pooled treated sample contains 3,882 households before demographic-completeness restrictions. Each cohort enters only its corresponding expansion stack against its own reweighted \(N_{\mathrm{itt}}\) control, defined from households clean of ChatGPT and Claude as of that expansion’s date. Online Appendix 10.1 gives the endpoint rules; Online Appendix 10.3 reports the full causal design and inference.
Wider access reduces weekly traditional search queries by 3.14 per treated household, or 9.4% of the pre-expansion mean of 33.51 (7). The event-study path is flat before access and turns negative afterward, with larger declines after sustained exposure; joint pre-trend tests fail to reject parallel trends for both the stacked design and the December 16 within-adopter comparison (Online Appendix 10.4). The cleanest single comparison—December 16 logged-in users against not-yet-treated anonymous users—shows the same negative displacement, strengthening with exposure (Online Appendix 19).

Matched-window averages show how this displacement grows with exposure (4). The preferred three-event specification reaches 17.0% after twenty weeks. The October cohort is small, and adding it barely moves the two-event estimate. A cleaner December-only comparison between two groups already using ChatGPT yields a smaller 8.2% decline after twenty weeks. We read the difference as evidence that comparisons with nonusers may retain some selection on AI adoption; the direction of the effect survives both designs, alternative controls, and an independent individual-adoption design (Online Appendix 10.7).
| Design / control | \(w\geq0\) | \(w\geq5\) | \(w\geq10\) | \(w\geq15\) | \(w\geq20\) |
|---|---|---|---|---|---|
| Dec., \(L\) vs.\(A\), reweighted | \(-4.9\%\) | \(-3.8\%\) | \(-5.5\%\) | \(-5.4\%\) | \(-8.2\%\) |
| Three-event \(N_{\mathrm{itt}}\), reweighted (preferred) | \(-9.4\%\) | \(-7.9\%\) | \(-11.3\%\) | \(-12.7\%\) | \(-17.0\%\) |
| Three-event \(N_{\mathrm{itt}}\), unweighted | \(-10.9\%\) | \(-9.5\%\) | \(-12.6\%\) | \(-14.2\%\) | \(-18.4\%\) |
The loss in referral traffic from traditional search engines falls disproportionately on informational websites. Search-engine referrals decline by 32.8% for academic research, 26.5% for reference/knowledge, 15.1% for developer/technical, and 13.4% for news/journalism destinations (8). Transactional and recreational categories show smaller or statistically indistinguishable referral changes. Total visits also decline for academic research, reference/knowledge, and news/journalism, indicating that lost search-engine referrals are not fully replaced by other observed channels. This category-level pattern is descriptive heterogeneity within the preferred design, not a separately identified mechanism.
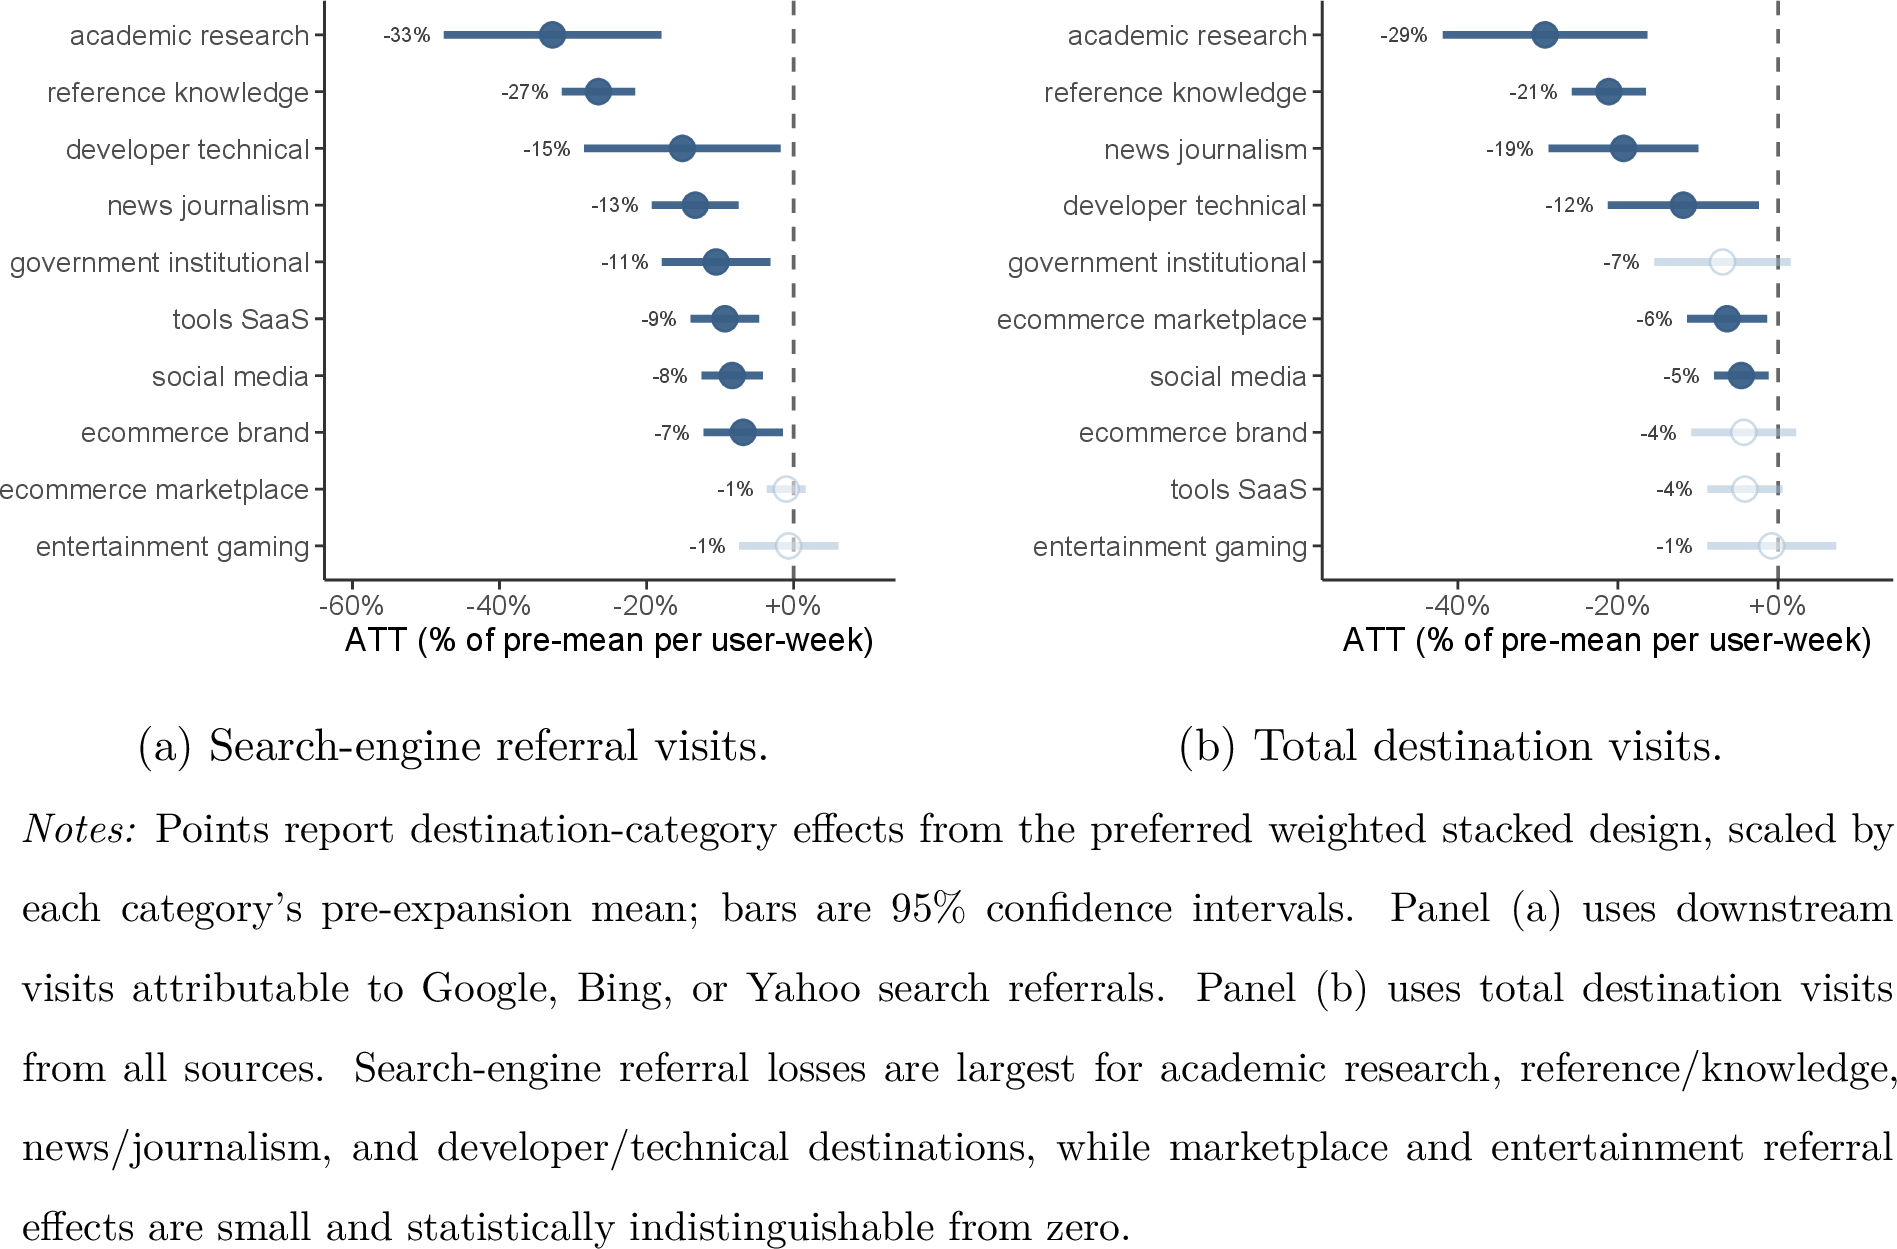
This heterogeneity connects the displacement effect to the intent results. The website categories that lose search-engine referral traffic are also the categories where households bring more informational tasks to ChatGPT and where many sessions end without a click. The pattern links retention inside ChatGPT to downstream losses in routed traffic: households use ChatGPT relatively more for informational tasks; many of those tasks remain inside ChatGPT; and wider access reduces the traditional search paths that had sent users from search engines to websites.
4 Discussion↩︎
AI search shifts the web from routing information needs to resolving them inside the intermediary. ChatGPT sends outbound referrals in only 5.2% of conversation sessions, versus 31.1% of Google queries; three-quarters of ChatGPT-active households never click out during the panel window. The remaining traffic is selective: reference and tool-oriented use is common, outbound clicks are most likely in technical and e-commerce contexts, and referrals tilt toward reference, academic, developer, and tool/SaaS destinations. Wider access to ChatGPT Search reduces traditional search queries by 9.4% on average and 17.0% after twenty weeks, with the largest referral losses in informational categories. These patterns identify the routing margin.
Routed traffic has been the web’s practical attribution system. A query becomes a visit, and that visit creates exposure, monetization opportunities, and an audience relationship that websites, advertisers, and regulators can observe. AI search weakens this record when it uses web information but satisfies the user without a referral. The shift matters for publishers, advertisers, and policy because each group relies on routed visits to value, allocate, or govern attention.
For publishers and content producers, the results show where attribution and licensing debates are most exposed. Informational content is valuable in the tasks households bring to ChatGPT, yet many of those tasks end without referrals and show the largest search-referral losses. Our estimates give these negotiations traffic benchmarks: how often sessions route, which destinations receive residual referrals, and which content categories lose traditional search traffic.
For advertisers and search marketers, the results show that AI search changes both query inventory and the locations where attention remains reachable. The access expansions reduce traditional search use most clearly for research, reference, and how-to tasks, while transactional and recreational categories change less. This evidence maps the contraction in available queries and routed attention, the margin that precedes any equilibrium adjustment in bids, prices, or channel mix.
For measurement and policy, the results show why destination-side traffic records are incomplete when an intermediary can answer without routing. User-side measures of absorbed sessions, residual referrals, and displaced search queries help discipline attribution, compensation, and traffic-sharing proposals. They clarify the economic object at stake: the redistribution of attention and commercial opportunity when an intermediary uses web information without routinely sending users onward.
The main limitations point to the next research frontier. We observe U.S. desktop behavior, not consumer surplus, publisher revenue, or long-run content investment. Future work should connect user-side behavior to platform logs, revenue records, and supply-side responses. The central dynamic question is whether content producers continue to create high-quality information at the same scale when AI search uses web content while returning fewer visits. Answering it requires measuring user value and producer incentives jointly as AI search becomes a primary gateway to online information.
Online Appendix↩︎
This online appendix documents the complete empirical pipeline behind the main paper. 5 covers panel construction, foreground-traffic cleaning, endpoint coverage, conversation sessions, the three access-expansion cohorts, ACS reweighting, and the intensive–extensive adoption decomposition. 6 defines user-side referral measurement and reconciles our referral ratios with external benchmarks. 7 documents the domain classification, destination taxonomy, confidence thresholds, manual validation, and the verbatim classification prompt. 8 tests the surrounding-browsing intent proxy across contamination rules, session gaps, window lengths, and dominance thresholds. 9 reports destination-composition and concentration robustness, including the long tail and robots.txt blocking. 10 presents the complete three-shock displacement design, balance and weighting diagnostics, alternative controls and thresholds, estimator checks, matched-window dynamics, category heterogeneity, and external validation.
5 Data construction and validation↩︎
This section documents how we convert raw Comscore URL records into the household-level panel and user-side demand events used in the paper. It proceeds from panel inclusion and foreground-traffic filters to endpoint coverage, conversation construction, and adoption margins. The treated and control cohorts and the population reweighting are inputs to the causal design and are documented with it in 10.
5.1 Panel definition and threshold sensitivity↩︎
The balanced sub-panel is the set of households, indexed by machine ID, with at least \(\tau_{\text{fg}}{=}4\) foreground records (text/html content type, http_rc in the valid set, after
applying the outflow-exclusion list) in every one of the ten months. The threshold \(\tau_{\text{fg}}{=}4\) trades off coverage against engagement: relaxing to \(\tau_{\text{fg}}{=}1\) admits \(+4{,}822\) low-activity panelists; tightening to \(\tau_{\text{fg}}{=}50\) removes \(15{,}009\)
panelists with month-to-month coefficient of variation approximately 0.92. 5 reports the marginal-user counts and cross-month coefficient of variation at each threshold.
| \(\tau_{\text{fg}}\) | n_panelists | \(+\)marginal | \(-\)marginal | avg fg/mo | CV |
|---|---|---|---|---|---|
| 1 | 50,208 | \(+\)4,822 | 0 | 577.1 | 1.084 |
| 2 | 47,967 | \(+\)2,581 | 0 | 562.8 | 1.061 |
| 3 | 46,477 | \(+\)1,091 | 0 | 606.3 | 1.042 |
| 4 (Preferred) | 45,386 | 0 | 0 | — | — |
| 5 | 44,403 | 0 | \(-\)983 | 512.3 | 1.036 |
| 10 | 41,105 | 0 | \(-\)4,281 | 571.9 | 1.010 |
| 20 | 37,057 | 0 | \(-\)8,329 | 601.4 | 0.973 |
| 50 | 30,377 | 0 | \(-\)15,009 | 651.9 | 0.922 |
The marginal users at \(\tau_{\text{fg}}{=}1\) have CV approximately 1.08 across months—they are bursty rather than habitual—whereas those at \(\tau_{\text{fg}}{=}50\) have CV approximately 0.92, indicating very stable usage. Choosing \(\tau_{\text{fg}}{=}4\) balances inclusion breadth against the cross-month-stability requirement that supports within-user identification.
5.2 Foreground filter and HTTP response codes↩︎
The raw Comscore stream is filtered to foreground traffic before any analysis. A row counts as foreground if (a) its mimetype equals text/html and (b) its HTTP response code falls in the success-or-redirect set \(\texttt{VALID\_HTTP\_RC} = \{200, 201, 202, 203, 204, 206, 301,
302, 303, 304, 307, 308\}\). The mimetype filter discards 71 other distinct mimetype values observed in the panel window, grouped broadly into scripts (application/javascript, text/x-python), images (image/png,
image/webp, image/svg+xml), fonts (font/woff2, font/ttf), audio/video (audio/mpeg, video/mp4), JSON / API responses (application/json,
application/json+protobuf, application/problem+json), server-sent-events (text/event-stream), document binaries (application/pdf, application/zip, DOCX/XLSX/PPTX OOXML strings),
form-submission types (multipart/form-data, application/x-www-form-urlencoded), header-leak artefacts (cross-origin, sameorigin, report-uri /_/bardchatui/cspreport), and a long tail of
malformed strings (1, gfet4t7, tk/lws, and base64-mangled blobs). The HTTP-RC filter excludes nonstandard codes (e.g., 299, 999) and all \(4\text{xx}/5\text{xx}\) errors. Both filters
are applied in tandem: a record is retained only if its content type is text/html and its HTTP response code is in the valid set.
5.3 ChatGPT endpoints↩︎
Comscore records the path of each network request a panelist’s browser issues—host, directory, and page—but not request bodies or authorization headers. We therefore identify ChatGPT activity by matching these paths to the platform’s internal
endpoints, whose semantics are established through public reverse-engineering of the ChatGPT web app.3 6 defines each endpoint the
paper uses—the user action that issues it and its role in our measurement. Two prefixes encode login state: backend-api/* requests carry a bearer token and so fire only for logged-in users, whereas backend-anon/* requests use a
request-level sentinel token with a CSRF cookie and identify pre-authenticated or anonymous use.4
| Endpoint | Definition and role in the paper |
|---|---|
| chatgpt.com foreground page load | GET. A user-visible page load (homepage or /c/{uuid}); the broadest but shallowest signal. Visit denominator. |
| backend-api/conversation/{uuid} | GET. The browser opening or reloading one conversation; each distinct UUID is one conversation. Conversation denominator. |
| backend-anon/conversation/{uuid} | GET. The same for anonymous sessions; negligible volume. |
| backend-api/f/conversation | POST. One logged-in message send (a newer endpoint variant that ramps Mar–Jul 2025). Message-level referral attribution. |
| backend-anon/f/conversation | POST. One anonymous message send. |
| paragen_submission | POST. A front-end submission to a paragen-routed surface (web search, Canvas, image generation, or file upload). Search-enabled proxy after filtering the contaminating non-search surfaces. |
These endpoints partition ChatGPT activity into three observability tiers—foreground page visits (broadest coverage, shallowest semantics), background backend-api endpoints, and background backend-anon endpoints—with mostly
disjoint populations. 7 reports the panel-user union over the ten-month window for each.
| Endpoint | Panel users (10-mo) | % panel | % visit |
|---|---|---|---|
| chatgpt.com foreground visits | 9,481 | 20.9 | 100.0 |
| backend-api/conversation/{uuid} | 5,265 | 11.6 | 55.5 |
| backend-anon/conversation/{uuid} | 348 | 0.8 | 3.7 |
| backend-api/f/conversation (Jul 2025) | 2,361 | 5.2 | 65.7 (Jul) |
| backend-anon/f/conversation (Jul 2025) | 936 | 2.1 | 26.1 (Jul) |
Two features of these endpoints bear on the downstream identification. First, paragen_submission is a client-side A/B-test harness that tags outputs across several surfaces—image generation, file handling, Canvas, autocompletion,
and web search—so a raw count overstates true search use. The first surfaces carry clean URL markers but web search does not, so we keep a paragen_submission hit as search-paragen only when none of these contaminating markers fires
within \(\pm 60\) s on the same household (the non-search paragen markers: images/bootstrap, image-generation bootstrap; backend-api/files, file upload and attachments; /textdocs,
Canvas text documents; and generate_autocompletions, autocompletions). The residual remains an upper bound on search use. Second, message-level attribution via f/conversation reaches analytic scale—\(6{,}056\) message-send users on the full active-household sample, against \(184\)K July sends—only in July 2025; pre-July message coverage is sparse, so the message-level referral ratio (6.1) is reported on July 2025 alone. (The panel-level coverage table above counts send-or-prepare events on the \(45{,}386\)-household balanced panel, a narrower and prepare-inclusive
population, so its f/conversation cells are not directly comparable to this all-user send count.)
5.4 Definition of a conversation session↩︎
A ChatGPT conversation session is defined by grouping all backend-api/conversation/{uuid} and backend-anon/conversation/{uuid} loads—so that both logged-in and anonymous users are included—on the same
machine_id that share a UUID, with a same-UUID gap exceeding \(3{,}600\) seconds opening a new session. We call the surviving unit a conversation session (not a raw “load”) to distinguish it from
individual page loads.
The number of distinct conversations (unique UUIDs, \(263{,}008\)) is invariant to this threshold by construction; only the merging of adjacent same-UUID loads into sessions depends on it, and that count varies only modestly with the gap (8).
| Same-UUID gap | Sessions | vs.\(1\) h |
|---|---|---|
| \(0.25\) h (\(900\) s) | 449,391 | \(+9.8\%\) |
| \(0.5\) h (\(1{,}800\) s) | 429,074 | \(+4.9\%\) |
| \(1\) h (\(3{,}600\) s, Preferred) | 409,133 | — |
| \(2\) h (\(7{,}200\) s) | 391,282 | \(-4.4\%\) |
| Distinct conversations (any gap) | 263,008 | invariant |
5.4.0.1 Per-UUID gap distribution.
The per-UUID gap distribution—the time between two consecutive loads of the same conversation UUID by the same user—is sharply bimodal. Consecutive same-UUID pairs, where no other UUID intervenes, are browser auto-refreshes and tab-focus reloads, with a median gap of \(13\) s; non-consecutive pairs, where loads of other UUIDs intervene, are genuine returns to a prior conversation, with a median gap of \(4{,}946\) s (approximately 82 min). The \(1\) h threshold sits in the valley between the two modes.
5.5 Intensive vs.extensive decomposition↩︎
ChatGPT growth across the panel window can be decomposed into an extensive margin—rising reach, a larger share of households active—an intensive margin—rising amount, more activity per active household—and a cross term (new households that arrive already highly active, the empirical signature of a feature rollout among an expanding eligibility frontier).
Formally, express volume per household. Let \(a_t = N_t/M_t\) be the share of the \(M_t\) active households reached in month \(t\)—the reach, or extensive margin—and \(\bar q_t\) the mean count per reached household—the amount, or intensive margin—where a unit is a conversation session or a search-enabled conversation. Per-household volume is \(v_t = a_t\,\bar q_t = V_t/M_t\), and between a baseline month \(b\) and an endpoint month \(e\) its change decomposes exactly as \[\Delta v = \underbrace{(a_e-a_b)\,\bar q_b}_{\text{extensive (reach)}} + \underbrace{a_b\,(\bar q_e-\bar q_b)}_{\text{intensive (amount)}} + \underbrace{(a_e-a_b)(\bar q_e-\bar q_b)}_{\text{cross}} .\] The extensive term holds the amount fixed at its baseline level and counts only the rise in reach; the intensive term holds reach fixed and counts only the rise in amount; the cross term is the interaction. Because the active-household base \(M_t\) grows month to month, normalizing by it nets out volume growth that merely reflects an expanding panel, so these per-household shares isolate genuine adoption and differ from a raw-count decomposition. 9 reports them, dividing each term by \(\Delta v\), with per-household growth multiple \(v_e/v_b\).
| Conv.sessions | Search-enabled conv. | |
|---|---|---|
| Baseline / endpoint | 2024-10 / 2025-07 | 2024-11 / 2025-04 |
| Growth multiple (per household) | 3.0 times | 45.0 times |
| Extensive share | 65.5% | 66.2% |
| Intensive share | 14.9% | 1.1% |
| Cross share | 19.6% | 32.7% |
Per-household conversation-session growth between October 2024 and July 2025 splits \(65.5\%\) extensive (reach), \(14.9\%\) intensive (amount), and \(19.6\%\) cross—new households drive most of the rise, but reached households also deepen their use. Search-enabled conversation growth is more rollout-shaped: \(66.2\%\) extensive, \(1.1\%\) intensive, and \(32.7\%\) cross at the April 2025 peak endpoint. The cross term is the second-largest component—new users running the search feature heavily upon arrival—the empirical signature of a feature rollout among a sticky audience.
The decline after April has two non-exclusive explanations. On the measurement side, the f/conversation send endpoint—negligible through April—begins appearing in May and ramps through July, reaching analytic scale only in July (5.3); the front-end changes accompanying that rollout plausibly disrupt the paragen_submission surface from which the search-enabled signal is inferred, so part of the measured decline from May onward
may be an endpoint-migration artefact rather than a genuine drop in use. Behaviorally, the later June–July fall is also consistent with seasonal disengagement. We therefore anchor the decomposition at the April peak—the last month before the
f/conversation rollout. 9 (a) plots the ChatGPT conversation-volume and search-enabled trajectories (panels (a) and (b))—each rising into the spring, with search-enabled use peaking in April and then
softening.
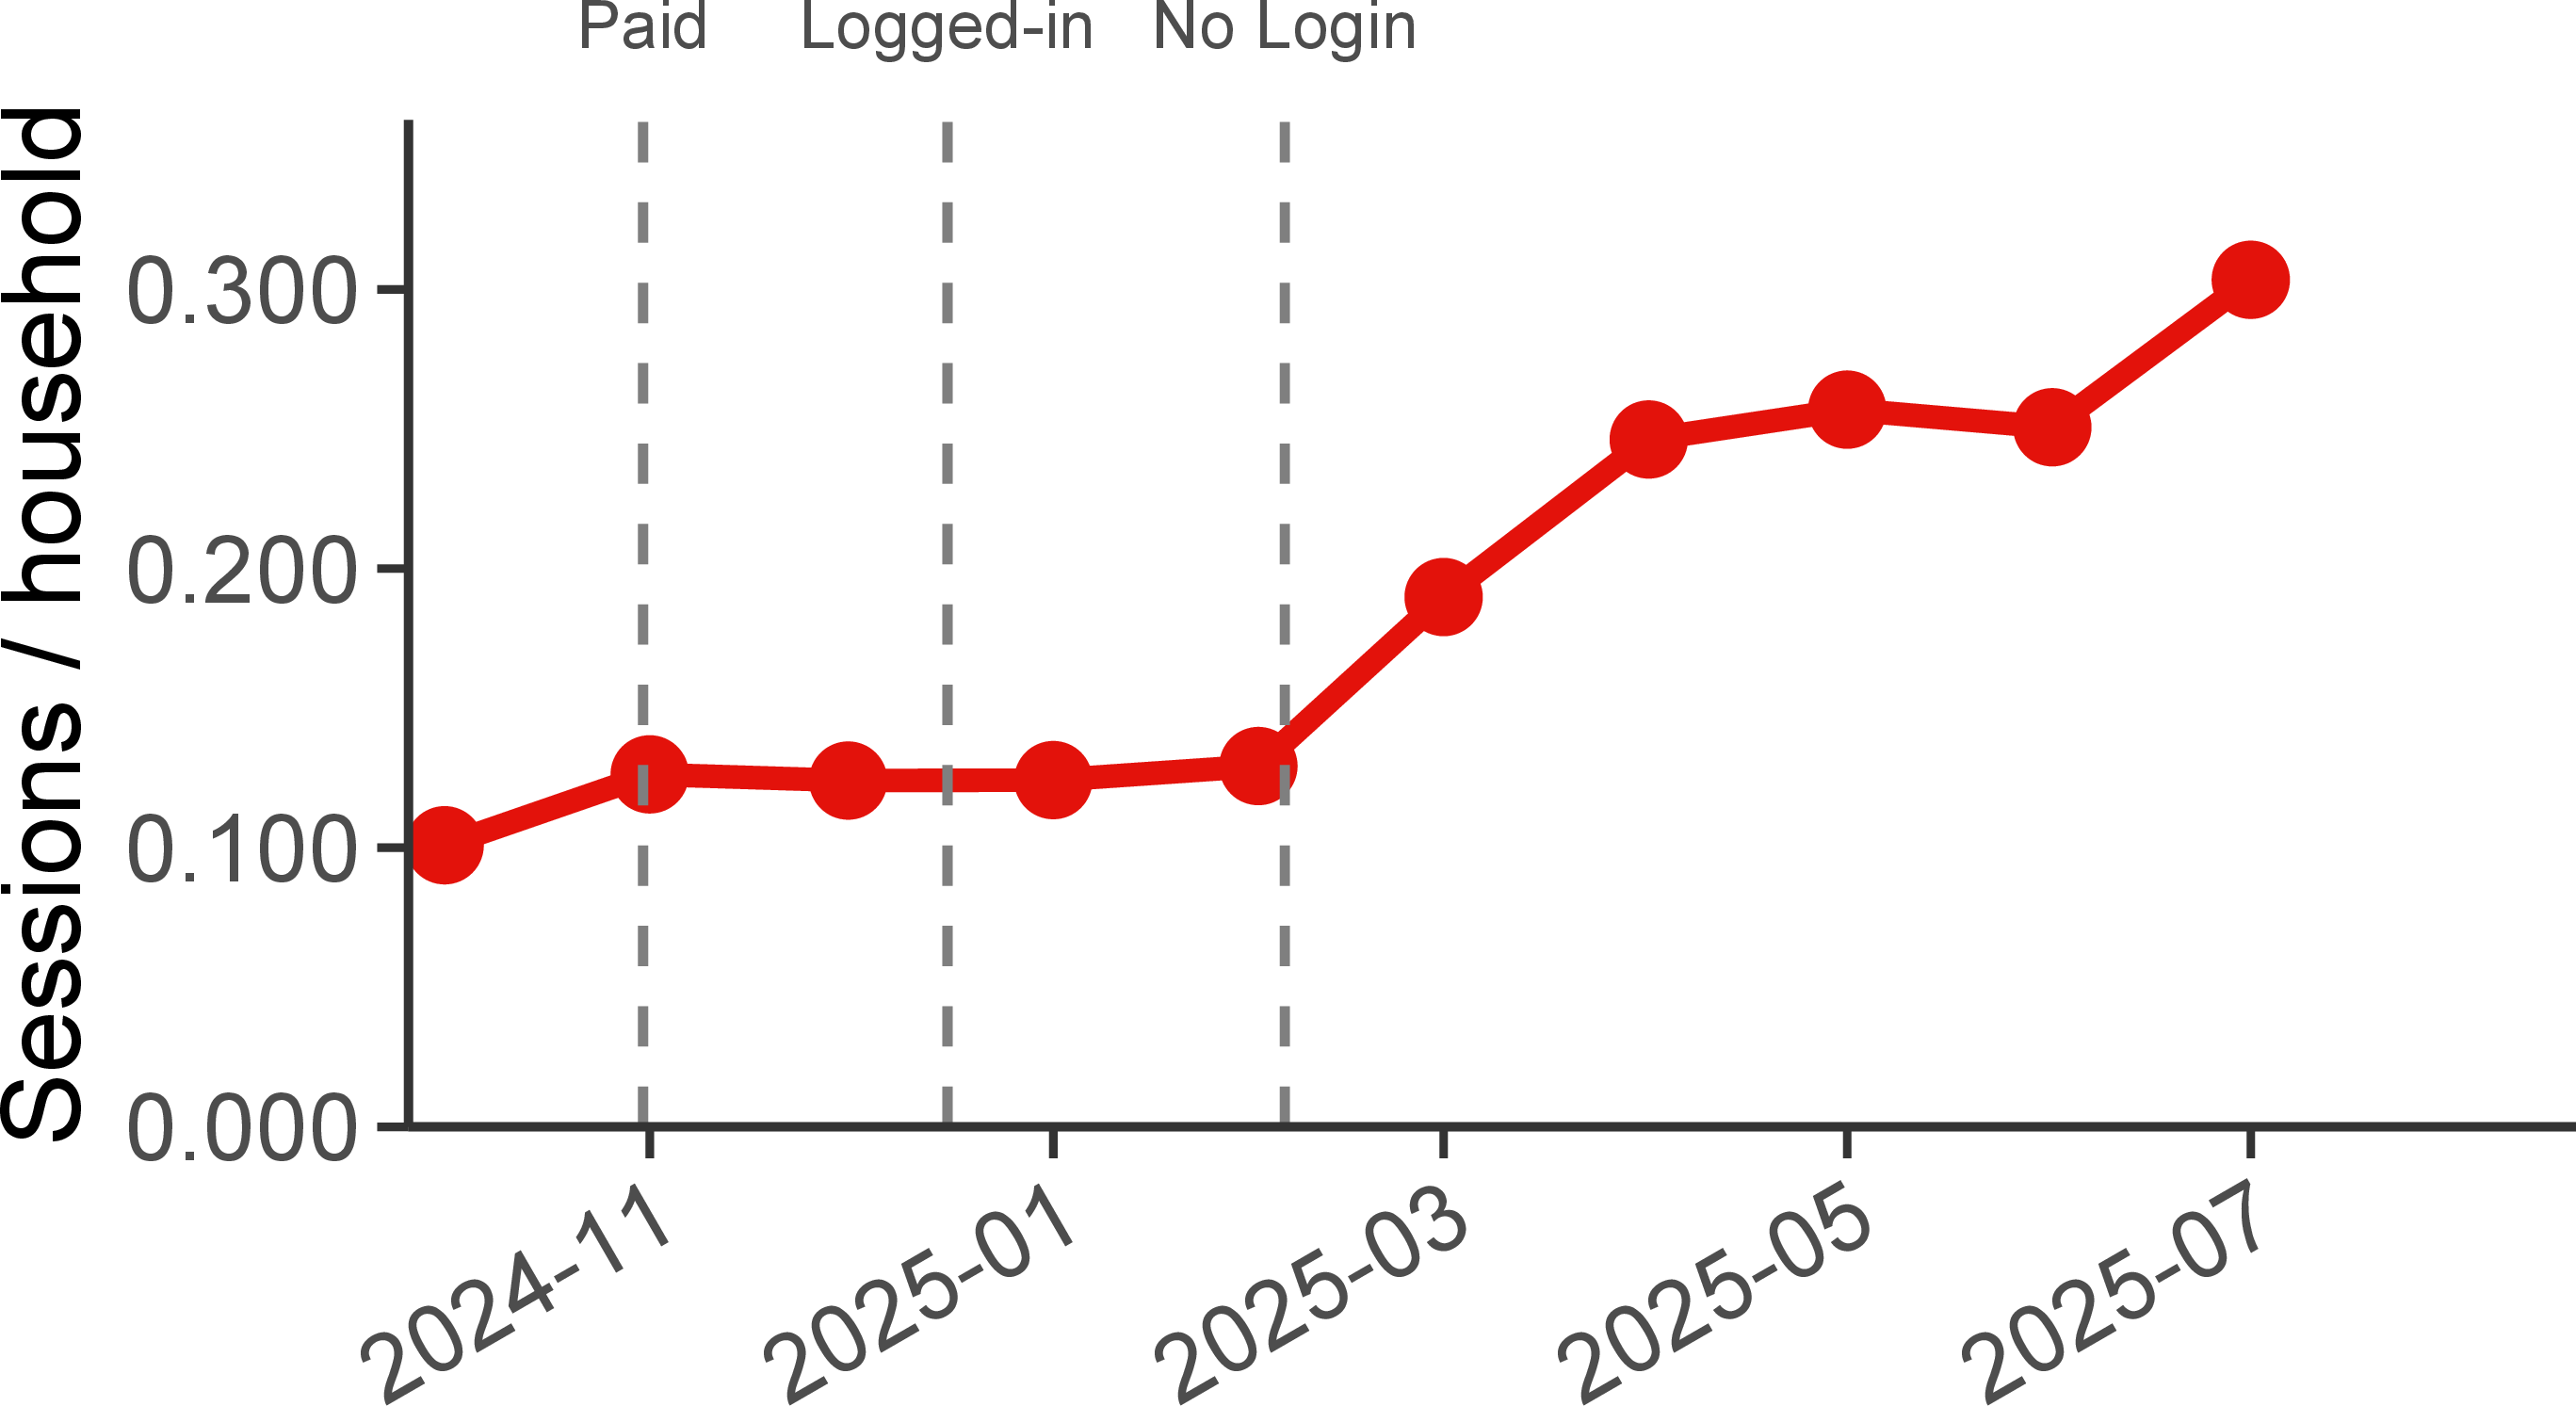
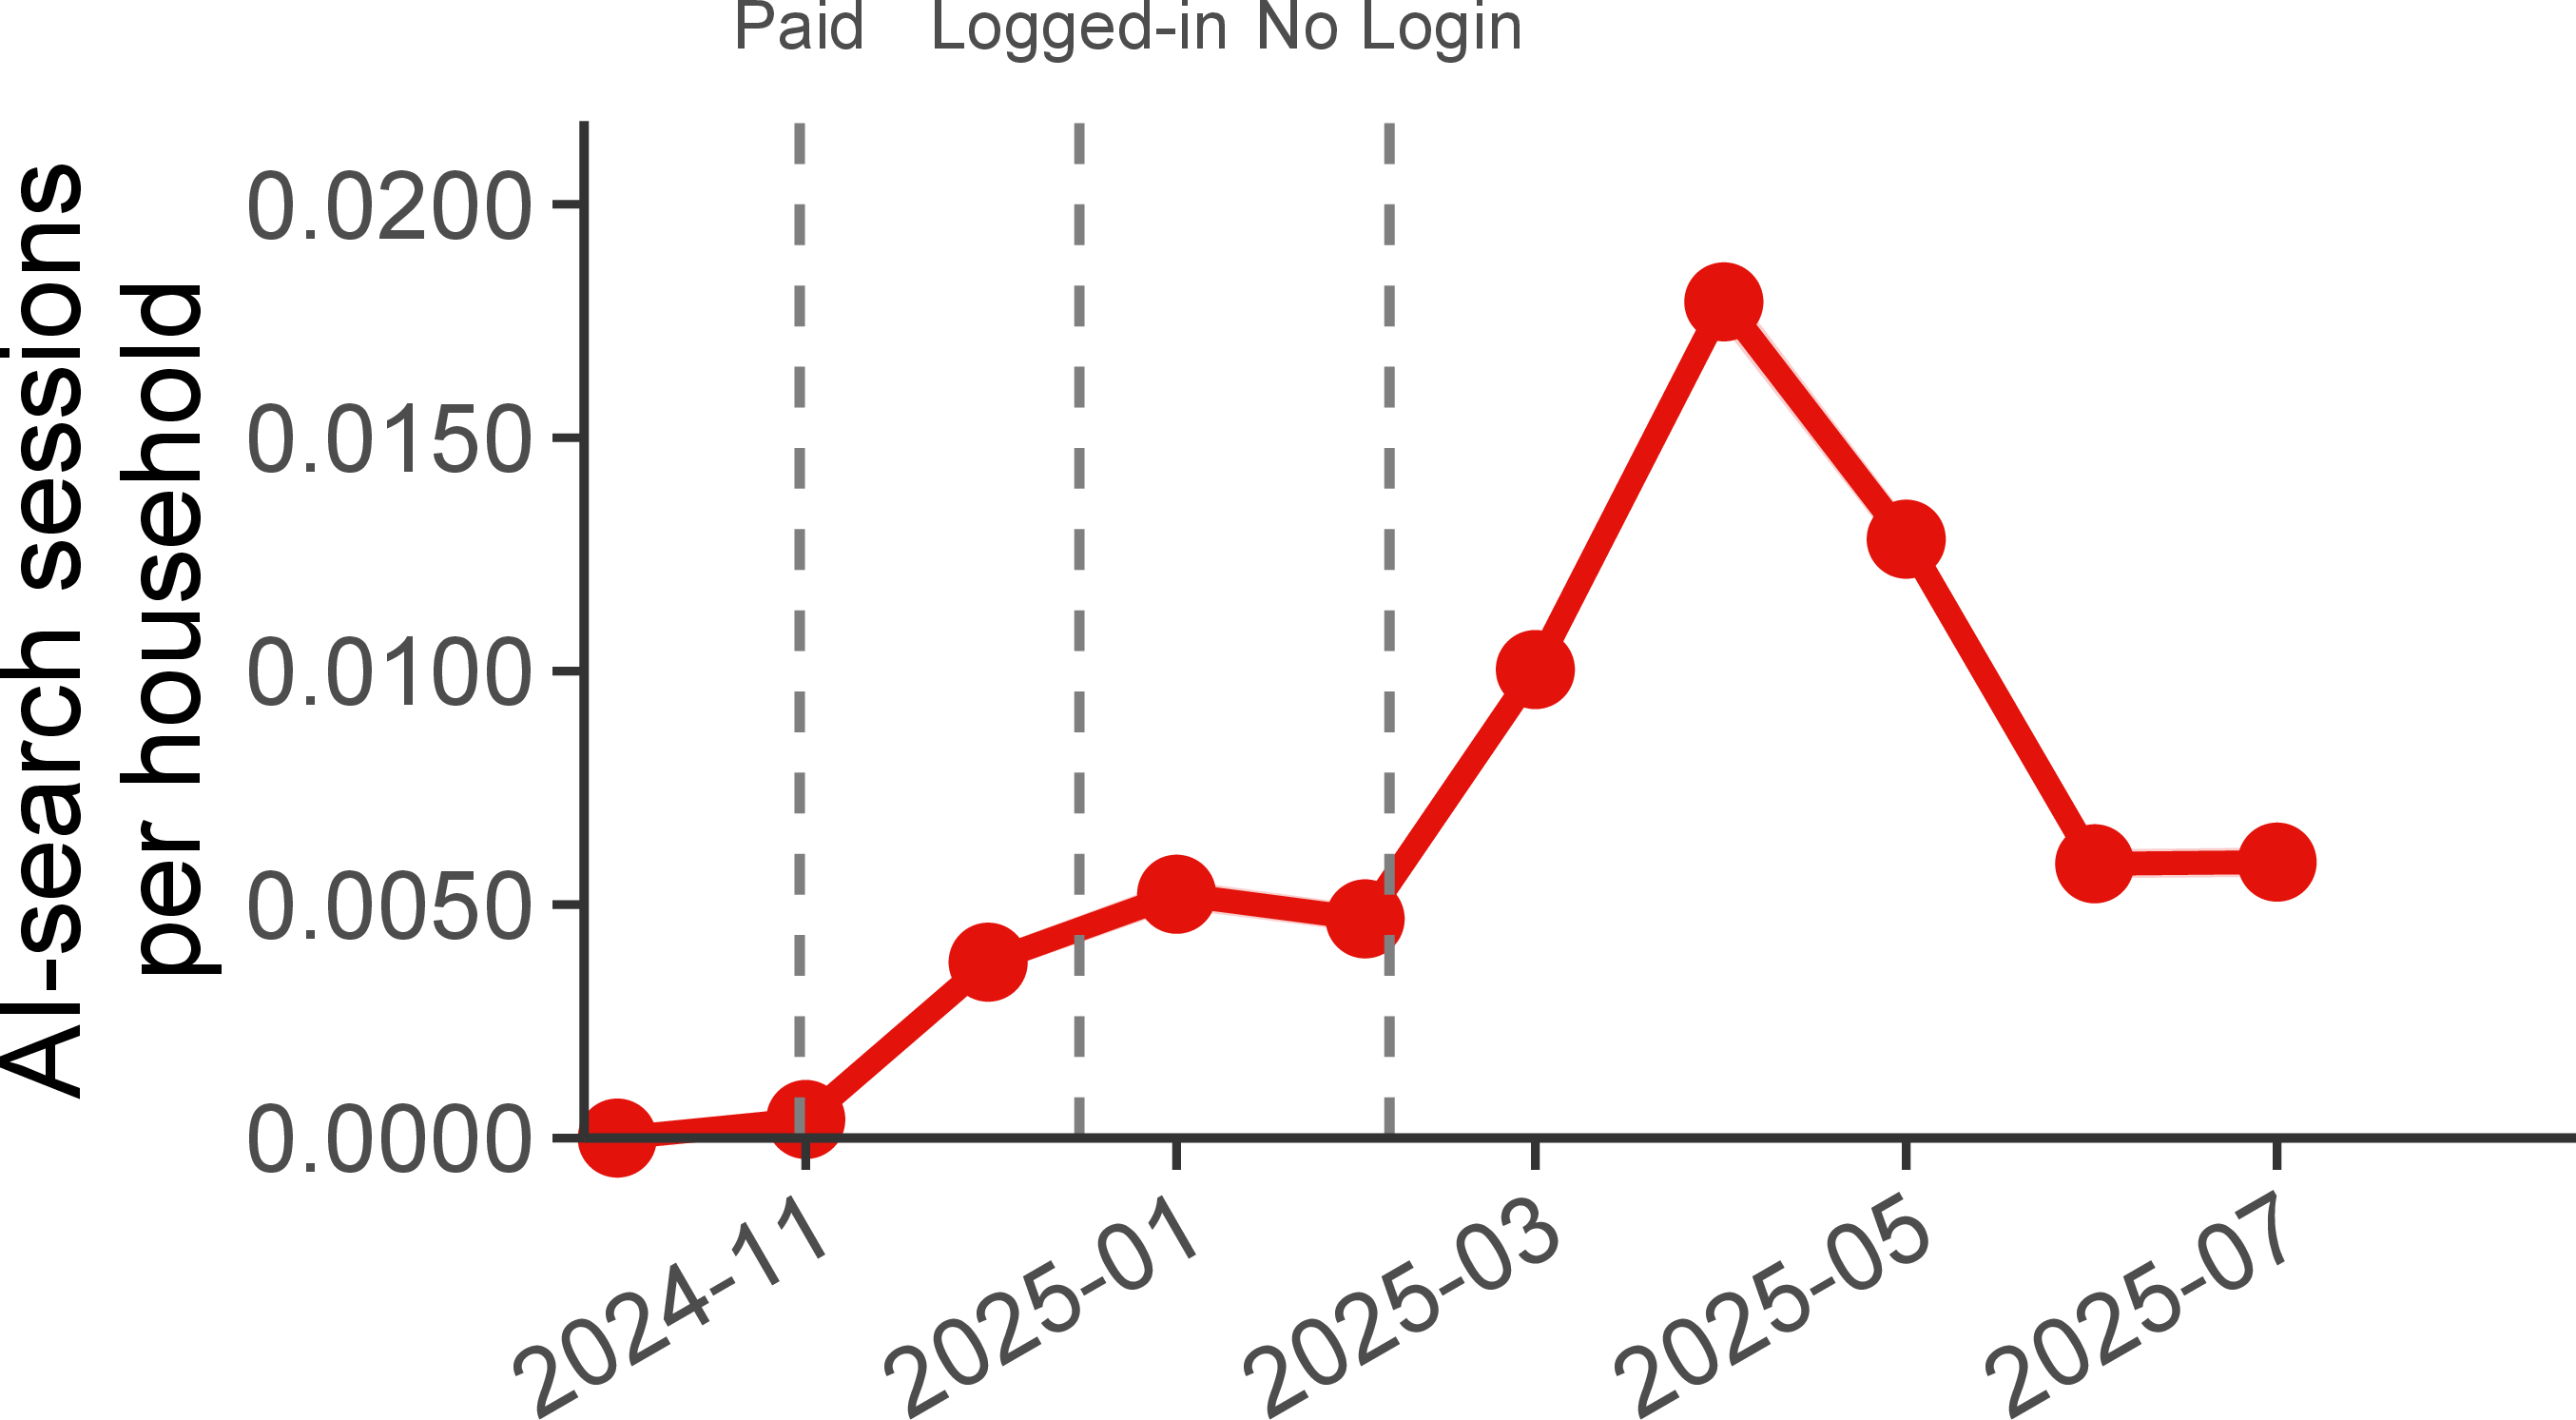
Figure 9: All conversation volume.. a — ChatGPT conversation volume and search-enabled use per active household, October 2024 – July 2025., b — Search-enabled conversations.
6 Referral measurement and industry benchmarks↩︎
This section defines a referral and the clean-referral filter (6.1), shows that the within-household referral-ratio gap is robust to household and week fixed effects (6.2), and situates the two main ratios against published industry benchmarks (6.3).
6.1 Definition of a clean referral↩︎
A referral is an outbound foreground visit to a third-party website whose HTTP referrer identifies ChatGPT or a search engine as the source. A clean referral additionally survives the exclusion filters below, which remove
self-referential traffic, platform-internal navigation, search-engine intermediation, and non-content endpoints. The referral ratio for an intermediary is the share of its user-side units—ChatGPT conversation sessions or Google
/search queries—that produce at least one clean referral; a session or query that fires several clean clicks contributes once to the numerator, so the ratio counts denominator units that produce any referral, not the total number of click
events. We report this ratio at three levels: per ChatGPT conversation session (\(5.2\%\), the main user-side unit), per Google /search query (\(31.1\%\), the symmetric
search-engine denominator), and—as a finer cross-check—per ChatGPT message send (10).
6.1.0.1 Outflow exclusion list.
A curated allow-list excludes \(147\) destination domains that are not user-navigation clicks. Five categories of exclusion:
Auth/OAuth surfaces (
microsoftonline.com,accounts.google.com)—not a destination, just an identity-provider redirect step.Platform-internal CDN/asset hosts (
oaiusercontent.com,oaistatic.com,chatgptusercontent.com,characterai.io,sora.com)—static-asset URLs internal to the LLM platform itself.Infrastructure / CDN (
browser-intake-datadoghq.com,stripecdn.com,wp.com,prodregistryv2.org,featureassets.org)—telemetry and CDN endpoints, not content.AI-tool extensions and detection-bypass utilities (
gptzero.me,quillbot.com,undetectable.ai,zerogpt.com,humbot.ai,writehuman.ai,stealthwriter.ai,originality.ai, approximately 30 in total)—browser-extension noise unrelated to the AI search substitute under study.Adware / tracker / parking clusters (approximately 70 entries; e.g.,
topodat.info,earthview3dmaps.com,onlinemanualspdf.co,adnxs-simple.com,webpkgcache.com,secure-check.co,linewize.net)—gibberish URL patterns, no real content destinations.
6.1.0.2 Search-ecosystem and same-source exclusions.
On top of the foreground filter and the OUTFLOW exclusion list, the referral filter also drops (i) the search-engine ecosystem (Google, Bing, Yahoo, and all their subdomains), including ancillary authentication and file-service endpoints such as OAuth,
asset-upload, drive.google.com, and docs.google.com—these reflect search intermediation or file transfer into the LLM rather than genuine human information-seeking; and (ii) same-source self-referrals (LLM \(\to\) LLM, search \(\to\) search).
6.1.0.3 ChatGPT referral attribution.
A foreground click is attributed to a ChatGPT conversation if its raw load timestamp falls within the inter-load window \([\texttt{load\_ts}, \texttt{next\_load\_ts})\) on the same machine. We do not require the
conversation UUID to match the destination URL—many chat.openai.com post-redirect URLs lose UUID context as users navigate, and the load-window approximation captures click-out behavior at the user level rather than the link level. The window
is not a tunable threshold: it spans the full interval between consecutive conversation loads, so every clean referral between sessions is attributed.
6.1.0.4 Search-query referral attribution.
A Google, Bing, or Yahoo /search query is the search-engine user-side unit, identified by matching the /search path on the full URL string rather than on Comscore’s parsed path components, which split the same path
inconsistently across hosts. A foreground outflow within the inter-visit window \([\texttt{visit\_ts}, \texttt{next\_visit\_ts})\) counts as a search referral—the symmetric counterpart to the conversation-load window
above.
6.1.0.5 Referral validation: referrer host and landing-page depth.
Two URL-pattern diagnostics support reading the surviving clean referrals as genuine in-interface click-outs rather than machine-initiated requests. First, the \(99.7\%\) chatgpt.com referrer share is
produced by our filters, not by the raw data (Panel A): the unfiltered ChatGPT-referred outflow is \(84.7\%\) application/json machine fetches and splits its referrer host
chatgpt.com/auth.openai.com/openai.com at roughly \(69/15/13\) percent; the foreground text/html filter removes the JSON fetches—citation prefetches, metadata and favicon
loads—and the clean-referral definition removes the authentication and marketing surfaces. This establishes interface-origin (the surviving click was issued from the conversation interface), not human-origin on its own. Second, landing-page depth—the
number of nonempty slash-delimited path segments below the host, so example.com/ has depth \(0\) and example.com/watch depth \(1\)—tracks Google closely (Panel B):
\(75.6\%\) of ChatGPT referrals reach a deep (depth \(\geq 1\)) content page versus \(81.4\%\) for Google, with an identical median depth of one. A
homepage-heavy distribution would signal navigational or brand traffic; the deep-page share instead resembles a search referral. The human-click reading rests on the conjunction of the two diagnostics, not on either alone.
| Panel A. Referrer host by filter stage (all-user, ten months) | ||
|---|---|---|
| Filter stage | chatgpt.com | Other OpenAI (such as auth.openai.com) |
| Unfiltered (any MIME) | 69.1% | 30.9% |
| Clean referral | 99.7% | 0.3% |
| Panel B. Landing-page depth | |||
|---|---|---|---|
| Intermediary | Homepage | Deep content | Median depth |
| ChatGPT | 24.4% | 75.6% | 1.0 |
| 18.6% | 81.4% | 1.0 | |
6.1.0.6 ChatGPT message-level referral ratio.
At the finer message-send granularity, the ratio is computed on individual f/conversation sends. Message coverage reaches analytic scale only in July 2025 (7); pre-July sends are too sparse to
yield a stable ratio, so we report it for July 2025 alone. 10 shows that \(1.2\%\) of logged-in sends are followed by a referral (\(0.9\%\)
within five minutes, the click-like window) and \(1.1\%\) of anonymous sends are. The message-level ratio is thus even lower than the session-level ratio and an order of magnitude below the search-engine rate, consistent
with absorption of the information-seeking occasion at the message level rather than routing it onward.
| Message sends (Jul 2025) | Sends | With referral | Ratio |
|---|---|---|---|
| Logged-in (backend-api) | 184,030 | 2,231 | 1.2% |
| within 5 min | 1,623 | 0.9% | |
| Anonymous (backend-anon) | 31,320 | 360 | 1.1% |
6.2 Within-user referral-ratio regressions↩︎
The body compares ChatGPT and Google within the same household and week using 1 , estimated on household-weeks active on both intermediaries. 11 reports the full specification ladder. The raw cross-intermediary gap of roughly 31 percentage points (pp) is essentially unchanged by household and week fixed effects: the coefficient on the ChatGPT indicator is \(-0.289\) under household fixed effects alone and \(-0.290\) under household-plus-week fixed effects. Persistent differences in who uses each intermediary and common weekly conditions therefore explain little of the routing gap.
| Specification | ChatGPT indicator | SE | Observations |
|---|---|---|---|
| Pooled OLS | \(-0.315^{***}\) | 0.001 | 2,790,136 |
| Household FE | \(-0.289^{***}\) | 0.002 | 2,790,136 |
| Household + week FE | \(-0.290^{***}\) | 0.002 | 2,790,136 |
A remaining concern is that households may bring systematically different tasks to each intermediary even within the same week. We address the observable part of this concern by adding the surrounding-context category (Online Appendix 8) as a third fixed effect, which holds the dominant content type of the household’s nearby browsing fixed. 12 reports the result. Adding the context fixed effect moves the coefficient only from \(-0.302\) to \(-0.300\), so differences in the broad type of task households bring to each intermediary do not account for the gap. The household-plus-week level differs slightly from the \(-0.290\) above for two reasons tied to the context dimension itself. First, the observation grain differs: each household-week-intermediary cell of 11 is decomposed into one cell per dominant surrounding-content type, and because cells enter the regression unweighted by activity volume, the single week-level referral share is replaced by several context-level shares whose unweighted mean need not equal it—so \(\beta\) targets a different population-weighted average even when the underlying events are identical. Second, the samples differ in support: 12 retains only activity assignable to a well-defined surrounding context, dropping search visits without an enclosing browsing session and all cells whose surrounding content is ambiguous (mixed, solo, or other), so the within-user variation that identifies \(\beta\) is drawn from a selected subset of the household-weeks in 11.
| Specification | ChatGPT indicator | SE | Observations |
|---|---|---|---|
| Pooled OLS | \(-0.329^{***}\) | 0.001 | 4,618,397 |
| Household + week FE | \(-0.302^{***}\) | 0.002 | 4,618,397 |
| Household + week + context FE | \(-0.300^{***}\) | 0.002 | 4,618,397 |
6.3 Industry benchmarks↩︎
Industry sources report a wide range of “CTR-like” numbers for ChatGPT, between \(3\%\) and \(7\%\) on per-query or bounded-session denominators, with denominator units, click definitions, and population frames that are not directly comparable. 13 collates our Preferred values alongside the closest published benchmarks.
| Source | Metric | Value |
|---|---|---|
| Ours (per query, foreground click) | Preferred, all-user | 31.1% |
| SparkToro / Datos (Jul 2024) | Clicks to open web \(/\) queries | 36% |
| Pew Research Center (Jul 2025) | Per query, \(\geq 1\) trad-link click | 15% |
| Datos (Mar 2025) | Organic CTR, US | 40.3% |
| ChatGPT | ||
| Ours (per session, all-user) | Preferred | 5.2% |
| Ours (per message, Jul 2025 pooled) | Robustness, message denominator | 1.2% |
| Peec AI | Per search | 3–5% |
| Similarweb | Conversion rate (transactional AI refs) | approximately 7% |
| Ahrefs | Outbound links \(/\) continuous visit | 1.4 |
The Ahrefs 1.4-links-per-visit number on AI is not an outlier reading of the same construct: it counts outbound links per continuous on-platform visit rather than the share of sessions producing any click-out, and counts AI-initiated outbound as “clicks.”
Read against their denominators, the benchmarks bracket our two main ratios rather than contradicting them. On the Google side, our per-query \(31.1\%\) sits inside the published per-query band: SparkToro/Datos route roughly \(36\%\) of US-query clicks to the open web, Datos’ organic CTR is \(40.3\%\), and Pew records a traditional-link click on \(15\%\) of result pages. On the ChatGPT side, our per-session \(5.2\%\) is of the same order as Peec AI’s \(3\)–\(5\%\) per-search synthesis and Similarweb’s approximately 7% transactional-referral conversion. The closest methodological analog—Semrush’s U.S.clickstream panel—reports that ChatGPT’s web-search feature is active on only \(34.5\%\) of queries as of February 2026 (down from \(46\%\) in late 2024), which caps how often an outbound referral is even possible and is consistent with a single-digit per-session click-out rate.5 The robust pattern is the cross-intermediary contrast: on every comparable denominator, ChatGPT’s propensity to send a click onward is several times lower than Google’s.
7 Domain classification↩︎
The surrounding-context, destination-composition, and displacement-by-category results rest on one measurement step—assigning each destination domain an economic label. We describe how we select the matched-support universe of 4,266 domains, what taxonomy we apply, how the labels distribute, how well the classifier’s confidence calibrates against ground truth, how the labels hold up against blind human coding, and the verbatim prompt we send to GPT-4o. Domains enter the universe by their own referral coverage rather than by editorial judgment: the Preferred universe is the union of the top-\(2{,}500\) LLM-referred and top-\(2{,}500\) search-referred domains, which captures roughly \(71\%\) of referral mass on each side.
We assign each domain two economic labels with a grounded GPT-4o classifier:
content type (12 values, the last an explicit abstention): reference knowledge, news journalism, academic research, social media, ecommerce brand, ecommerce marketplace, tools SaaS, developer technical, government institutional, entertainment gaming, adult, and other.
monetization (6 values, the last an explicit abstention): ad supported, subscription paywall, freemium SaaS, transactional, nonprofit public, and mixed other.
The classifier always returns one of these values; a domain it cannot place is labelled other or mixed_other at low confidence rather than left unlabelled. A separate unknown bucket appears in the distribution
below: it is not a model label but an out-of-band residual stamped by the post-processing code when a batch fails to parse or the API call errors, so every domain in that batch receives unknown at confidence zero.
Preferred composition uses the confidence \(\geq 0.90\) subset (\(76.1\%\) of classified domains, i.e.\(3{,}245\) domains); the relaxation to \(\geq 0.60\) shifts content-type magnitudes by \(\leq 1.5\) pp at every category without changing direction (see 7.3 below).
We run the classifier as gpt-4o (OpenAI EU endpoint eu.api.openai.com) at temperature``=``0, in batches of five domains, with a single-pass call per batch through the OpenAI Responses API; 7.4
reproduces the full prompt verbatim. The classifier may invoke a web-search tool to fetch unrecognized destinations before labelling them.
7.0.0.1 Per-dimension distribution.
14 reports the marginal distribution of content type and monetization on the \(4{,}266\)-domain matched-support universe. The unknown bucket is the out-of-band
parse/API-failure residual described above, not a model label; the model’s own abstention is other.
| content type | monetization | ||||
| Category | \(N\) | % | Category | \(N\) | % |
| reference knowledge | 803 | 18.8 | ad supported | 1,708 | 40.0 |
| tools SaaS | 686 | 16.1 | transactional | 890 | 20.9 |
| other | 490 | 11.5 | nonprofit public | 680 | 15.9 |
| ecommerce brand | 425 | 10.0 | freemium SaaS | 578 | 13.5 |
| entertainment gaming | 348 | 8.2 | subscription paywall | 248 | 5.8 |
| government institutional | 345 | 8.1 | mixed other | 137 | 3.2 |
| news journalism | 327 | 7.7 | unknown | 25 | 0.6 |
| ecommerce marketplace | 259 | 6.1 | |||
| adult | 250 | 5.9 | |||
| social media | 166 | 3.9 | |||
| academic research | 82 | 1.9 | |||
| developer technical | 80 | 1.9 | |||
| unknown | 5 | 0.1 | |||
7.0.0.2 Manual validation.
We assess whether the machine labels are trustworthy by hand-validating them against a blind human coding of a 100-domain stratified sample on the same two dimensions. The design and results are reported in 7.1 below: overall agreement is substantial-to-almost-perfect (Cohen’s \(\kappa = 0.76\) on content type, \(0.82\) on monetization).
7.0.0.3 Sample sensitivity.
The rank cutoff is a choice, and a reader should know what is lost by stopping at the top \(2{,}500\) per side. 15 traces that sensitivity: as the cutoff \(K\) rises, the share of ChatGPT and Google referral mass the sample covers rises with sharply diminishing returns.
| \(K\) | \(|\text{LLM only}|\) | \(|\text{both}|\) | \(|\text{union}|\) | LLM cov. | Search cov. | Union (LLM) |
|---|---|---|---|---|---|---|
| 500 | 344 | 156 | 844 | 0.515 | 0.578 | 0.530 |
| 1,000 | 697 | 303 | 1,697 | 0.593 | 0.635 | 0.608 |
| 2,000 | 1,399 | 601 | 3,399 | 0.680 | 0.690 | 0.696 |
| 2,500 (Preferred) | 1,766 | 734 | 4,266 | 0.711 | 0.708 | 0.726 |
| 3,000 | 2,154 | 846 | 5,154 | 0.735 | 0.722 | 0.751 |
| 5,000 | 3,658 | 1,342 | 8,658 | 0.821 | 0.760 | 0.834 |
| 10,000 | 7,545 | 2,455 | 17,545 | 0.941 | 0.807 | 0.948 |
Past \(K{=}3{,}000\) additional domains add negligible referral mass: lifting LLM coverage from \(0.73\) to \(0.95\) takes \(K{\approx}10{,}000\), and the extra domains are tail-rank destinations that contribute negligibly to either platform’s referral mass. The \(K{=}2{,}500\) cutoff sits at the joint Pareto optimum, covering approximately 70% of referrals on both sides while leaving the long, low-value tail unclassified.
7.1 Validation against human coding↩︎
To assess whether the labels behind the composition results agree with human judgment, we validate them against a blind human reference. One of the authors hand-labelled a 100-domain sample on the same two dimensions, using the same codebook, blind to the LLM labels. We draw the sample by rank-stratified random sampling (fixed seed) rather than as a top-100: the \(4{,}266\) destinations are ordered by referral count and split into a head (\(1\)–\(200\)), a middle (\(201\)–\(1{,}000\)), and a tail (\(1{,}001+\)), with \(40\), \(30\), and \(30\) domains drawn at random within each. By spreading validation across the whole size distribution rather than concentrating it in the head, the agreement statistics gauge real classifier performance across the full range of destinations rather than a handful of high-traffic, easily classified platforms. The \(100\) sampled domains span ranks \(10\)–\(4{,}082\) and carry only approximately 7.5% of total referral volume; because the head is sampled at random (\(40\) of \(200\)), the traffic-dominant mega-platforms (YouTube, Reddit, Amazon) are mostly absent. Because the sample is not self-weighting, population figures are reweighted by the known sampling fractions (reported below).
7.1.0.1 Overall agreement.
16 reports exact agreement, referral-volume-weighted agreement, and Cohen’s \(\kappa\) with a percentile-bootstrap \(95\%\) confidence interval (\(5{,}000\) resamples, fixed seed). Both dimensions reach substantial-to-almost-perfect chance-corrected agreement overall (\(\kappa = 0.76\) for content type, \(0.82\) for monetization, reading \(\kappa \in (0.61, 0.80)\) as substantial and \(\kappa \geq 0.81\) as almost perfect per [23]). Volume-weighted agreement is uniformly higher than unweighted (\(0.81\)–\(0.91\)), because disagreements concentrate on lower-traffic, ambiguous sites. This within-sample figure is not a population traffic-weighted estimate; the design-reweighted estimates appear below. In total \(30\) of \(100\) domains disagree on at least one dimension (\(17\) on content type only, \(9\) on monetization only, \(4\) on both), i.e.\(21\) content-type and \(13\) monetization disagreements.
| Subset | Dimension | \(n\) | Cats | Exact | Vol-wtd | \(\kappa\) | 95% CI |
|---|---|---|---|---|---|---|---|
| Overall | content type | 100 | 11 | 0.79 | 0.81 | 0.76 | [0.67, 0.85] |
| Overall | monetization | 100 | 6 | 0.87 | 0.91 | 0.82 | [0.72, 0.90] |
| Detectable (LLM \(\neq\) other) | content type | 88 | 11 | 0.84 | 0.84 | 0.82 | [0.72, 0.90] |
| Detectable (LLM \(\neq\) other) | monetization | 88 | 6 | 0.88 | 0.90 | 0.82 | [0.72, 0.92] |
7.1.0.2 The abstention bucket.
The codebook instructs the model to emit content type \(=\) other (confidence \(< 0.6\)) when it cannot determine what a homepage shows — an explicit abstention rather than a substantive category. The LLM abstained on \(12\) of \(100\) domains; the human independently coded \(6\) as other, and the two agreed on \(5\) (genuine agreement). A salient slice of the disagreeing abstentions is small, non-mainstream adult sites: the model recognizes and correctly labels large adult brands (adult precision \(=1.00\)) but has no training knowledge of obscure adult properties and its grounding tool will not crawl them, so it falls back to other. The remaining abstentions are the deliberately quarantined frontier-LLM domains and assorted small/ungroundable portals. These abstention-driven misses account for \(7\) of the \(21\) content-type disagreements; because they reflect missing information rather than mis-classification, the detectable subset (\(n = 88\)) is the cleaner measure of label quality where the model commits, and there both dimensions reach almost perfect agreement (\(\kappa = 0.82\)).
7.1.0.3 Where the labels diverge.
Disagreement is systematic and semantically adjacent, not random noise (17). On content type the LLM is highly precise on identifiable categories — adult, academic research, and government institutional (precision \(1.00\)), entertainment gaming (\(0.94\)), ecommerce brand (\(0.93\)), tools SaaS (\(0.92\)). On monetization, ad supported and transactional are recovered very well (F1 \(0.90\) and \(0.96\)); the one weak spot is mixed other (recall \(0.29\)), where the LLM resolves “mixed” sites to a single dominant model — coder conservatism, not an error of kind.
| Category | Support | Assigned | Precision | Recall | \(F_1\) |
|---|---|---|---|---|---|
| content type | |||||
| entertainment gaming | 25 | 17 | 0.94 | 0.64 | 0.76 |
| tools SaaS | 17 | 13 | 0.92 | 0.71 | 0.80 |
| ecommerce brand | 13 | 14 | 0.93 | 1.00 | 0.96 |
| adult | 12 | 10 | 1.00 | 0.83 | 0.91 |
| reference knowledge | 7 | 11 | 0.55 | 0.86 | 0.67 |
| other | 6 | 12 | 0.42 | 0.83 | 0.56 |
| ecommerce marketplace | 5 | 6 | 0.83 | 1.00 | 0.91 |
| news journalism | 5 | 9 | 0.56 | 1.00 | 0.71 |
| social media | 5 | 4 | 0.75 | 0.60 | 0.67 |
| government institutional | 4 | 3 | 1.00 | 0.75 | 0.86 |
| academic research | 1 | 1 | 1.00 | 1.00 | 1.00 |
| monetization | |||||
| ad supported | 43 | 48 | 0.85 | 0.95 | 0.90 |
| transactional | 25 | 23 | 1.00 | 0.92 | 0.96 |
| freemium SaaS | 11 | 12 | 0.75 | 0.82 | 0.78 |
| nonprofit public | 9 | 7 | 1.00 | 0.78 | 0.88 |
| mixed other | 7 | 3 | 0.67 | 0.29 | 0.40 |
| subscription paywall | 5 | 7 | 0.71 | 1.00 | 0.83 |
7.1.0.4 By layer and population estimates.
Because the sample is a disproportionate stratified draw, the raw averages are not population figures. 18 gives two design-aware views—i.e., estimates that correct for the disproportionate stratified sampling rather than averaging the raw sample. By rank stratum (Panel A), content-type agreement is stable down the traffic distribution (\(\kappa \approx 0.73\)–\(0.77\) everywhere), while monetization is almost perfect in the head (\(\kappa = 0.92\), where revenue models are obvious) and softens to substantial in the tail (\(\kappa = 0.71\)). Panel B reweights to all \(4{,}266\) domains: a per-domain Horvitz–Thompson estimator (inverse sampling fraction) gives \(0.77\) / \(0.79\) for content type and monetization, and a post-stratified traffic-weighted estimator gives \(0.79\) / \(0.88\). However it is weighted, content-type agreement lands at \(0.77\)–\(0.79\) and monetization at \(0.79\)–\(0.88\) across the full universe.
| content type | monetization | ||||
|---|---|---|---|---|---|
| 3-4(lr)5-6 | Exact | \(\kappa\) | Exact | \(\kappa\) | |
| Head (rank 1–200) | \(n{=}40\) | 0.80 | 0.76 | 0.95 | 0.92 |
| Middle (rank 201–1,000) | \(n{=}30\) | 0.80 | 0.77 | 0.87 | 0.80 |
| Tail (rank 1,001\(+\)) | \(n{=}30\) | 0.77 | 0.73 | 0.77 | 0.71 |
| Panel B: population estimates | content type | monetization | Coverage | ||
| Design-weighted, per-domain (Horvitz–Thompson) | 0.77 | 0.79 | 100% | ||
| Post-stratified, traffic-weighted | 0.79 | 0.88 | approximately 99% | ||
7.1.0.5 Interpretation.
The composition facts do not hinge on the adjacent distinctions that drive the residual disagreement. The groupings used in the text — e-commerce as a whole; ad-supported versus transactional; the share of referrals to UGC/social media and reference knowledge — are exactly the level at which human and machine agree most, and the disagreements cluster on within-family confusions (gaming-editorial vs.news, brand vs. marketplace, single-model vs.mixed monetization) that collapse away at that grouping. We therefore treat the LLM classification as a valid measurement instrument.
7.2 Classifier confidence: distribution and calibration↩︎
Every content-type result in the paper restricts to high-confidence labels; this section documents the confidence score and tests whether it separates correct labels from incorrect ones. The classifier emits a per-domain confidence score alongside each pair of labels. Across the \(4{,}266\) classified domains the score has mean \(0.870\) and median \(0.90\) (range \(0.0\)–\(0.99\)), and \(76.1\%\) (\(3{,}245\) domains) clear the \(\geq 0.90\) high-confidence cutoff; 19 reports the full distribution. Confidence tracks groundability: on the detectable subset (content type \(\notin\) {other, unknown}, \(n = 3{,}771\)) the model is confident — median \(0.90\), with \(82.3\%\) at \(\geq 0.90\) — whereas on the abstention/residual bucket (content type \(\in\) {other, unknown}, \(n = 495\)) confidence drops to median \(0.65\), and the \(5\) genuine unknown rows carry confidence \(0.0\). The low-confidence tail is therefore overwhelmingly the same small/ungroundable-site population that drives the abstention misses documented in 7.1.
| Confidence bin | \(N\) | % | Cumulative \(\geq\) |
|---|---|---|---|
| \(\geq 0.90\) | 3,245 | 76.1 | 76.1 |
| \(0.80\)–\(0.90\) | 487 | 11.4 | 87.5 |
| \(0.70\)–\(0.80\) | 199 | 4.7 | 92.1 |
| \(0.60\)–\(0.70\) | 108 | 2.5 | 94.7 |
| \(< 0.60\) | 227 | 5.3 | 100.0 |
7.2.0.1 Confidence calibration.
A high score is only useful if it predicts a correct label. We test this directly by joining the confidence column to the 100-domain blind-human validation sample of 7.1, which lets us ask whether the score flags the labels the model gets wrong. The sample mirrors the universe share: \(79\) of the \(100\) sampled domains are high-confidence (\(\geq 0.90\)), \(87\) at \(\geq 0.80\), and \(97\) at \(\geq 0.60\) (median \(0.90\), in line with the \(76.1\%\) universe share). 20 splits exact agreement and Cohen’s \(\kappa\) against the human coder into the high-confidence (\(\geq 0.90\), \(n = 79\)) and low-confidence (\(< 0.90\), \(n = 21\)) bins.
| content type | monetization | ||||
|---|---|---|---|---|---|
| 3-4(lr)5-6 Subset | \(n\) | Exact | \(\kappa\) | Exact | \(\kappa\) |
| Full sample | 100 | 0.790 | 0.761 | 0.870 | 0.817 |
| High-conf (\(\geq 0.90\)) | 79 | 0.835 | 0.813 | 0.861 | 0.813 |
| Low-conf (\(< 0.90\)) | 21 | 0.619 | 0.525 | 0.905 | 0.768 |
The score is well calibrated for content type: the \(\geq 0.90\) bin reaches almost-perfect agreement (exact \(0.835\), \(\kappa = 0.813\)) — essentially the detectable-subset quality — while the low-confidence tail drops to moderate (exact \(0.619\), \(\kappa = 0.525\)). The high-confidence bucket is precisely where the labels are most trustworthy, and the score correctly flags the harder approximately 21%. The score does not discriminate monetization quality: agreement is essentially flat across bins (the low-conf cell is even slightly higher on exact, lower on \(\kappa\), on \(n = 21\)). This is expected — the single per-domain confidence reflects whether the model can identify what the site is (the abstention mechanism), not how readable its revenue model is.
Because confidence discriminates content-type quality, all three content-type analyses — surrounding context, destination composition, and displacement-by-content-type — restrict to the confidence \(\geq 0.90\) subset (\(3{,}245\) domains), giving a common high-quality labeled domain set across exhibits. No monetization-specific confidence filter is applied, because confidence does not track monetization quality.
7.3 Classifier confidence and taxonomy robustness↩︎
This subsection tests whether the composition tilt is an artifact of the high-confidence filter. The Preferred content-type composition uses the confidence \(\geq 0.90\) subset of the matched-support classifier output, and relaxing the threshold to \(\geq 0.60\) admits an additional approximately 19% (about \(790\) domains), mostly tail destinations, without changing the direction or shape of the composition tilt.


Figure 10: Content type.. a — Destination-composition results survive lower classifier-confidence thresholds., b — Monetization.
7.4 Verbatim domain-classification prompt↩︎
We reproduce below the literal prompt sent to GPT-4o for the domain classification of 7, exactly as sent, so the labels can be regenerated. At run time we fill the block placeholders
{{DOMAIN_1}…{{DOMAIN_5}} with the five domains in each batch and call the OpenAI Responses API with a web_search tool enabled and temperature=0; the model may call web_search 0+ times per
batch before emitting the final JSON array. The per-domain web_search flag in the output is recovered post-hoc from the API’s tool-call events (substring matching the queried URL against batch domains, with ambiguous calls attributed
conservatively).
<instructions>
You are classifying website domains along two dimensions for an academic study of how AI search redistributes web traffic.

The taxonomy is organized around AI-search displacement risk -- how easily an LLM can answer the user's underlying need without sending the user to the destination. Groupings (reference vs. social, brand ecommerce vs. marketplace ecommerce, adult as a policy-filtered bucket, frontier LLM chatbots quarantined into "other") are chosen because they isolate quantitatively different displacement patterns in the downstream regressions.

Classify each domain along these two dimensions: content_type, monetization. Provide a one-sentence rationale and a float confidence score in [0.0, 1.0].

Label each domain based on its homepage and the primary user activity the site supports. Cite the homepage evidence behind your label in the rationale (e.g., "homepage is a feed of subreddit post cards with vote counts and comment counts"). If you cannot determine the site's function -- domain is unrecognized, parked, or multi-mode with no clear primary activity -- set content_type to "other", monetization to "mixed_other", confidence <= 0.3, and say so explicitly in the rationale. Do not guess from domain name or TLD alone.
</instructions>

<dimensions>

<dimension name="content_type">
12 values, listed alphabetically (the ordering is intentional and not a ranking).

- "academic_research": Peer-reviewed journals, preprint servers, research organizations, academic databases. Examples: nih.gov, arxiv.org, nature.com, sciencedirect.com, pubmed.ncbi.nlm.nih.gov.
- "adult": Explicit-content sites. Quarantined into its own category because the AI-Google gap on adult content is a policy artifact (LLMs filter by design) not an organic compositional difference; mixing it with other buckets contaminates the substantive findings. Examples: pornhub.com, xvideos.com, xhamster.com, onlyfans.com.
- "developer_technical": Code repositories, package registries, developer documentation, technical reference for programmers. Examples: github.com, npmjs.com, developer.mozilla.org, stackoverflow-for-teams-style docs.
- "ecommerce_brand": Manufacturer / direct-to-consumer sites selling their own goods or services. The site's catalog is its own brand. Examples: nike.com, apple.com, patagonia.com, tesla.com.
- "ecommerce_marketplace": Multi-seller marketplaces and broad-line retailers that aggregate third-party or multi-brand catalogs. Examples: amazon.com, ebay.com, etsy.com, walmart.com, target.com.
- "entertainment_gaming": Gaming sites, mod communities, fan-fiction archives, play-focused destinations. **Also includes any wiki, encyclopedia, or database whose entire scope is one game, game franchise, or game series -- even when the homepage looks like a general reference index. A "wiki" or "db" or ".wiki" / "*pedia.net" / "*db.net" domain devoted to a single game belongs here, NOT in reference_knowledge.** Examples: steamcommunity.com, fandom.com, nexusmods.com, gamebanana.com, gta5-mods.com, ign.com when gaming-only, runescape.wiki, stardewvalleywiki.com, pokemondb.net, bulbagarden.net (Pokemon), paradoxwikis.com, minecraft.wiki, terrariawiki.org, oldschool.runescape.wiki.
- "government_institutional": .gov sites, public-service portals, international institutions, authoritative policy/regulatory sources. Examples: irs.gov, cdc.gov, usa.gov, europa.eu, who.int.
- "news_journalism": Original reporting, current news, opinion, and editorial commentary consumed as timely/topical content. Examples: nytimes.com, reuters.com, apnews.com, bbc.com, forbes.com.
- "other": Three distinct uses. (a) **Frontier general-purpose LLM chatbots, AI-search assistants, multi-LLM aggregator chatbots, and persona-based / companion AI chatbots** whose primary product IS the conversational AI. Covers (i) general-purpose assistants (chatgpt.com, openai.com, claude.ai, gemini.google, perplexity.ai, pplx.ai, deepseek.com, ollama.com), (ii) multi-LLM aggregator wrappers (chaton.ai, monica.im, iask.ai, toolbaz.com), and (iii) persona / companion / roleplay AI chatbots where users converse with AI-generated characters even when the homepage shows a UGC-character feed (character.ai, polybuzz.ai, spicychat.ai, replika.ai, dream.ai, woebothealth.com, and similar). These are all the AI-search substitute being studied; bucketing them across "tools_saas" / "social_media" / "entertainment_gaming" would scatter the AI substitute across multiple buckets and dilute the very category the analysis treats as the substitute. Use confidence >= 0.9 here. (b) **AI-only single-purpose generators** for image / video / voice / music / avatars whose entire product is the AI generation step (midjourney.com, runwayml.com, suno.com, udio.com, elevenlabs.io, openart.ai, leonardo.ai, ideogram.ai, invideo.io, synthesia.io, heygen.com, descript.com, fliki.ai, pika.art, lalal.ai, soundraw.io, craiyon.com, aiva.ai, magicstudio.com, aistudios.com, maxstudio.ai, and similar). They are AI-substitution-adjacent destinations whose displacement dynamics belong with category (a), not with general productivity SaaS. Use confidence >= 0.9 here. Note: domain-specific tools that *embed* AI features but whose primary product is the underlying tool (Grammarly, Canva, Notion, Adobe Photoshop, SodaPDF, Zoom) stay in "tools_saas". (c) Domains the homepage cannot pin down (unrecognized, parked, multi-mode with no clear primary activity). Use confidence < 0.6 here.
- "reference_knowledge": Encyclopedic, how-to, dictionary, tutorial, or general reference content consumed as timeless lookup. **Also includes education-purpose platforms even if their business model is SaaS** -- learning management systems (Canvas/instructure.com, Schoology, Blackboard, Ellucian, Clever, ClassLink, PowerSchool, Jupitered), homework / study tools (Chegg, Quizlet, Quizizz, Mathway, Symbolab, WolframAlpha, Desmos, GeoGebra, Turnitin, Duolingo), K-12 adaptive-learning platforms (IXL, Edgenuity, DreamBox, Prodigy, Kahoot), tutoring marketplaces (Preply, Wyzant, italki, Cambly, Outschool), exam proctoring (Honorlock, ProctorU, Respondus), MOOCs and online courses (Coursera, edX, Udemy, Cengage, McGraw-Hill), education publishers (Pearson), and student career platforms (Handshake). The user's purpose at all of these is learning / coursework / education-knowledge lookup, not productivity tooling. **Also includes hospitals and health publishers** (mayoclinic.org, clevelandclinic.org, webmd.com, healthline.com, drugs.com, medlineplus.gov, kidshealth.org): their homepages present a health-reference index (symptoms, conditions, drugs, tests), not an institutional/government portal -- bucket them with reference_knowledge, NOT government_institutional, even when the .org TLD and clinic branding suggest "institution". Examples: wikipedia.org, wikihow.com, britannica.com, dictionary.com, instructure.com, khanacademy.org, chegg.com, coursera.org, edgenuity.com, ixl.com, preply.com, mayoclinic.org, webmd.com.
- "social_media": All social and consumption-on-platform UGC and streaming sites -- text-first social/Q&A/threaded discussion *and* rich-media (video, audio, image-centric) UGC and professional streaming libraries. The user is on the platform either to read/post text or to watch/listen; consumption typically requires the platform. Examples: reddit.com, quora.com, stackoverflow.com, x.com, twitter.com, facebook.com, linkedin.com, youtube.com, instagram.com, tiktok.com, spotify.com, netflix.com, twitch.tv.
- "tools_saas": Productivity tools, web apps, utilities, design tools, SaaS dashboards used for general work -- *not* education or learning, *not* frontier LLM chatbots, and *not* AI-only single-purpose generators. The user uses or logs into a tool. Examples: canva.com, grammarly.com, notion.so, zoom.us, docs.google.com. Note: education-SaaS (LMS, study tools, MOOCs, homework helpers, K-12 learning platforms, tutor marketplaces, exam proctoring) goes to "reference_knowledge"; frontier general-purpose LLM chatbots and AI-only single-purpose generators go to "other" (see below); Shopify storefronts and the merchant tooling at shopify.com / *.myshopify.com go to "ecommerce_marketplace".
</dimension>

<dimension name="monetization">
6 values, listed alphabetically (the ordering is intentional and not a ranking).

- "ad_supported": Default for any free-to-access site whose dominant homepage revenue signal is advertising (display ads, video pre-rolls, sponsored content units, ad slots in feeds). **A low-uptake premium tier -- "remove ads", YouTube Premium, Quora+ -- does NOT promote the site to mixed_other.** The premium tier has to materially co-fund the site, not just exist as an optional upsell. Examples: cnn.com, weather.com, youtube.com, quora.com, fandom.com, allrecipes.com, reddit.com. NOTE: if the site is a SaaS app with visible pricing tiers (spotify, dropbox, notion), use freemium_saas / subscription_paywall instead -- those are matched earlier in the monetization decision tree below.
- "freemium_saas": Functional free tier plus paid upgrade (SaaS or app). Examples: spotify.com, notion.so, grammarly.com, chatgpt.com, dropbox.com.
- "mixed_other": Reserved for sites with TWO OR MORE roughly equal revenue streams visible on the homepage. Use only when the secondary stream is substantial -- a metered paywall most readers hit, marketplace commissions on a multi-revenue platform, in-app commerce comparable to ad revenue. NOT a fallback for "doesn't fit elsewhere". Examples: nytimes.com (metered paywall reaches a large share of readers), twitch.tv (ads + subs + bits + commerce), bandcamp.com (commerce + ad-free streaming).
- "non_profit_public": Foundation-funded, government-funded, .edu, .gov, hospital/clinic non-profits. Examples: wikipedia.org, nih.gov, usa.gov, mayoclinic.org, clevelandclinic.org, hopkinsmedicine.org. **NOT for commercial health publishers (webmd.com, healthline.com, drugs.com) -- those run on ad revenue; bucket those as monetization=ad_supported even though their content_type is reference_knowledge under the hospital/health exception.**
- "subscription_paywall": Recurring fee for access, whether metered or hard paywall. Examples: wsj.com, ft.com, netflix.com, disneyplus.com.
- "transactional": Revenue from on-site goods or services sales (shopping cart, booking flow, checkout). Examples: amazon.com, nike.com, walmart.com, expedia.com, doordash.com.

Monetization decision tree -- apply top-to-bottom and stop at the first match:
  1. Shopping cart / booking / checkout on homepage -> "transactional"
  2. Hard paywall (no free articles visible) -> "subscription_paywall"
  3. SaaS pricing tiers visible, free tier exists -> "freemium_saas"
  4. SaaS pricing tiers visible, no free tier -> "subscription_paywall"
  5. Foundation/non-profit/.gov/.edu/hospital footer with no ads or commerce -> "non_profit_public"
  6. Visible ads + free content (any "premium" tier is optional/secondary) -> "ad_supported" (default)
  7. Metered paywall OR substantial second stream comparable to the first -> "mixed_other"
</dimension>

</dimensions>

<decision_tree>
Apply these steps in order.

STEP 1 -- Evidence about the homepage.
  What does the homepage show -- navigation, headlines, product tiles, login/paywall copy, footer, about? If the domain is unrecognized, parked, empty, or redirects to an unrelated placeholder -> content_type = "other", confidence <= 0.3, note it in rationale. STOP the content_type decision here.

STEP 2 -- Apply the adult filter first.
  If the homepage displays explicit adult content -> content_type = "adult". Do not reach for any other content_type. Continue to monetization normally.

STEP 3 -- What is the primary user activity on the site?
  3a. Looking up timeless reference, how-to, dictionary, or encyclopedic content -> "reference_knowledge".
  3b. Reading current news, original reporting, opinion, or editorial -> "news_journalism".
  3c. Reading peer-reviewed research, preprints, or academic databases -> "academic_research".
  3d. Browsing/posting on social, Q&A, threaded discussion, broadcast feeds, professional networks, or watching/listening on UGC/streaming media platforms (reddit, quora, stackoverflow, x/twitter, facebook, linkedin, youtube, instagram, tiktok, spotify, netflix, twitch) -> "social_media".
  3e. Buying from a single brand's own catalog -> "ecommerce_brand".
  3f. Buying across a multi-seller marketplace or broad-line retailer -> "ecommerce_marketplace".
  3g. Using a web app, productivity tool, or logging into a SaaS dashboard -> "tools_saas".
  3h. Visiting a code repo, package registry, or developer documentation -> "developer_technical".
  3i. Accessing a government/.gov/public-service portal or institutional authority -> "government_institutional".
  3j. Browsing gaming, fandom wiki, fan-fiction, or mod communities -> "entertainment_gaming".
  3k. Site's primary product is a frontier / general-purpose LLM chatbot or AI-search assistant (ChatGPT, Claude, Gemini, Perplexity, DeepSeek, Ollama, and similar) -> "other" (confidence >= 0.9, study-design quarantine).
  3l. Nothing above fits, or evidence is insufficient -> "other" (confidence < 0.6).

STEP 4 -- Resolve disambiguation with the rules below.

STEP 5 -- Pick monetization using the monetization decision tree above (shopping cart -> transactional -> hard paywall -> subscription_paywall -> SaaS tiers -> freemium_saas / subscription_paywall -> non-profit footer -> non_profit_public -> free + ads -> ad_supported -> multiple substantial streams -> mixed_other).

STEP 6 -- Calibrate confidence.
  0.9-1.0: homepage evidence is unambiguous (clear masthead, clear product catalog, clear login/paywall, clear .gov header).
  0.6-0.9: homepage evidence is suggestive but requires inference across multiple signals, or the domain is multi-mode and you had to pick a primary mode.
  <0.6: homepage was thin, ambiguous, behind auth, parked, or contradictory. Use content_type = "other" rather than guessing at a specific label.
</decision_tree>

<disambiguation_rules>
The most confusable boundaries, all resolved from observed homepage evidence.

tools_saas vs. other (frontier LLM and generative-AI exceptions):
  - Frontier general-purpose LLM chatbots and AI-search assistants whose primary product IS the conversational AI -- chatgpt.com, openai.com, claude.ai, gemini.google, perplexity.ai, pplx.ai, deepseek.com, ollama.com -> "other". These are the AI-search substitute being studied; quarantining them keeps tools_saas from absorbing the category the analysis treats as the substitute. Confidence >= 0.9 -- this is a study-design rule, not an evidence-thin guess.
  - Multi-LLM aggregator chatbots (chaton.ai, monica.im, iask.ai, toolbaz.com) -> "other". Same logic: primary product is the conversational AI, just routed through multiple back-end models.
  - Persona-based / companion / roleplay AI chatbots where users converse with AI-generated characters (character.ai, polybuzz.ai, spicychat.ai, replika.ai, dream.ai, woebothealth.com) -> "other". The homepage may show a UGC-style character gallery, but the primary user activity is still chatting with an LLM-generated agent -- they are AI-substitution-adjacent and belong with the other conversational chatbots, not with social_media or tools_saas.
  - AI-only single-purpose generators for image / video / voice / music / avatars (Midjourney, Runway, Suno, Udio, ElevenLabs, OpenArt, Leonardo, Ideogram, InVideo, Synthesia, HeyGen, Descript, Fliki, Pika, Lalal, Soundraw, Craiyon, AIVA, MagicStudio, AIStudios, MaxStudio) -> "other". Their entire product is the AI-generation step, so they are AI-substitution-adjacent and belong with the conversational chatbots, not with productivity SaaS.
  - Domain-specific tools that *embed* AI features but whose primary product is the underlying tool (Grammarly, Canva, Notion, Adobe Photoshop, SodaPDF, Zoom) -> "tools_saas".

ecommerce_brand vs. ecommerce_marketplace:
  - Single-brand catalog selling its own goods (homepage shows one brand, one product line) -> "ecommerce_brand". Examples: nike.com, apple.com, patagonia.com.
  - Multi-seller marketplace or broad-line retailer (homepage shows many brands, category navigation across unrelated product classes) -> "ecommerce_marketplace". Examples: amazon.com, ebay.com, walmart.com, etsy.com, target.com.

news_journalism vs. reference_knowledge:
  - Read as current/topical (articles with datelines, running headlines, opinion pieces, reviews) -> "news_journalism".
  - Looked up as timeless reference (dictionary entries, how-to articles, wiki pages, encyclopedic entries, health-condition pages) -> "reference_knowledge".
  - Health/finance reference with paid writers (webmd.com, healthline.com, investopedia.com) -> "reference_knowledge" when homepage is a reference index, not a news feed.

reference_knowledge vs. academic_research:
  - General reference or encyclopedic (wikipedia, britannica, wikihow) -> "reference_knowledge".
  - Peer-reviewed, preprint, or research-org primary sources (arxiv, nature, nih.gov research pages) -> "academic_research".
  - Edge: pubmed, sciencedirect -> "academic_research".

reference_knowledge vs. tools_saas (education exception):
  - LMS (Canvas/instructure, Schoology, Blackboard, Ellucian, Clever, ClassLink, PowerSchool, Jupitered), study tools (Chegg, Quizlet, Quizizz, Mathway, Symbolab, WolframAlpha, Desmos, GeoGebra, Turnitin, Duolingo), K-12 adaptive-learning platforms (IXL, Edgenuity, DreamBox, Prodigy, Kahoot), tutor marketplaces (Preply, Wyzant, italki, Cambly, Outschool), exam proctoring (Honorlock, ProctorU, Respondus), MOOCs (Coursera, edX, Udemy, Cengage, McGraw-Hill), education publishers (Pearson), student career platforms (Handshake) -> "reference_knowledge". The user's purpose at these is learning or coursework, not productivity tooling -- even though the business model is SaaS.
  - General productivity SaaS / design tools (Canva, Notion, Grammarly, Zoom, Slack, Figma) -> "tools_saas".

social_media (text-first social and rich-media UGC/streaming, merged):
  - Both text-first social (reddit, quora, stackoverflow, twitter/x, facebook, linkedin) and rich-media UGC/streaming (youtube, tiktok, instagram, spotify, netflix, twitch) -> "social_media". The previous split between "social_platform" and "media_content" has been merged: both buckets describe consumption-on-platform UGC/streaming, and the analytical contrast that matters now is social_media vs. reference_knowledge / news_journalism, not text-vs-media within social_media.
  - Adult sites still go to "adult", not "social_media" (adult filter applied first per Step 2).

developer_technical vs. tools_saas:
  - Code repos, package registries, API docs, developer-specific reference (github, npmjs, pypi, MDN, docs.python.org) -> "developer_technical".
  - General SaaS dashboards, productivity web apps, design tools (canva, notion, grammarly, zoom) -> "tools_saas".

government_institutional vs. reference_knowledge:
  - .gov, .mil, .int, public-service portals, regulatory/tax agencies -> "government_institutional".
  - Encyclopedic or how-to content on a .org or .com that happens to be non-profit -> "reference_knowledge".
  - **Hospitals and health publishers (mayoclinic.org, clevelandclinic.org, webmd.com, healthline.com, drugs.com, medlineplus.gov, kidshealth.org) -> "reference_knowledge", NEVER government_institutional.** Their homepages present a health-reference index (symptoms, conditions, drugs, tests), not an institutional service portal. The .org TLD and clinic branding are not sufficient evidence for government_institutional. Research arms of NIH etc. -> "government_institutional" or "academic_research" depending on homepage.

ecommerce_marketplace vs. tools_saas:
  - Homepage shows shopping cart, product grid, prices -> "ecommerce_marketplace" (or "ecommerce_brand").
  - Homepage shows "sign in", tool interface, or SaaS pricing tiers -> "tools_saas".
  - **Shopify exception**: shopify.com (the merchant SaaS landing page) and *.myshopify.com (the per-merchant storefront subdomain) -> "ecommerce_marketplace". Even though shopify.com markets a SaaS to merchants, end-user panel traffic to shopify.com is dominated by buyer-side checkout flows, and *.myshopify.com tenant subdomains ARE storefronts. Bucketing these as marketplace destinations matches what panelists actually do at the URL.

entertainment_gaming vs. social_media:
  - Gaming storefront / fandom wiki / mod community / fan-fiction archive -> "entertainment_gaming".
  - Video/audio/image streaming or text/Q&A social on a general consumer platform (including Twitch live-streaming and gaming-adjacent text discussion on twitter/reddit) -> "social_media".

entertainment_gaming vs. reference_knowledge (game-specific wikis/databases):
  - General-purpose reference, encyclopedia, or how-to (wikipedia, britannica, wikihow, dictionary.com) -> "reference_knowledge".
  - **Wiki, encyclopedia, or database whose entire scope is a single game, franchise, or game series (runescape.wiki, stardewvalleywiki.com, pokemondb.net, bulbagarden.net, paradoxwikis.com, minecraft.wiki) -> "entertainment_gaming", NOT reference_knowledge.** The site is reference-shaped but the topic is play, not general knowledge. The "*.wiki" / "*db.net" / "*pedia.net" pattern does not save it for reference_knowledge if the scope is a single game.
</disambiguation_rules>

<examples>
14 reference classifications covering the 12 categories and the major split cases (hospital exception, Shopify exception, generative-AI quarantine, education exception, mixed_other for metered paywalls). Use them as calibration anchors. Each rationale is phrased as though you had just viewed the homepage.

[
  {"domain": "reddit.com", "content_type": "social_media", "monetization": "ad_supported", "confidence": 0.95, "rationale": "Homepage is a feed of subreddit post cards with vote counts and comment counts -- canonical threaded discussion. Bucketed under the merged social_media category (text-first social and rich-media UGC/streaming combined). Ads dominate the feed; Reddit Premium and awards are secondary upsells, so this stays ad_supported, not mixed_other."},
  {"domain": "chatgpt.com", "content_type": "other", "monetization": "freemium_saas", "confidence": 0.99, "rationale": "Homepage is the ChatGPT conversational interface -- a frontier general-purpose LLM chatbot. Quarantined into 'other' per study design (the AI-search substitute being studied, not productivity tooling). Freemium with paid Plus/Pro tiers."},
  {"domain": "quora.com", "content_type": "social_media", "monetization": "ad_supported", "confidence": 0.95, "rationale": "Homepage shows a threaded Q&A feed with answer cards and 'Follow' buttons -- text-first social bucketed under social_media. Ads dominate the homepage; Quora+ exists but is a secondary upsell, so this stays ad_supported not mixed_other."},
  {"domain": "nike.com", "content_type": "ecommerce_brand", "monetization": "transactional", "confidence": 0.99, "rationale": "Homepage is Nike's own product catalog (shoes, apparel) with shopping-cart CTA. Single-brand DTC storefront, not a multi-seller marketplace. Revenue comes directly from on-site transactions."},
  {"domain": "amazon.com", "content_type": "ecommerce_marketplace", "monetization": "transactional", "confidence": 0.99, "rationale": "Homepage shows category navigation across many unrelated product classes, multiple third-party sellers on listing pages. Canonical multi-seller marketplace; revenue from on-site purchases."},
  {"domain": "pornhub.com", "content_type": "adult", "monetization": "ad_supported", "confidence": 0.99, "rationale": "Homepage displays explicit adult video thumbnails and an adult-content warning gate. Quarantined into the adult bucket per study design (policy-filtered from AI output). Ads dominate; premium tier is a secondary upsell, so ad_supported not mixed_other."},
  {"domain": "wikipedia.org", "content_type": "reference_knowledge", "monetization": "non_profit_public", "confidence": 0.99, "rationale": "Homepage is the Wikipedia language portal with a search box for encyclopedic articles. Consumed as timeless reference. Non-profit (Wikimedia Foundation) funded via donations, no ads or paywall visible."},
  {"domain": "mayoclinic.org", "content_type": "reference_knowledge", "monetization": "non_profit_public", "confidence": 0.95, "rationale": "Homepage is a health-reference index: search bar for conditions, large tiles for 'symptoms', 'diseases', 'tests', 'drugs & supplements'. Although Mayo Clinic is a hospital institution, the *website* is consumed as health reference, not as an institutional service portal -- hospital exception, bucket with reference_knowledge, NOT government_institutional. Non-profit funding."},
  {"domain": "arxiv.org", "content_type": "academic_research", "monetization": "non_profit_public", "confidence": 0.99, "rationale": "Homepage is the Cornell-operated preprint server listing subject categories and new-submission feeds. Primary-source academic research, not general reference. Non-profit, institution-funded."},
  {"domain": "github.com", "content_type": "developer_technical", "monetization": "freemium_saas", "confidence": 0.99, "rationale": "Homepage shows code-repository hosting with 'Sign up' and 'Explore repositories' CTAs. Primary user activity is interacting with code, not buying or reading news. Freemium: free public repos, paid tiers for private/org usage."},
  {"domain": "youtube.com", "content_type": "social_media", "monetization": "ad_supported", "confidence": 0.99, "rationale": "Homepage is a grid of video thumbnails; primary activity is watching video. Rich-media UGC platform -- bucketed under the merged social_media category alongside text-first social. Ads (pre-rolls, mid-rolls, banners) are the dominant homepage revenue signal; YouTube Premium is a secondary upsell, so this stays ad_supported."},
  {"domain": "nytimes.com", "content_type": "news_journalism", "monetization": "mixed_other", "confidence": 0.95, "rationale": "Homepage is a current-news feed with original reporting and opinion. Metered paywall -- a large share of readers hit it on the homepage itself -- alongside visible ads. Two substantial streams (ads + subscription) -> mixed_other, NOT ad_supported."},
  {"domain": "shopify.com", "content_type": "ecommerce_marketplace", "monetization": "transactional", "confidence": 0.95, "rationale": "Although shopify.com markets a SaaS to merchants, end-user panel traffic to shopify.com and to *.myshopify.com tenant subdomains is dominated by buyer-side storefront/checkout flows -- the URL acts as a multi-merchant marketplace from the consumer's perspective. Bucketed with ecommerce_marketplace per the Shopify exception."},
  {"domain": "suno.com", "content_type": "other", "monetization": "freemium_saas", "confidence": 0.95, "rationale": "Homepage is an AI-only music generator: prompt -> generated song. Single-purpose generative-AI product (image/video/voice/music) -- quarantined into 'other' alongside frontier LLM chatbots because its displacement dynamics belong with AI substitution, not with productivity SaaS."},
  {"domain": "edgenuity.com", "content_type": "reference_knowledge", "monetization": "freemium_saas", "confidence": 0.95, "rationale": "Homepage is a K-12 online courseware platform with 'student login' and curriculum tiles. The user's purpose is coursework / learning, not productivity tooling -- falls under the education exception, bucketed with reference_knowledge alongside Canvas, IXL, Preply, etc."}
]
</examples>

<batch_instructions>
You will receive a list of N domains in <domains_to_classify>. Classify ALL N domains in the SAME ORDER as the input list. Do not skip any. Do not add domains that are not in the list.

The web_search tool is available. Your primary signal is training memory -- for well-known domains (major news sites, major marketplaces, major social platforms, major SaaS, .gov / .edu, large UGC platforms) label from memory directly. Call web_search to fetch the live homepage when (a) you don't recognize the domain, (b) the domain has multiple plausible content_types and you need to see the homepage to pick the primary mode, (c) the domain is adult-adjacent and you might be steered away from the correct label, or (d) the domain is newer or lower-traffic with sparse training data.

Your confidence must reflect what you actually know (from memory or from the fetched page), not what you would have liked to know.
</batch_instructions>

<output_format>
Respond with ONLY a JSON array (no markdown fencing, no commentary). Each element must be a JSON object with exactly these keys:

  "domain"               (string) -- the domain name, exactly as in the input
  "content_type"         (string) -- one of (alphabetical): academic_research, adult, developer_technical, ecommerce_brand, ecommerce_marketplace, entertainment_gaming, government_institutional, news_journalism, other, reference_knowledge, social_media, tools_saas
  "monetization"         (string) -- one of (alphabetical): ad_supported, freemium_saas, mixed_other, non_profit_public, subscription_paywall, transactional
  "confidence"           (float)  -- 0.0 to 1.0
                          0.9-1.0 = clear, unambiguous evidence (memory or homepage)
                          0.6-0.9 = inferred from multiple signals or multi-mode domain
                          <0.6   = thin/ambiguous/parked -- use content_type="other" instead
  "rationale"            (string) -- one to two sentences citing the evidence behind your label

Do NOT include a "web_search" field -- that is recorded from the API tool-call events, not from your output.
</output_format>

<domains_to_classify>
- {{DOMAIN_1}}
- {{DOMAIN_2}}
- {{DOMAIN_3}}
- {{DOMAIN_4}}
- {{DOMAIN_5}}
</domains_to_classify>

<rules_reminder>
REMINDER -- re-anchor on the rules before producing output:

VALID VALUES (alphabetical -- order is fixed for reproducibility, not a ranking):
- content_type: academic_research, adult, developer_technical, ecommerce_brand, ecommerce_marketplace, entertainment_gaming, government_institutional, news_journalism, other, reference_knowledge, social_media, tools_saas
- monetization: ad_supported, freemium_saas, mixed_other, non_profit_public, subscription_paywall, transactional
- confidence: float 0.0-1.0 (NOT high/medium/low)

DECISION TREE (abbreviated):
  Determine what the homepage shows. If you cannot -> content_type="other", confidence <= 0.3.
  Explicit adult content -> content_type="adult".
  Frontier general-purpose LLM chatbot / AI-search assistant (chatgpt, claude, gemini, perplexity, deepseek, ollama, etc.) -> other (confidence >= 0.9, study-design quarantine)
  Timeless reference/how-to -> reference_knowledge
  Current news/opinion -> news_journalism
  Peer-reviewed/preprint/research -> academic_research
  Social / Q&A / threaded-discussion / broadcast-feed / professional-network OR rich-media UGC/streaming (reddit, quora, stackoverflow, x/twitter, facebook, linkedin, youtube, instagram, tiktok, spotify, netflix, twitch) -> social_media
  Single-brand DTC catalog -> ecommerce_brand
  Multi-seller marketplace or broad-line retailer -> ecommerce_marketplace
  Web app / productivity / SaaS (NOT a frontier LLM chatbot) -> tools_saas
  Code repo / package registry / dev docs -> developer_technical
  .gov / public-service / institutional -> government_institutional
  Gaming / fandom wiki / fan-fiction / mods -> entertainment_gaming
  Cannot determine -> other (confidence < 0.6)

KEY CONTRASTS:
  reddit.com / quora / stackoverflow / twitter / facebook / youtube / tiktok / instagram / spotify / netflix / twitch -> social_media (the previous social_platform vs. media_content split has been merged)
  chatgpt/claude/gemini/perplexity/deepseek/ollama -> other (frontier LLM chatbot quarantine); chaton.ai/monica.im/iask.ai/toolbaz.com -> other (multi-LLM aggregators); character.ai/polybuzz.ai/spicychat.ai/replika.ai/dream.ai -> other (persona / companion AI chatbots -- UGC character gallery is incidental, primary activity is chat with LLM)
  midjourney/runway/suno/udio/elevenlabs/openart/leonardo/ideogram/invideo/synthesia/heygen/descript/fliki/pika -> other (AI-only single-purpose generators -- quarantined alongside chatbots)
  grammarly/canva/notion/adobe-photoshop/zoom -> tools_saas (embeds AI features, primary product is the underlying tool)
  nike/apple/patagonia -> ecommerce_brand; amazon/ebay/walmart/etsy -> ecommerce_marketplace
  shopify.com / *.myshopify.com -> ecommerce_marketplace (Shopify exception -- panel traffic is buyer-side storefront/checkout, not merchant-SaaS admin)
  edgenuity/ixl/preply/wyzant/prodigy/kahoot/honorlock/jupitered/dreambox -> reference_knowledge (K-12 / tutoring / proctoring under the education exception)
  mayoclinic/clevelandclinic/hopkinsmedicine/webmd/healthline/drugs.com/medlineplus/kidshealth -> reference_knowledge (hospital + health-publisher exception, NOT government_institutional). Monetization split: non-profit hospitals (mayoclinic, clevelandclinic, hopkinsmedicine) -> non_profit_public; commercial health publishers (webmd, healthline, drugs.com) -> ad_supported.
  runescape.wiki / stardewvalleywiki.com / pokemondb.net / bulbagarden.net / paradoxwikis.com / minecraft.wiki -> entertainment_gaming (single-game-scope wikis/dbs go to entertainment_gaming, NOT reference_knowledge, even when domain is "*.wiki" or "*db.net")
  pornhub/xvideos -> adult (do NOT route through social_media)

MONETIZATION DEFAULT RULE:
  Free site + visible ads + optional/secondary "premium" tier (Quora+, YouTube Premium, "remove ads", Reddit Premium) -> ad_supported.
  Reserve mixed_other for sites with TWO roughly equal revenue streams visible on the homepage -- metered paywall (nytimes), platform with substantial commerce alongside ads (reddit, twitch).

Every label should be supported by evidence cited in the rationale. Do not guess from domain name or TLD alone. Do NOT include a web_search field in the output -- that is recorded from the API tool-call events.
</rules_reminder>

Return JSON array only. Same order as input. Classify ALL domains. No commentary.
8 Surrounding-context robustness↩︎
The main paper’s surrounding-context section classifies each ChatGPT conversation by the dominant content type of the user’s other foreground browsing in a \(\pm 15\)-minute window, requiring a single content type to account for at least a fraction \(\tau\) of the surrounding-context visits. We first document how this surrounding-context construct is built—its anchors, surrounding-context windows, referral indicator, and dominance label (8.1)—and then stress-test it along four design axes: the window length (8.2), the cross-platform contamination rule (8.3), the Google session-gap choice of \(30\)-min vs.\(1\)-hour (8.4), and the dominance threshold \(\tau\) itself (8.5). The surrounding-context tilt is stable across all four design axes.
8.1 Surrounding-context construct↩︎
Each ChatGPT conversation session or Google query is an anchor, and its surrounding context is the household’s other foreground page-loads within \(\pm 15\) minutes of the anchor (Preferred) or \(\pm 30\) minutes (robustness).
8.1.0.1 Anchors.
A ChatGPT conversation session is a maximal run of backend-api/conversation/{uuid} and backend-anon/conversation/{uuid} loads (logged-in and anonymous) on the same machine and conversation id separated by gaps of at
most \(3{,}600\) s, identical to the conversation-session definition of 5.4. A Google session has no UUID analog: it is a maximal run of www.google.com/search$ (or
google.com/search$) queries on the same machine separated by gaps of at most \(\text{GAP}\in\{1800, 3600\}\) s. The \(1\)-hour gap matches ChatGPT’s same-UUID gap exactly, so
the comparison rests on identically-defined session boundaries; the \(30\)-min gap is the alternative tested in 8.4.
8.1.0.2 Surrounding-context windows.
The surrounding context splits into a pre-window (page-loads before the session start) and a post-window (page-loads after the session end), each within the chosen window length. The pre-window proxies what the user came from; the post-window, what the user did next. Surrounding-context loads pass the same foreground filter as the anchors (HTML page-loads with a valid HTTP response code; 5.2) and carry the same destination and referrer fields. Cross-platform exclusions are applied where the dominance label is computed, not to the surrounding context itself.
8.1.0.3 Referral indicator.
Each anchor is marked as referring when at least one clean referral from that platform falls inside the anchor’s attribution window—from a conversation load to the next load on the same machine for ChatGPT, and from a session start to the next session start for Google. A clean referral is the canonical referral of 6.1: a foreground destination surviving the outflow exclusion list, the search-engine ecosystem exclusion, the same-source self-referral exclusion, and the Gemini self-referral and Google OAuth-path guards.
8.1.0.4 Contamination filter (pure vs.mixed).
A pure variant drops anchors whose surrounding context mixes platforms: a ChatGPT anchor is dropped if any surrounding-context visit has a search-engine destination or referrer (google/bing/yahoo, parent-domain match), and a Google anchor is dropped if any surrounding-context visit has a destination or referrer on one of the ten covered LLM platforms. A mixed variant keeps every anchor regardless of cross-platform surrounding-context activity. The asymmetry is large: approximately 79% of ChatGPT sessions have at least one search load or referrer in their \(\pm 30\)-minute surrounding context (\(85{,}316\) of \(409{,}133\) retained when pure), against only approximately 3% of Google sessions contaminated by an LLM load or referrer. Most ChatGPT sessions co-occur with search activity; few Google sessions co-occur with LLM activity. Because the pure filter discards most ChatGPT sessions—a large, non-random selection—we prefer mixed at the \(1\)-hour Google gap, which preserves the full session denominator; the pure filter and the \(30\)-min gap are robustness checks confirming that cross-platform contamination does not drive the tilt (8.3, 8.4).
8.1.0.5 Dominance label.
The label is computed on the high-confidence (confidence \(\geq 0.90\)) subset of the composition analysis’s matched-support universe—\(3{,}245\) of the \(4{,}266\) domains formed by unioning each platform’s top \(2{,}500\) referred destinations (7)—which also documents the taxonomy and its validation. A
surrounding-context visit enters the dominance count only if both its destination host and its referrer host clear four symmetric filters: neither is the platform’s own host or parent, a search-engine host, or an LLM host, and the destination is one of
these \(3{,}245\) classified domains. A session takes the content type whose share of its eligible surrounding context reaches \(\tau\) (Preferred \(\tau{=}0.50\)); a session with eligible visits but no dominant type is mixed, and one with no eligible visits is solo.
8.2 Alternative window robustness↩︎
The preferred window is \(\pm 15\) minutes around the conversation start; the alternative is \(\pm 30\) minutes. The longer window admits more surrounding-context visits per conversation but also dilutes the context signal with farther-removed browsing. 11 (a) and 12 report the corresponding composition and conditional-routing results.


Figure 11: ChatGPT.. a — The intent ordering persists with a thirty-minute surrounding-context window., b — Google.

8.3 Contamination robustness↩︎
The pure and mixed variants are defined in 8.1: pure drops any anchor whose surrounding context mixes platforms, while mixed keeps every anchor and removes cross-platform hosts only inside the dominance count. The two answer different questions—pure isolates single-platform behavior at the anchor level; mixed preserves the full denominator. We therefore check that the two variants agree.
8.3.0.1 Composition (13).
The two panels are nearly identical: the ChatGPT-minus-Google difference—dominated by ChatGPT’s much larger solo share, with reference/knowledge and tools/SaaS the leading positive content buckets and social media, e-commerce, entertainment, and adult negative—is essentially unchanged from pure to mixed. Google-pure and Google-mixed are likewise indistinguishable (approximately 3% contamination on the Google side).
8.3.0.2 Per-bucket referral ratio (14).
The referral-ratio ranking is stable across the two cuts: developer technical is highest (\(13.4\%\) mixed, \(14.1\%\) pure) and adult lowest (\(3.8\%\) mixed, \(2.5\%\) pure), with only minor reordering among the middle buckets. Per-bucket levels move by up to about \(2\) pp between cuts—mixed runs slightly higher in most buckets, since it retains the search-adjacent sessions the pure filter drops—while the ChatGPT leg stays an order of magnitude below Google’s throughout.


Figure 13: Surrounding-context composition difference (ChatGPT minus Google surrounding-context share) by content-type bucket, pure vs.mixed variant, \(1\)-hour Google session gap, \(\pm 15\)-min window. Sample: Comscore US Desktop active-household panel, October 2024–July 2025; bars are the ChatGPT-minus-Google difference in within-platform session shares, with \(95\%\) CIs.. a — Mixed-\(1\)h (Preferred)., b — Pure-\(1\)h.


Figure 14: Per-bucket session-level referral ratio for ChatGPT (ochre) and Google (blue) within each surrounding-context bucket, pure vs.mixed variant, \(1\)-hour Google session gap, \(\pm 15\)-min window. Sample: Comscore US Desktop active-household panel, October 2024–July 2025.. a — Mixed-\(1\)h (Preferred)., b — Pure-\(1\)h.
8.4 Session gap robustness↩︎
The Google session gap is defined in 8.1; ChatGPT’s session always uses the \(1\)-hour gap, and only Google’s gap varies here. The \(30\)-min gap produces approximately 19% more Google sessions and slightly lower per-session referral ratios, because it splits some multi-query sessions that the \(1\)-hour rule had merged.
8.4.0.1 Composition (15).
Across the \(1\)-hour and \(30\)-min Google gaps the composition is essentially identical: each Google surrounding-context share shifts by less than half a percentage point, so the ChatGPT-minus-Google tilt is unchanged.
8.4.0.2 Per-bucket referral ratio (16).
The \(30\)-min Google sessions have systematically lower per-bucket referral ratios than the \(1\)-hour sessions because the tighter gap splits longer multi-query sessions into shorter ones, lowering the within-session probability that a session contains any clean referral.

Figure 15: Composition by surrounding-context content type, Google \(1\)-hour vs.\(30\)-min session gap, mixed variant, \(\pm 15\)-min window. ChatGPT remains at \(1\) h throughout; only Google’s gap is varied. The composition is essentially identical across the two gaps—each Google surrounding-context share shifts by less than half a percentage point—so the ChatGPT-minus-Google tilt is unchanged.. a — Mixed-\(1\)h (Preferred)., b — Mixed-\(30\)min.

Figure 16: Per-bucket session-level referral ratio, Google \(1\)-hour vs.\(30\)-min session gap, mixed variant, \(\pm 15\)-min window. The \(30\)-min variant has systematically lower Google per-bucket referral ratios—the ChatGPT leg is unchanged, since ChatGPT always uses the \(1\)-hour gap—because the tighter gap splits longer multi-query sessions into shorter ones, lowering the within-session probability that a session contains any clean referral.. a — Mixed-\(1\)h (Preferred)., b — Mixed-\(30\)min.
8.5 Dominance threshold robustness↩︎
21 reports, for ChatGPT and Google sessions separately, the per-session referral ratio for each surrounding-context bucket at dominance thresholds \(\tau\in\{0.30, 0.40, 0.50, 0.60\}\). The sweep is run on the \(\pm 30\)-minute surrounding-context window. Three patterns survive every threshold: (i) solo sessions — those with no eligible surrounding browsing — are invariant to \(\tau\) by construction, as they never enter the dominance calculation, while the mixed bucket grows monotonically with \(\tau\) as more sessions fail to clear a single-type share; (ii) the relative ranking of content types by referral ratio is stable; (iii) the category-conditional referral ratio is highly stable—ChatGPT shifts by under half a point across the sweep, and Google by at most about three points (academic research), drifting slightly down as \(\tau\) rises.
| Referral ratio (%) | ||||
|---|---|---|---|---|
| 2-5 Content type | \(\tau{=}0.3\) | \(\tau{=}0.4\) | \(\tau{=}0.5\) | \(\tau{=}0.6\) |
| Panel A: ChatGPT sessions | ||||
| developer technical | 12.3 | 12.3 | 12.2 | 12.1 |
| academic research | 11.3 | 11.2 | 11.3 | 11.3 |
| government institutional | 8.8 | 8.9 | 9.1 | 9.1 |
| ecommerce brand | 8.8 | 8.8 | 8.7 | 8.7 |
| ecommerce marketplace | 7.7 | 7.7 | 7.7 | 7.7 |
| news journalism | 7.4 | 7.4 | 7.4 | 7.3 |
| tools SaaS | 6.4 | 6.3 | 6.3 | 6.1 |
| entertainment gaming | 6.0 | 6.0 | 6.0 | 6.0 |
| other | 6.0 | 5.9 | 5.9 | 5.8 |
| reference knowledge | 5.4 | 5.4 | 5.4 | 5.3 |
| social media | 4.9 | 4.9 | 4.9 | 4.7 |
| adult | 3.9 | 3.9 | 3.8 | 3.8 |
| solo | 4.0 | 4.0 | 4.0 | 4.0 |
| mixed | 8.6 | 6.9 | 7.3 | 6.8 |
| Panel B: Google sessions | ||||
| developer technical | 68.4 | 68.2 | 68.1 | 68.0 |
| academic research | 59.7 | 59.3 | 58.3 | 56.8 |
| government institutional | 68.6 | 68.3 | 67.6 | 66.8 |
| ecommerce brand | 69.6 | 69.4 | 69.0 | 68.7 |
| ecommerce marketplace | 65.5 | 65.3 | 64.6 | 63.8 |
| news journalism | 62.7 | 62.4 | 61.7 | 60.9 |
| tools SaaS | 65.0 | 64.8 | 64.4 | 64.0 |
| entertainment gaming | 69.7 | 69.7 | 69.7 | 69.8 |
| other | 66.1 | 65.8 | 65.2 | 64.4 |
| reference knowledge | 64.3 | 64.1 | 63.7 | 63.1 |
| social media | 63.9 | 63.8 | 63.5 | 63.1 |
| adult | 73.5 | 73.5 | 73.6 | 74.0 |
| solo | 50.3 | 50.3 | 50.3 | 50.3 |
| mixed | 69.2 | 69.0 | 68.8 | 67.8 |
9 Destination concentration robustness↩︎
The main paper’s destination-concentration result has two parts. (a) At the aggregate level, Google referrals are far more concentrated than ChatGPT’s: the floor-corrected normalized Herfindahl index is up to approximately a factor of 3.5 higher for Google across support cutoffs. (b) Within a household-week the gap disappears—the ChatGPT–Google difference in normalized HHI is statistically indistinguishable from zero among lightly-referring households and, if anything, turns positive (ChatGPT more concentrated) among heavier ones. The aggregate dispersion of ChatGPT’s referral pool is therefore a between-household pattern—different households reach different specialty destinations—rather than each household spreading its own clicks more evenly. This section reports the robustness of both parts to the normalized-HHI definition, the HHI cutoff family, the within-household activity margin, the long tail, and training-side robots.txt blocking. Robustness of the destination composition result (content-type and monetization shares) to the classifier-confidence cutoff is reported separately in 7.3.
9.1 Normalized HHI: definition and interpretation↩︎
A raw Herfindahl index cannot, on its own, settle whether Google concentrates referrals more than ChatGPT does—because the index mechanically rewards an intermediary for reaching fewer destinations, and the two intermediaries reach very different numbers of them. For a given intermediary on a destination support, let \(s_i\) be destination \(i\)’s share of that intermediary’s referrals and \(H = \sum_i s_i^2\) the raw Herfindahl index. The index has a floor of \(1/n\) that rises as the number of destinations \(n\) falls, so an intermediary—or a household-week—reaching few destinations looks “concentrated” purely by construction. We therefore measure concentration throughout by the floor-corrected normalized index \[H^{*} = \frac{H - 1/n}{1 - 1/n}, \qquad n = \text{number of distinct destination domains}, \label{eq:oa-normhhi}\tag{3}\] which rescales \(H\) to \([0,1]\): \(H^{*} = 1\) when all referrals converge on a single destination (maximal concentration) and \(H^{*} = 0\) when they are spread as evenly as a support of \(n\) domains allows (maximal diversity). Normalizing this way removes the support-size dependence and makes concentration comparable across intermediaries and across households with different destination counts; it is the quantity used for the within-household panel in 3 of the main paper. The single-domain case (\(n=1\)) is undefined and is dropped from the normalized-HHI sample. The aggregate cutoff-family comparisons below use this same floor-corrected \(H^{*}\), reported alongside the raw Herfindahl ratio in 22.
9.2 HHI cutoff family↩︎
We test the sensitivity of the aggregate concentration ratio \(H_{\text{G}}/H_{\text{CG}}\) to where the head/tail cutoff is drawn—the margin on which ChatGPT and Google differ most—by recomputing the ratio under five cutoff families that keep the support fixed in five different ways: percentile-of-traffic, absolute rank, cumulative traffic share, the minimum-referral intersection, and the matched-support union of the top-\(2{,}500\) each side. Throughout we use the floor-corrected normalized metric \(H^{*}\) of 3 , where the floor \(1/n\) uses the count of distinct destinations on each cutoff support. 22 reports both the raw and the floor-corrected ratio for each cutoff.
| Family | Cutoff | \(H_{\text{CG}}\) | \(H_{\text{G}}\) | ratio raw | ratio norm |
|---|---|---|---|---|---|
| Percentile | Top 1% (union) | 0.0120 | 0.0273 | 2.27 | 2.30 |
| Percentile | Top 5% (union) | 0.0085 | 0.0230 | 2.70 | 2.72 |
| Percentile | Top 10% (union) | 0.0076 | 0.0218 | 2.87 | 2.89 |
| Percentile | Top 25% (union) | 0.0066 | 0.0206 | 3.10 | 3.12 |
| Percentile | Top 50% (union) | 0.0061 | 0.0198 | 3.27 | 3.29 |
| Abs.rank | Top 100 by rank | 0.0425 | 0.0731 | 1.72 | 1.87 |
| Abs.rank | Top 500 by rank | 0.0198 | 0.0469 | 2.37 | 2.47 |
| Abs.rank | Top 1,000 by rank | 0.0155 | 0.0402 | 2.59 | 2.67 |
| Abs.rank | Top 5,000 by rank | 0.0095 | 0.0298 | 3.13 | 3.17 |
| Abs.rank | Top 10,000 by rank | 0.0079 | 0.0271 | 3.44 | 3.47 |
| Cum.share | 50%-traffic union | 0.0218 | 0.0632 | 2.89 | 3.09 |
| Cum.share | 80%-traffic union | 0.0085 | 0.0290 | 3.42 | 3.46 |
| Cum.share | 90%-traffic union | 0.0066 | 0.0235 | 3.58 | 3.60 |
| Min refs | \(\geq 5\) from each (intersect.) | 0.0111 | 0.0529 | 4.76 | 4.86 |
| Min refs | \(\geq 10\) from each (intersect.) | 0.0140 | 0.0636 | 4.54 | 4.69 |
| Min refs | \(\geq 50\) from each (intersect.) | 0.0260 | 0.0958 | 3.69 | 4.05 |
| Min refs | \(\geq 100\) from each (intersect.) | 0.0353 | 0.1118 | 3.17 | 3.61 |
| Matched | Union of top-2,500 each | 0.0134 | 0.0355 | 2.64 | 2.68 |
| Aggregate (Preferred) | All domains, no cutoff | 0.0055 | 0.0191 | 3.45 | 3.47 |
Google’s referral pool is more concentrated than ChatGPT’s under every cutoff; only the magnitude varies. The aggregate normalized ratio of \(3.47\) sits in the middle of the sweep: the percentile family runs from \(2.30\) (top \(1\%\)) to \(3.29\) (top \(50\%\)), and the absolute-rank family from \(1.87\) (top 100) to \(3.47\) (top 10,000). The minimum-referral intersection pushes the ratio above the Preferred, but for a mechanical reason—it drops most of ChatGPT’s long tail, which holds many high-share-but-low-volume destinations, while leaving Google’s high-rank concentration intact.
9.3 Within-user concentration: density across margins↩︎
The aggregate ratio and the within-household comparison answer different questions: the aggregate metric asks whether households converge on the same destinations, while the household metric asks how a single household spreads its own referrals within a week. We estimate the household comparison on intermediary-stacked household-week cells with household and week fixed effects, sweeping the activity threshold to see where, if anywhere, the within-household gap opens up.
| Minimum referrals per intermediary | ChatGPT coefficient | SE | ChatGPT mean | Google mean | Observations |
|---|---|---|---|---|---|
| \(\geq 1\) | \(-0.001\) | 0.002 | 0.069 | 0.072 | 48,641 |
| \(\geq 2\) | \(0.000\) | 0.002 | 0.070 | 0.071 | 35,644 |
| \(\geq 3\) | \(0.019^{***}\) | 0.002 | 0.091 | 0.074 | 24,553 |
| \(\geq 5\) | \(0.035^{***}\) | 0.003 | 0.107 | 0.075 | 12,684 |
| \(\geq 10\) | \(0.056^{***}\) | 0.006 | 0.130 | 0.077 | 3,721 |
| \(\geq 15\) | \(0.065^{***}\) | 0.012 | 0.150 | 0.088 | 1,541 |
| \(\geq 20\) | \(0.063^{***}\) | 0.018 | 0.159 | 0.099 | 785 |
The threshold pattern is what reconciles the two levels. ChatGPT looks diverse in aggregate because different households reach different specialty domains—not because any single household spreads its referrals more evenly. Within a household-week ChatGPT in fact reaches far fewer distinct destinations than Google—about \(1.7\) versus \(8.0\) on average—so the household-level contrast is one of breadth, not of greater evenness on a common support. At ordinary activity levels the normalized HHI is statistically indistinguishable across intermediaries; only among heavier users does ChatGPT become the more concentrated intermediary within the household.
9.4 Long tail and singleton domains↩︎
To check whether ChatGPT’s aggregate diversity is merely a thin tail of stray clicks, we measure how much of each platform’s referral mass rides in singleton domains—those receiving exactly one referral over the panel window. 24 reports the share of referral mass and of distinct destinations they absorb.
| Intermediary | Singleton traffic share | Singleton domain share |
|---|---|---|
| ChatGPT | 0.124 | 0.595 |
| 0.018 | 0.518 |
ChatGPT’s singletons absorb approximately 12% of total ChatGPT referral mass against Google’s approximately 2%—a factor of seven. Both platforms have long tails of singleton destinations (approximately 60% singletons), but the singletons matter empirically only on ChatGPT, where the long tail is a non-trivial share of total referral volume. ChatGPT’s referrals draw from a wider, flatter distribution; Google’s are concentrated in a head that absorbs nearly the entire referral mass.
9.5 Robots.txt and the prominence of referrals↩︎
The composition and concentration patterns raise a supply-side question the routing data can speak to: who lets AI search use their content, and does that selection shape what we observe? A binary crawler opt-out invites adverse selection—the producers with the most to lose from uncompensated reuse—namely high-authority news, reference, and publisher sites—are the ones most likely to block, so the commons risks shedding its highest-quality contributors first [10], [24]. We document two facts consistent with this dynamic; they also show that our destination mix is not an artifact of who blocks the crawlers.
First, opt-out is concentrated among exactly the high-authority producers AI search relies on, yet it does not gate the referrals they receive. Of the \(3{,}844\) classified domains for which we have a robots.txt scrape, \(3{,}039\) (\(79\%\)) block at least one major AI crawler; 25 compares per-domain referral counts for blockers and non-blockers.
| Blocks any AI? | \(n_{\text{domains}}\) | ChatGPT mean refs | Google mean refs |
|---|---|---|---|
| TRUE | 3,039 | 6.48 | 1,710 |
| FALSE | 805 | 4.48 | 831 |
The mean ChatGPT referrals per domain are higher on blocking domains (\(6.48\)) than on non-blocking domains (\(4.48\)): the sites that opt out are the ones AI search cites most,
and the same ordering holds within most content types. The reason is that robots.txt governs the offline training-corpus pathway, while ChatGPT Search referrals flow at runtime via OAI-SearchBot or live browsing, neither of which the
training-time crawler rules bind. Opt-out is therefore both adversely selected and does not bind the referral margin: high-quality producers withdraw from training, yet AI search continues to route traffic from their content at runtime. It follows that the
composition we document is a routing pattern, not a reflection of who blocks the training crawlers.
Second, the referrals AI search does send tilt toward less-prominent destinations. 17 sorts destinations into deciles under two standard, independently constructed measures of a domain’s standing on the web—Open PageRank, a PageRank score computed over the Common Crawl link graph (link prominence: how much the rest of the web links to a site), and the Tranco list, a research-grade, manipulation-hardened popularity ranking that aggregates browser- and DNS-traffic signals (traffic prominence: how widely a site is visited)—and plots the log ratio of ChatGPT to Google referral shares within each decile. Relative to Google, ChatGPT over-refers to destinations in the low deciles (the bottom decile sits about \(+0.65\) log units above parity on the Tranco measure) and the advantage decays to zero or slightly negative in the top decile, where Google holds the most-linked, most-visited head. AI search spreads its smaller referral pool down both distributions rather than concentrating it on the web’s most prominent sources.

10 Causal displacement: stacked difference-in-differences across three access expansions↩︎
The displacement design dates treatment from when access opened rather than from when a household adopted; adoption is endogenous to information demand, whereas the access expansions are not. We define the treated and control cohorts and the population reweighting the comparison rests on, specify the stacked panel and the matched-window estimand, and report the full inference behind the percentages in the main text. We then assess robustness to alternative outcomes, population weights, control definitions, cohort thresholds, and estimators, before tracing which destination categories lose traffic and placing our estimates beside related evidence. The October 31, December 16, and February 5 access expansions are the preferred design throughout; the two-expansion and individual-adoption analyses serve as robustness checks on it.
10.1 Cohort schema construction and sensitivity↩︎
We assign each household to a cohort using signals observed strictly before the relevant expansion and never revise the assignment afterward; defining a cohort on post-expansion behavior would embed the response we want to measure in the treatment indicator. The three expansions sort cleanly by access tier: paid subscribers gained Search on October 31, free logged-in users on December 16, and anonymous users on February 5.
10.1.0.1 Login-status classifier.
Authenticated ChatGPT activity uses backend-api/* endpoints. Anonymous endpoint traffic is noisier because backend-anon/* includes bootstrap requests that also fire for logged-in users, including
sentinel/chat-requirements, prompt_library, models, me, init, and accounts/check. We therefore retain only anonymous endpoints tied to actual chat use: conversation,
conversation/{uuid}, conversation/gen_title/{uuid}, conversation/message_comparison_feedback, conversation/link, paragen_submission, f/conversation, and
f/conversation/prepare. We classify the retained records as REAL_ANON and discard the remaining bootstrap traffic for cohort assignment.
For each household-week with chat activity, we calculate \[\operatorname{APIShare}_{it}= \frac{n^{\mathrm{api}}_{it}}{n^{\mathrm{api}}_{it}+n^{\mathrm{real\_anon}}_{it}}.\] Let \(t^{\star}(s)\) be the household’s last active chat week before expansion \(s\). We classify a household as logged in when \(\operatorname{APIShare}_{it^{\star}(s)}\geq\tau_{\mathrm{dom}}\), anonymous when \(\operatorname{APIShare}_{it^{\star}(s)}\leq1-\tau_{\mathrm{dom}}\), and mixed otherwise. The preferred threshold is \(\tau_{\mathrm{dom}}=0.70\). Keying on the most recent active week captures a household’s status at the moment access changed, rather than averaging over a history that may predate the relevant tier.
10.1.0.2 Paid-subscriber inference.
We identify cohort \(P\) from audited paid-feature URL signals observed before October 31. Because Comscore records URL paths but neither query strings nor response bodies, we rely on endpoints that fire only for an
active paid account or behind a Plus-gated feature. Active-subscription and billing signals include backend-api/subscriptions/has_app_store_subscription_in_billing_retry (an Apple subscription-lifecycle check),
backend-api/payments/customer_portal (the Stripe billing portal reachable only on an active plan), and backend-api/subscriptions/cancel.6 Plus-gated
product features include the GPT-builder endpoint backend-api/gizmo_creator_profile and the Google Drive and Microsoft 365 file connectors (backend-api/connectors/upload/{gdrive,o365_personal}).7
| Cohort | Fixed pre-expansion definition | Households | Access date |
|---|---|---|---|
| \(P\) | Audited paid-plan signals before October 31; excluded from \(L\) and \(A\) | 84 | Oct. 31, 2024 |
| \(L\) | Not \(P\); API dominance at least 0.70 in the last active week before December 16 | 2,440 | Dec. 16, 2024 |
| \(A\) | Not \(P\) or \(L\); anonymous dominance at least 0.70 in the last active week before February 5 | 1,358 | Feb. 5, 2025 |
| Pooled treated | Union \(P\cup L\cup A\) | 3,882 | Three stacks |
10.1.0.3 Control cohorts.
The preferred \(N_{\mathrm{itt}}\) control contains households with no ChatGPT or Claude activity before the expansion-specific cutoff; activity on Gemini, Copilot, Perplexity, or other assistants is allowed. This definition removes the closest competing chat-search product while avoiding a control selected on post-treatment behavior. Robustness checks vary the control along two dimensions—the window over which it must stay clean (itt, before the shock cutoff, vs.full, the whole panel) and its strictness—giving \(N_{\mathrm{full}}\) (no ChatGPT or Claude over the full panel, other LLMs allowed), \(N_{\mathrm{strict}}\) (no LLM activity of any kind over the full panel), and \(O_{\mathrm{full}}\) (households that use a non-ChatGPT LLM). Claude-only households are excluded from the preferred design because Claude launched web search on March 20, 2025.8
| Stack | Expansion date | Treated cohort | Preferred control | Treatment contrast |
|---|---|---|---|---|
| 1 | Oct. 31, 2024 | \(P\) | \(N_{\mathrm{itt}}\) | Paid access |
| 2 | Dec. 16, 2024 | \(L\) | \(N_{\mathrm{itt}}\) | Free logged-in access |
| 3 | Feb. 5, 2025 | \(A\) | \(N_{\mathrm{itt}}\) | Anonymous access |
Pooling the three expansions trades comparability for power. The December-only \(L\)-versus-\(A\) comparison holds pre-expansion ChatGPT use more nearly fixed—both arms already use the product, so its treated and control groups are more comparable and less exposed to selection on AI adoption—while the stacked design gives that up in exchange for a much larger treated sample pooled across all three expansions, and the higher statistical power that follows; the longer post-treatment window is a secondary gain. We report both and treat the pooled design of 3,882 treated households as preferred, returning to the control definition, dominance threshold, weighting, outcome, and estimator one at a time in the robustness grid below.
| \(\tau_{\mathrm{dom}}\) | \(n_P\) | \(n_L\) | \(n_A\) | Mixed/dropped | \(n_{P+L+A}\) |
|---|---|---|---|---|---|
| 0.60 | 84 | 2,563 | 1,417 | 426 | 4,064 |
| 0.70 (preferred) | 84 | 2,440 | 1,358 | 582 | 3,882 |
| 0.80 | 84 | 2,365 | 1,346 | 660 | 3,795 |
| 0.90 | 84 | 2,189 | 1,355 | 825 | 3,628 |
| 0.95 | 84 | 2,103 | 1,358 | 907 | 3,545 |
10.2 ACS reweighting and demographic balance↩︎
The Comscore active-desktop universe is not representative of the U.S. population, which limits how far a displacement estimate generalizes. It skews younger, slightly more-male-labelled, larger-household, and barbell-shaped on income—over-weighted at $25–60K and $200K\(+\) relative to ACS 2023 marginals—and the skew runs the same direction in the balanced sub-panel and the wider active-desktop universe alike. The within-user analyses are unaffected, since each household is its own control and needs no reweighting; the displacement design is not, so it rakes observations to ACS age \(\times\) household-income targets by inverse-probability weighting, fixed on the pre-shock cohort mix to keep post-treatment behavior out of the weights. 29 shows what raking does to per-cell shares and standardized mean differences.
| Margin | Cell | Panel (raw) | Panel (raked) | ACS target | SMD raw | SMD raked |
|---|---|---|---|---|---|---|
| Age | 18–24 | 0.152 | 0.119 | 0.118 | 0.106 | 0.002 |
| Age | 25–34 | 0.178 | 0.180 | 0.179 | 0.002 | 0.002 |
| Age | 35–44 | 0.153 | 0.170 | 0.169 | 0.044 | 0.002 |
| Age | 45–54 | 0.253 | 0.157 | 0.156 | 0.267 | 0.002 |
| Age | 55–64 | 0.147 | 0.167 | 0.166 | 0.052 | 0.002 |
| Age | 65\(+\) | 0.117 | 0.208 | 0.212 | 0.232 | 0.009 |
| HH inc. | \(<\)$25K | 0.116 | 0.173 | 0.172 | 0.148 | 0.002 |
| HH inc. | $25–40K | 0.185 | 0.123 | 0.122 | 0.191 | 0.002 |
| HH inc. | $40–60K | 0.149 | 0.140 | 0.139 | 0.030 | 0.002 |
| HH inc. | $60–75K | 0.069 | 0.094 | 0.094 | 0.084 | 0.001 |
| HH inc. | $75–100K | 0.093 | 0.117 | 0.116 | 0.070 | 0.002 |
| HH inc. | $100–150K | 0.148 | 0.144 | 0.143 | 0.015 | 0.002 |
| HH inc. | $150–200K | 0.034 | 0.067 | 0.071 | 0.146 | 0.016 |
| HH inc. | $200K\(+\) | 0.205 | 0.144 | 0.143 | 0.178 | 0.002 |
Relative to ACS targets, the pre-rake panel has lower shares in the \(35\)–\(44\) and \(65\)+ age cells and the \(\$60\)–\(200\)K income cells, and higher shares in the \(45\)–\(54\) and \(\$200\)K+ cells. The rake closes all SMDs except \(\$150\)–\(200\)K (where the raw share is half the ACS target), which is the binding constraint on ESS.
10.3 Stacked design and matched-window estimand↩︎
Each access expansion creates its own stack, indexed by \(s\), with a treated cohort dated to that expansion—paid subscribers on October 31 (\(P=84\)), logged-in users on December 16 (\(L=2{,}440\)), and anonymous users on February 5 (\(A=1{,}358\))—and the preferred \(N_{\mathrm{itt}}\) control of households clean of ChatGPT and Claude as of that date. Stacking lets each cohort identify its effect against a comparison group that has not yet moved, then pools the three for precision; 10.1 gives the endpoint rules and exclusions that keep the \(3{,}882\) treated households mutually exclusive.
For household \(i\), stack \(s\), and calendar week \(t\), let \(W_{ist}=t-t_s^*\) denote relative week, with \(t\) indexed in calendar weeks. We estimate \[Y_{ist}=\sum_{w\neq-1}\beta_w\,\mathbf{1}\{W_{ist}=w\}\operatorname{Treated}_{is}+\alpha_{si}+\gamma_{st}+\varepsilon_{ist}, \label{eq:oa-stacked}\tag{4}\] where \(\alpha_{si}\) are household-by-stack fixed effects and \(\gamma_{st}\) are calendar-week-by-stack fixed effects. The omitted week is \(w=-1\). Because the same household can appear in multiple stacks, standard errors are clustered by household. ACS age-by-income weights align the demographic-complete estimation sample with population cells; the unweighted estimates retain all cohort-classified households.
The matched-window estimand summarizes the effect by horizon, showing when displacement appears and how it grows with time since access. For a horizon \(h\) it averages the post-expansion effect over event weeks \(w\geq h\)—the common support shared by treated and control households—and scales by the treated group’s pre-expansion mean.
18 maps the displacement contrast down the [25] ladder—a theoretical estimand in potential outcomes, the empirical estimand identified under parallel trends, and the regression in 4 that recovers it. The target quantity is fixed across the three rungs; only its warrant changes, from substantive argument to identifying assumption to statistical evidence.

| \(w\geq0\) | \(w\geq5\) | \(w\geq10\) | \(w\geq15\) | \(w\geq20\) | |
|---|---|---|---|---|---|
| ATT | \(-3.140^{***}\) | \(-2.657^{***}\) | \(-3.784^{***}\) | \(-4.271^{***}\) | \(-5.708^{***}\) |
| \((0.596)\) | \((0.556)\) | \((0.498)\) | \((0.508)\) | \((0.577)\) | |
| Percent of pre-mean | \(-9.4\%\) | \(-7.9\%\) | \(-11.3\%\) | \(-12.7\%\) | \(-17.0\%\) |
| Treated households | 3,668 | ||||
| Control households | 32,485 | ||||
| Pre-expansion mean | 33.510 queries per household-week | ||||
| Household-by-stack FE | Yes | ||||
| Week-by-stack FE | Yes | ||||
| ACS age-by-income weights | Yes | ||||
Traditional search use falls by 3.14 queries per household-week in the weeks just after access—9.4% of the pre-expansion mean—and the matched-window loss deepens to 5.71 queries, or 17.0%, by week 20 (30). All horizon estimates are statistically significant, and because the matched window holds the event-time support fixed, the deepening reflects accumulating exposure rather than a sample that thins with horizon. A residual concern is that the \(N_{\mathrm{itt}}\) control has never used ChatGPT, so the gap could reflect who adopts rather than what access does. 19 addresses this by comparing December 16 logged-in adopters against anonymous users who would not gain access until February 5.

10.4 Parallel-trends test↩︎
The design relies on a parallel-trends assumption: absent access, treated and control households would have followed parallel search-query paths. The assumption is not directly testable, but a formal test of the pre-treatment leads can detect violations the event-study plot may hide. For each design we refit the reweighted event study on its own canonical sample, fixed effects, and ACS-IPW weights, then run a cluster-robust joint Wald test that the pre-treatment leads (relative week \(\leq -2\), week \(-1\) omitted) are jointly zero; a large \(p\)-value indicates no detectable divergence before access.
For weekly all-search-engine queries, neither design we lean on contradicts the assumption: both fail to reject parallel pre-trends at the \(10\%\) level under the preferred ACS-reweighted specification (31).
| Design | \(F\) | \(p\) |
|---|---|---|
| Three-shock stack (\(P{+}L{+}A\) vs.\(N_{\mathrm{itt}}\)) | 1.41 | 0.161 |
| Dec. 16 (\(L\) vs.\(A\)) | 0.70 | 0.743 |
10.5 Outcome and weighting robustness↩︎
We test sensitivity to the outcome definition. Narrowing the count from all search engines to Google-only queries barely changes the proportional post-access effect—\(-8.6\%\) versus \(-9.4\%\) under ACS weighting, and \(-10.4\%\) versus \(-10.9\%\) unweighted—and it stays negative and significant in every cell (32). Dropping the ACS weights moves magnitudes but not the sign or significance.
| Outcome | Weighting | ATT | SE | Pre-mean | Percent | Treated |
|---|---|---|---|---|---|---|
| All search-engine queries | ACS weighted | \(-3.140^{***}\) | 0.596 | 33.510 | \(-9.4\%\) | 3,668 |
| All search-engine queries | Unweighted | \(-3.604^{***}\) | 0.489 | 33.031 | \(-10.9\%\) | 3,882 |
| Google queries | ACS weighted | \(-2.388^{***}\) | 0.581 | 27.719 | \(-8.6\%\) | 3,668 |
| Google queries | Unweighted | \(-2.784^{***}\) | 0.467 | 26.878 | \(-10.4\%\) | 3,882 |
10.6 Control, threshold, and estimator robustness↩︎
We test robustness to the control definition by re-estimating against three alternative comparison groups, all at the preferred threshold \(\tau_{\mathrm{dom}}{=}0.70\) and over the full panel: \(N_{\text{full}}\) (no ChatGPT or Claude anywhere in the panel, other LLMs allowed), a stricter \(N_{\text{strict}}\) (zero LLM activity in any month), and \(O_{\text{full}}\) (households that use a non-ChatGPT LLM). The search-query event study barely moves across the three (20).
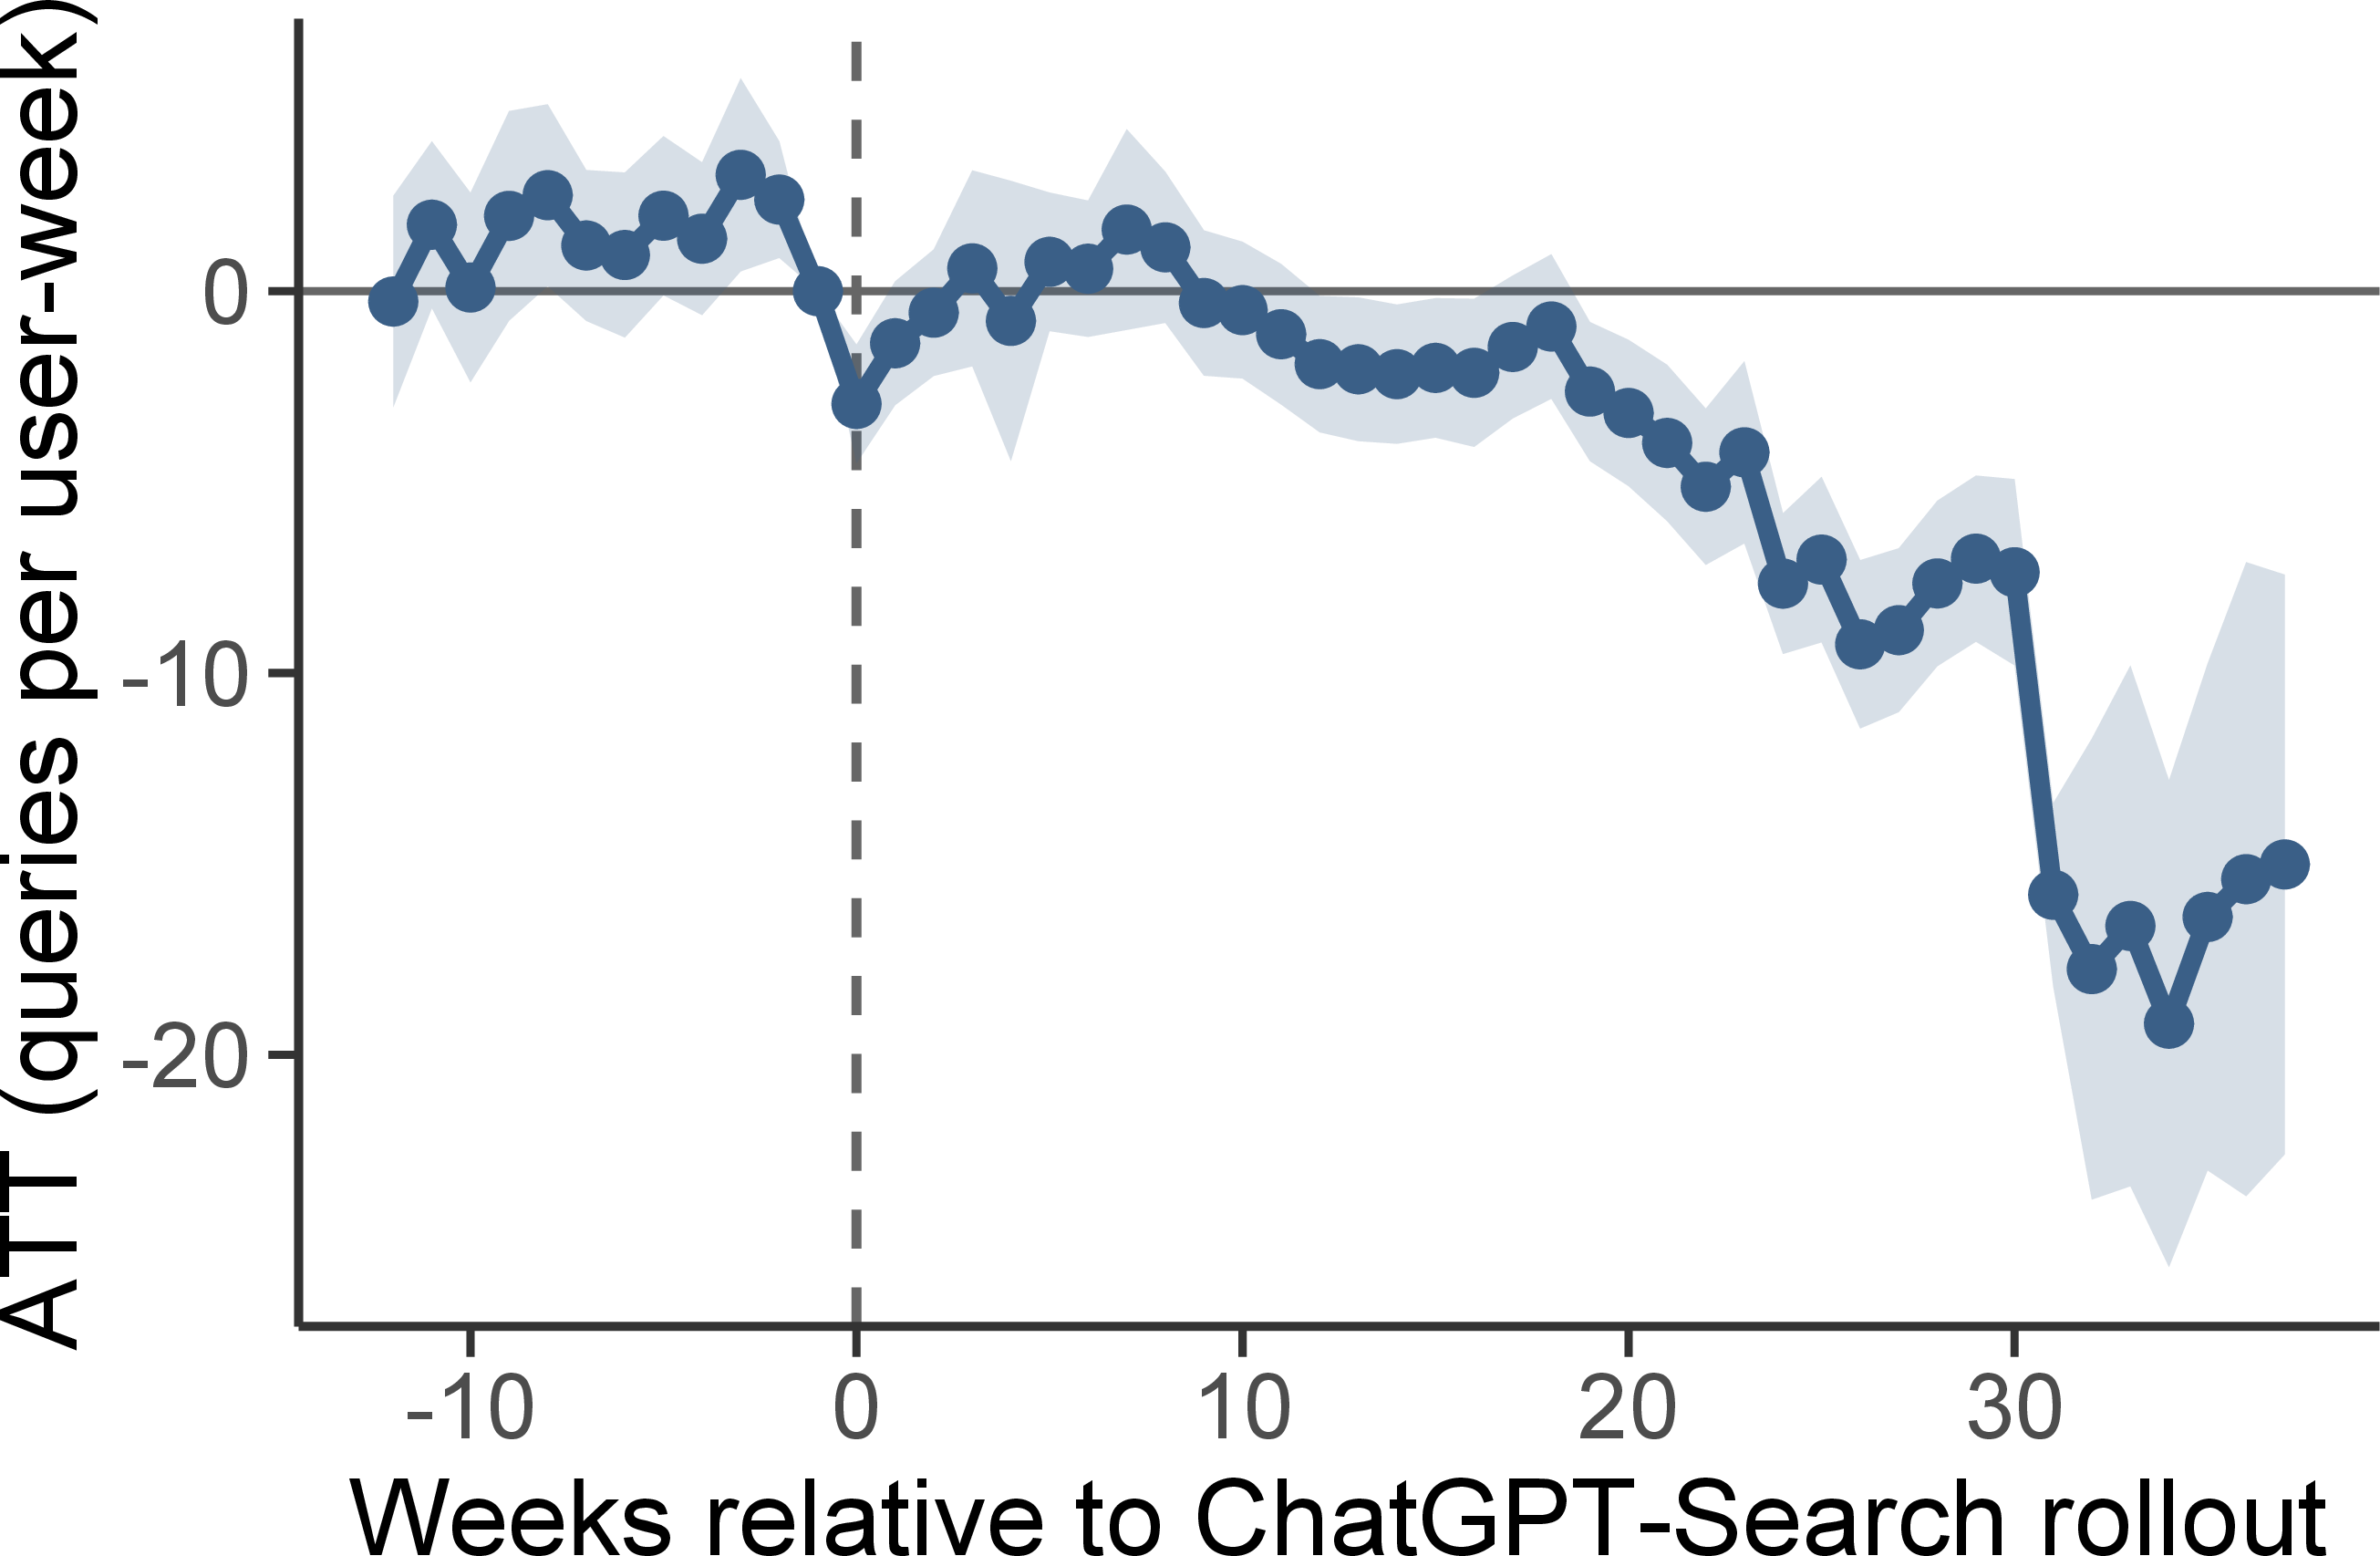

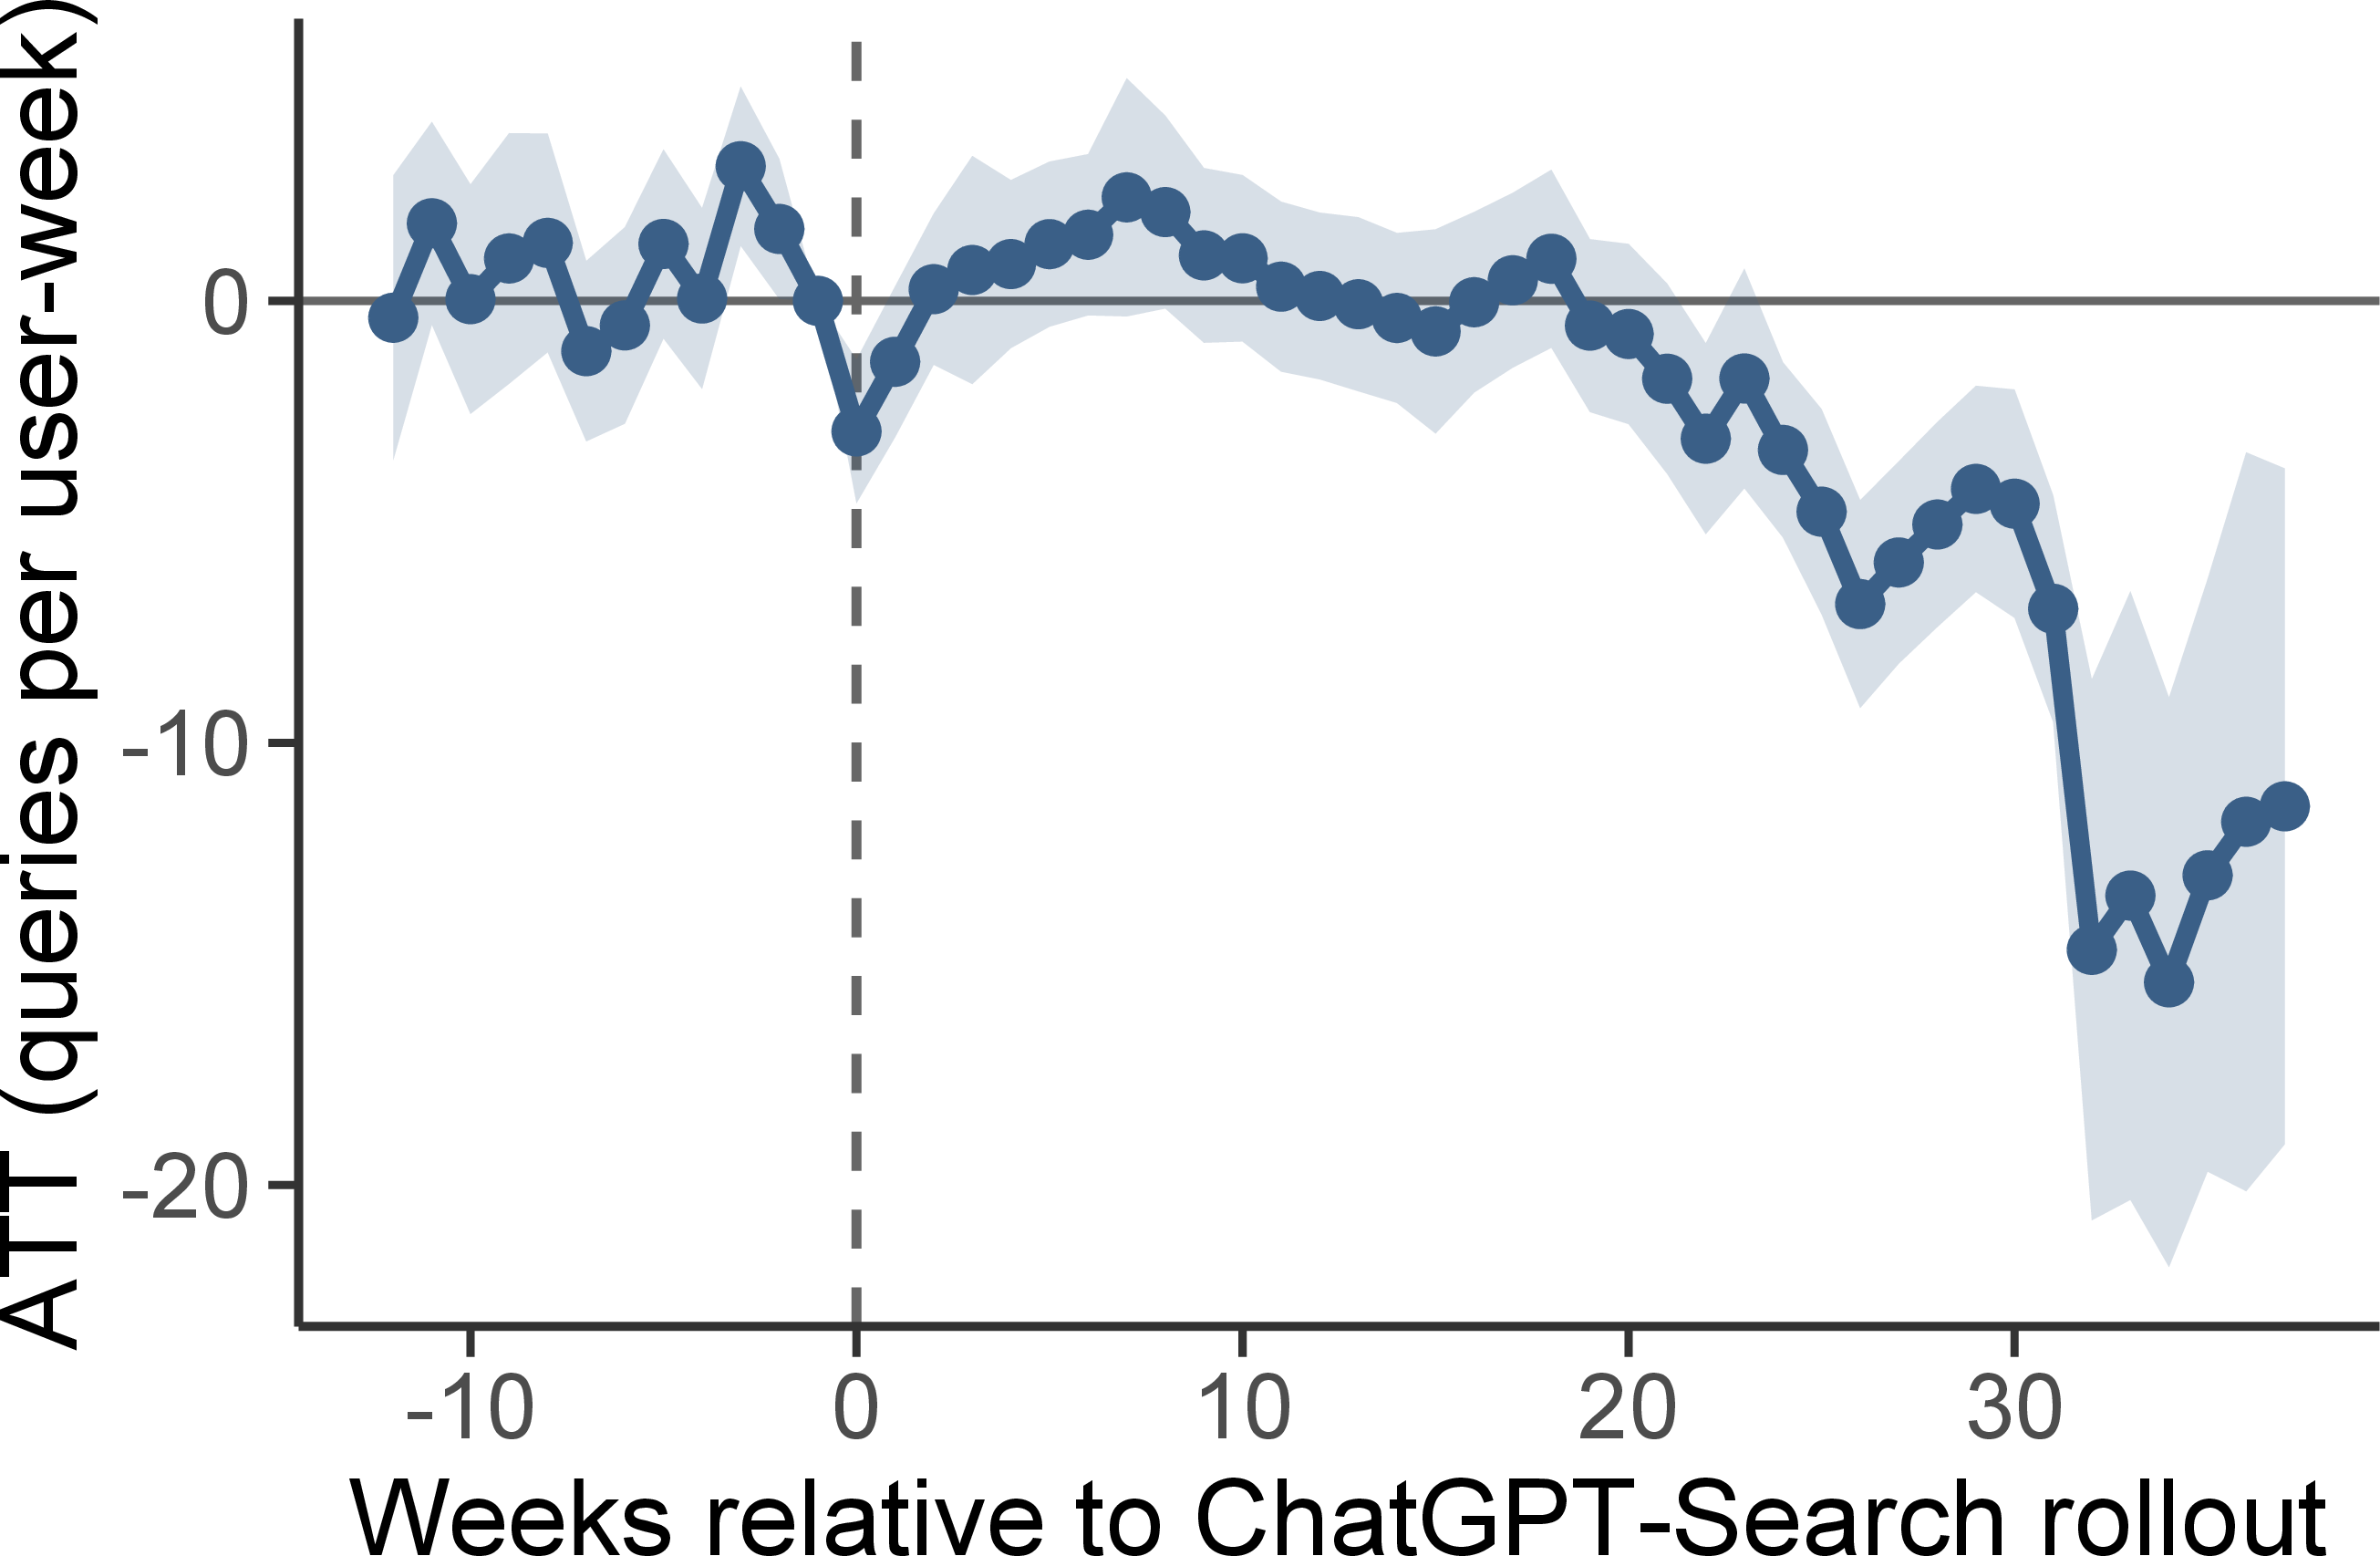
Figure 20: The two-expansion estimates are stable across cohort rules. a — \(N_{\text{full}}\)., b — \(N_{\text{strict}}\)., c — \(O_{\text{full}}\).
Because the stacked estimate averages cohort effects with implicit, size- and variance-driven weights, we confirm the result is not an artifact of that aggregation by re-estimating with the Callaway–Sant’Anna staggered DiD [16], which computes each \(ATT(g,t)\) against never-treated households and recombines them under heterogeneity-robust weights. The
control group is never-treated households, the treated set is \(L\cup A\) with group \(g\in\{12, 19\}\) (December 16 and February 5 in panel-week index), and the ACS 2023 representation
weights (10.2) enter at the user level through the weightsname argument of did::att_gt. The dynamic aggregation traces the same path as the stacked design (21).

10.7 Individual-adoption identification↩︎
As an alternative to externally-timed access, we identify displacement from each household’s own adoption of search-enabled ChatGPT. Adoption is dated from the paragen_submission telemetry of 5.3: the signal paragen_count counts a household’s foreground hits to backend-api/paragen_submission and backend-anon/paragen_submission, the endpoints behind ChatGPT’s
AI-search A/B-test surface. A household is treated from the first week of a run of at least three consecutive weeks with a positive signal (MIN_RUN \(=3\)); we restrict the sample to ever-adopters and estimate
a Callaway–Sant’Anna staggered DiD against not-yet-treated households, with implementation details following [11].
Dating treatment to a household’s own first sustained search-enabled use produces a much larger effect than the access-expansion design: weekly search queries fall by \(72.8\%\) on weeks \(20\)+ (22), well past the preferred \(-17.0\%\). Because the sample conditions on ever-adopting, and adoption tends to land amid a surge in information demand, the estimate absorbs self-selection that our externally-timed expansions hold fixed; we therefore read it as corroborating the direction and informational-task concentration of the displacement effect, not its magnitude.
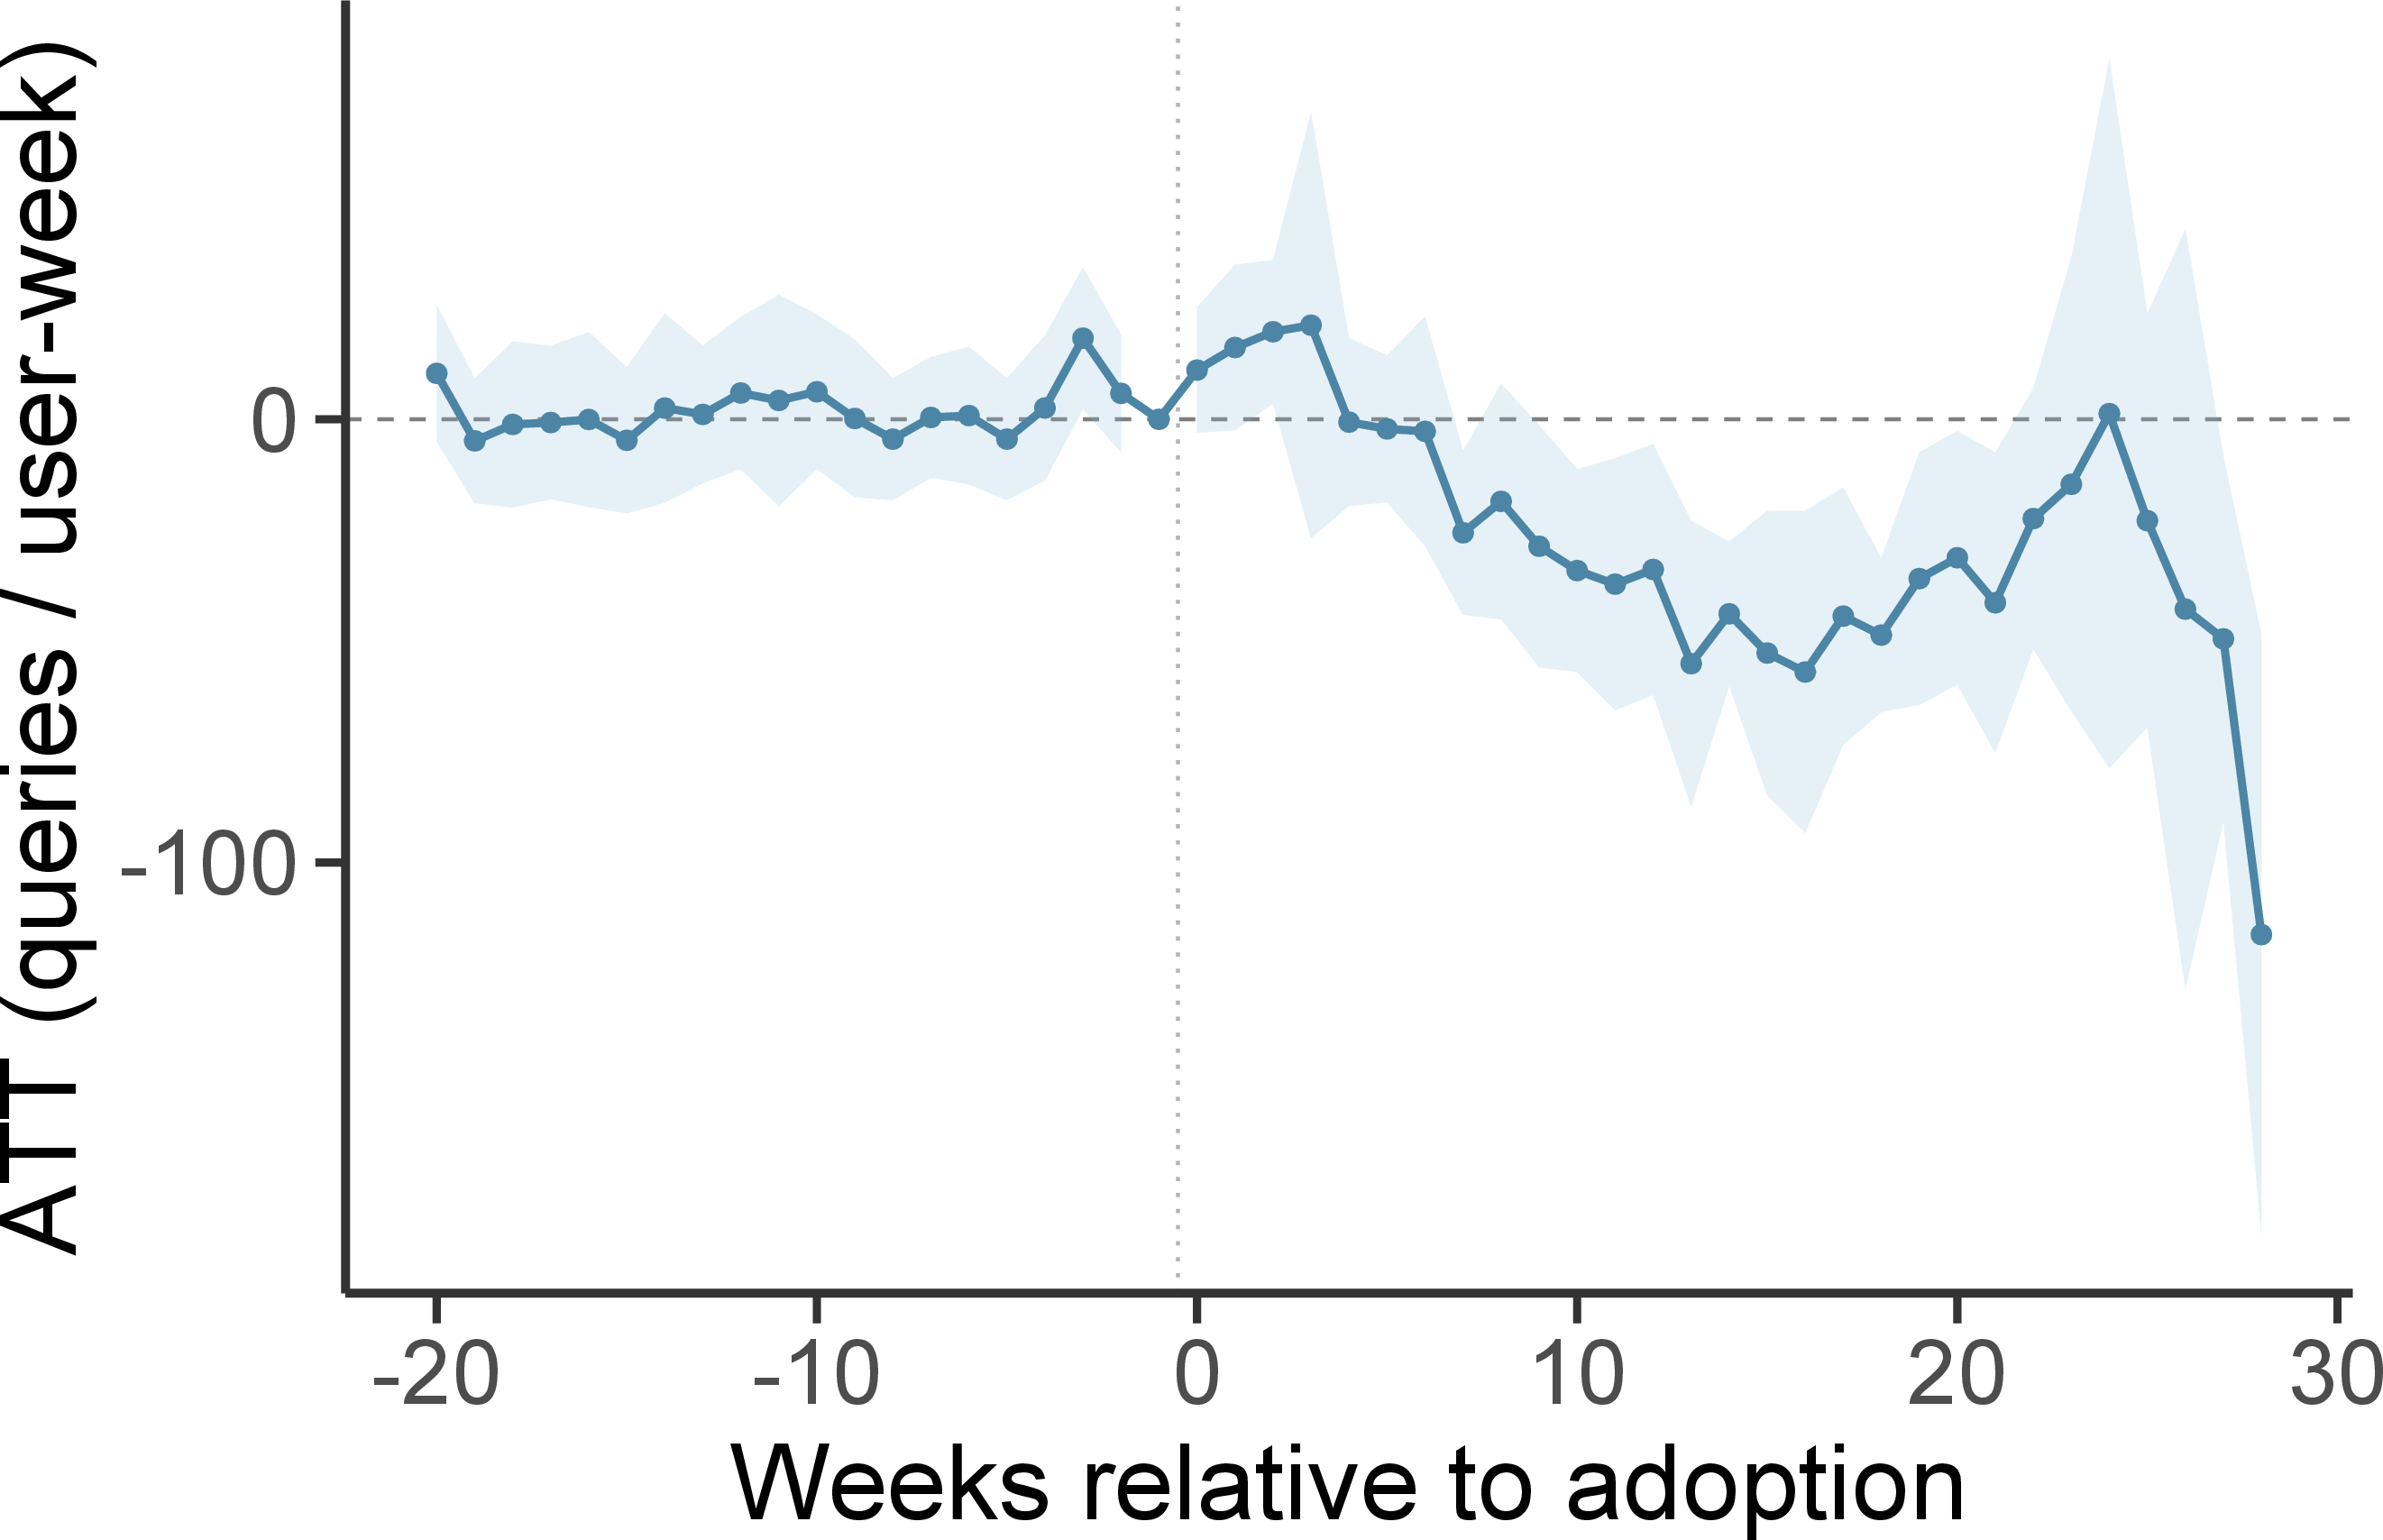
This design is informative precisely because its identifying variation differs from the preferred one: individual adoption can coincide with changes in information demand, whereas the access expansions assign treatment timing from externally announced rules and pre-expansion endpoint histories.
References↩︎
The signal is the
paragen_submissionendpoint. It is shared with Canvas, file uploads, and other paragen-routed A/B surfaces, so the measure is an imperfect proxy and likely an upper bound. It remains the best panel-wide search signal before July 2025, when message-levelf/conversationcoverage reaches analytic scale; Online Appendix 5.3 details the endpoint audit.↩︎Online Appendix 6.3 reconciles our estimates with public benchmarks. The appendix records each benchmark’s numerator, denominator, attribution window, population frame, and traffic filters.↩︎
Endpoint behavior is documented by the community-maintained everything-chatgpt catalogue of ChatGPT’s internal API (https://github.com/terminalcommandnewsletter/everything-chatgpt, accessed 2026-06-24) and by independent reverse-engineering write-ups; see, e.g., How I Successfully Reverse-Engineered ChatGPT to Create an Unofficial API Wrapper, HackerNoon (https://hackernoon.com/how-i-successfully-reverse-engineered-chatgpt-to-create-an-unofficial-api-wrapper, accessed 2026-06-24).↩︎
The anonymous flow requests CSRF cookies, then posts to
backend-anon/sentinel/chat-requirementsfor a sentinel token, then posts tobackend-anon/conversation; see the archived anonymous-chatgpt client (https://github.com/Mr-Destructive/anonymous-chatgpt, accessed 2026-06-24).↩︎Semrush, ChatGPT Traffic Analysis: Insights from 17 Months of Clickstream Data, updated 7 April 2026, https://www.semrush.com/blog/chatgpt-search-insights/ (accessed 2026-06-24).↩︎
The billing-retry endpoint is an Apple/iOS subscription-lifecycle state that OpenAI queries only for accounts holding an active App Store subscription; we infer this from direct inspection of the ChatGPT client rather than from public documentation. The customer portal is the Stripe-backed billing page reachable from Settings only on an active paid plan (OpenAI Help Center, Billing settings in ChatGPT vs Platform, https://help.openai.com/en/articles/9039756, accessed 2026-06-24).↩︎
Creating or editing custom GPTs requires a paid plan (OpenAI Help Center, Creating and editing GPTs, https://help.openai.com/en/articles/8554397, accessed 2026-06-24); the Google Drive and Microsoft 365 file connectors are restricted to paid plans (OpenAI Help Center, Add files from connected apps in ChatGPT, https://help.openai.com/en/articles/9309188, accessed 2026-06-24).↩︎
Anthropic, Web search (Claude blog), March 20, 2025, https://claude.com/blog/web-search (accessed 2026-06-27); the original
anthropic.com/news/web-searchannouncement now redirects here. Initially a U.S.feature preview for paid users; expanded globally on May 27, 2025.↩︎