DDB: Source-Level Interactive Debugging for Distributed Applications
July 07, 2026
1 Introduction↩︎
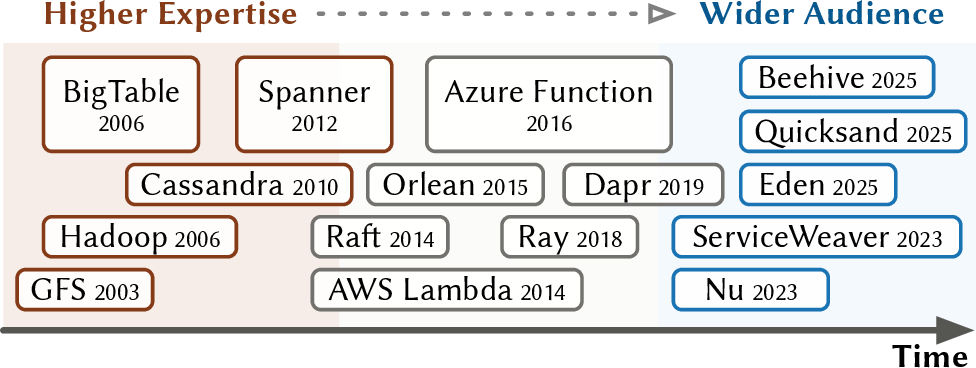
Serverless platforms, microservice architectures, and modular programming frameworks increasingly decompose what was once a single-process application into code that executes across multiple services and machines [1]–[3]. This trend spans actor frameworks [4]–[6], distributed application runtimes [7], serverless platforms [1], [8], memory-disaggregated runtimes [9]–[11], and modular programming frameworks that let developers write applications as logical monoliths while the runtime transparently distributes execution across processes [2], [12]. The result is that application developers—who may have no profound expertise in distributed systems—are now routinely writing code whose execution spans dozens of processes. As these paradigms and infrastructure have emerged, the expertise barriers to adopting distributed programming have dropped substantially, as depicted in Figure 1.
For debugging single-process programs, a developer attaches a debugger (e.g., GDB [13], LLDB [14]), sets breakpoints, and inspects call stacks, variables, and caller state—a tight hypothesis–inspect–refine loop for understanding why code misbehaves. Once an application becomes distributed, this workflow collapses. A breakpoint in one process reveals nothing about the remote callers that triggered the current execution: the chain of upstream RPCs, the arguments they passed, and their runtime state remain invisible. Attaching separate debuggers to every upstream process and locating the correct thread among potentially hundreds [15] does not scale well. Moreover, pausing any process triggers leader re-elections, transaction aborts, or cluster-wide crash recovery, because distributed systems rely on failure-detection timeouts as short as 50–100 ms [16].
For traditional distributed infrastructure, such as large-scale storage systems [17], [18] and distributed databases [19], this absence of interactive debugging has been mitigated by heavy investment in alternative diagnostic tooling. The teams that build these systems at major organizations invest heavily in structured logging [16], distributed tracing [20]–[22], and custom monitoring infrastructure to diagnose faults in production. Application developers typically lack profound expertise and deep insights into distributed systems; without interactive debugging, they resort to iterative log-and-redeploy cycles that studies show consume days to weeks—and in extreme cases over a month—per fault [23], [24]. As quantified in our user study (§6.1), participants using baseline tools (GDB, distributed tracing) failed to localize cross-service faults in 61.5% of cases and often exceeded the 20-minute time limit.
These failures stem from a fundamental mismatch: each existing tool addresses a different aspect of distributed diagnosis, but none provides the interactive workflow that cross-RPC, source-level fault localization requires. Distributed tracing and logging reconstruct request paths and record event histories [20]–[22]; record-and-replay enables deterministic post-hoc analysis [25]–[27]. Interactive debuggers exist for parallel and HPC settings [28]–[30], but these assume each process can be paused independently without side effects—an assumption that breaks when applications use RPC timeouts for failure detection. None supports what application developers need: pausing a running distributed execution, navigating the cross-RPC call chain, and examining live runtime state across service boundaries.
We present DDB, a distributed interactive debugger that realizes this approach. With DDB, a developer can set a breakpoint once and it is automatically inserted across all relevant replicas, including processes that join later through scaling or restart. When the breakpoint fires, DDB defaults to a pause-the-world model (akin to GDB’s default behavior), halting all attached processes to provide a consistent global view. Because all processes are concurrently paused, waiting for manual inspection is safe: DDB virtualizes each process’s view of time so that application-level timeouts and timers are unaffected by the execution pause. Integrating DDB with a new RPC framework requires 20–60 lines of code and adds 1–5% throughput overhead. We evaluate DDB on gRPC, ServiceWeaver, Nu, and Quicksand across clusters of up to 122 processes.
We observe that in development and test environments, where coordinated global pauses are feasible, cross-RPC call stacks can be reconstructed by embedding compact causality metadata in every RPC; dynamic process sets can be managed through an intent-preserving control plane; and timeout cascades can be eliminated by virtualizing each process’s view of time, which requires addressing a temporal anomaly (static application state combined with advancing kernel time) that no existing clock-virtualization mechanism handles (§4.3). Because interactive debugging naturally targets staging and test environments rather than production, the overhead of these mechanisms is acceptable.
Like traditional interactive debuggers (e.g., GDB [13], LLDB [14]), DDB provides consistent global state snapshots through pause-the-world execution, targeting semantic logic and state errors across RPC boundaries; concurrency bugs that depend on precise thread interleaving fall outside this scope, as they do for all pause-based debuggers.
This paper makes the following contributions:
Distributed Backtrace (DBT). Cross-RPC stack reconstruction, transparent to user-level threads, that enables live inspection of caller state across RPC boundaries (§4.1).
Intent-Preserving Control Plane. A debug-intent abstraction that propagates breakpoints and commands across replica scaling, node churn, and computation migrations (§4.2).
Pause-Erased Time (PET). Time virtualization via Virtual Deadline Enforcement that decouples physical and logical time, enabling safe debugger pauses without timeout cascades (§4.3).
Implementation and Evaluation. We integrate DDB with four RPC frameworks in two languages (20–60 LoC each) and evaluate at 122-process scale: 1–5% throughput overhead, \(\sim\)30 ms backtrace latency, and <5 ms time jumps. A controlled user study shows DDB delivers 100% cross-service fault localization vs. aggregated 38.5% localization rate with baseline tools (§5, §6).
2 Background and Motivation↩︎
2.1 The Developer Workflow and the Missing Capability↩︎
Consider a developer debugging a distributed key-value store where certain read requests return stale values after a write. The developer can reproduce the issue with a specific sequence of write and read operations issued from a test client. Distributed tracing identifies the request path: a client request reaches a router, which forwards it to one of several "storage-node" replicas. Structured logging on the storage node confirms that the node served the read from a cached entry and that a cache-invalidation RPC from the router did arrive, but the cached entry was not updated.
At this point the developer knows where the stale read occurs and what happened, but not why the invalidation failed to take effect. Understanding the root cause requires inspecting runtime state that no existing log captured. The root cause lies in cross-service runtime state: what version identifier did the router embed in the invalidation RPC, what did the storage node’s comparator evaluate, and did the invalidation target a different cache slot than intended? In single-process development, GDB answers such questions directly: the developer sets a breakpoint, inspects local variables, and walks the call stack. For a distributed application, no equivalent tool exists.
The developer falls back to iterative logging: instrumenting the invalidation handler, redeploying, and re-running the test. Each round reveals only the specific variables the developer chose to log; when the first round clears the version identifier, suspicion shifts to the router’s serialization logic, requiring a second service to be instrumented and redeployed. After several such cycles and over an extended period of time, the developer discovers that the router was embedding a version field from a stale routing-table entry—a conclusion that a single interactive inspection of the cross-service call chain could have reached in minutes.
Monitoring, tracing, logging, and record-and-replay each address a distinct need, but none provides the capability this workflow demands: live, interactive inspection across service boundaries. The following subsections detail the entrypoints where interactive debugging begins (§2.2) and the specific challenges that prevent it from working across process boundaries (§2.3).
2.2 Entrypoints for Interactive Debugging↩︎
An interactive debugging session begins at an entrypoint, such as a manual breakpoint, a watchpoint, an assertion failure (SIGABRT), or a memory fault (SIGSEGV). In single-process development, these entrypoints cleanly pause
execution for live inspection. In a distributed setting, catching the event is insufficient because the root cause often resides in an upstream remote caller or manifests across dynamic, auto-scaling replicas. Regardless of the specific trigger, every
entrypoint shares a core requirement: once execution pauses, the developer must reconstruct the full cross-process execution context—including the chain of remote callers, their arguments, and their runtime state—to reason about the application. The next
section examines the specific challenges that make this reconstruction difficult.
2.3 Why Interactive Debugging Breaks Across Process Boundaries↩︎
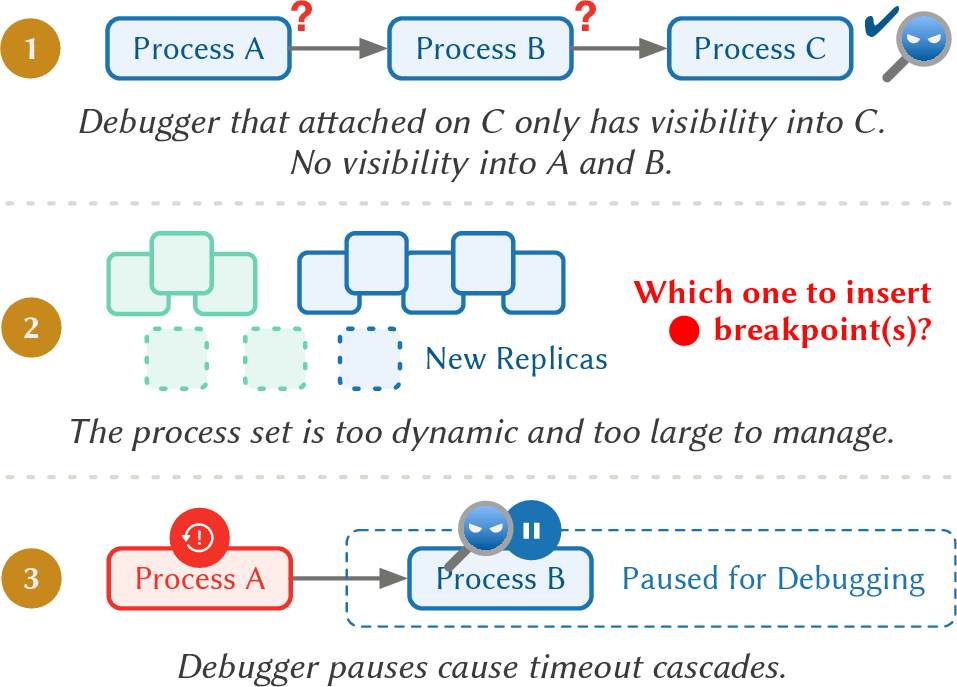
Distributed execution breaks interactive debugging in three ways (1⃝–3⃝ in Figure 2): call stacks end at process boundaries, debugging state does not survive churn, and temporary execution pauses trigger timeout-based failure detection.
Call stacks stop at the process boundary (Figure 2 1⃝). Consider a request that traverses services A → B → C. The developer suspects C’s handler and sets a breakpoint. When the breakpoint fires, GDB reveals C’s local stack but nothing about B or A — neither the arguments B passed nor the execution path that led B to issue the call. Recovering this context requires attaching a separate debugger to B, identifying the correct thread among potentially hundreds, inspecting B’s stack, and repeating for A. The manual effort scales linearly with call depth. User-level threading compounds the difficulty: if B uses goroutines, the goroutine that sent the RPC to C may have been descheduled and its OS thread reused, so GDB shows the wrong stack entirely.
Debugging operations require per-process manual effort (Figure 2 2⃝). Consider the 180-process deployment of the socialnet benchmark [31]. To debug an issue, a developer must manually identify relevant replicas and insert breakpoints on each individually, which is
a cumbersome and tedious process. Furthermore, the process set changes constantly: auto-scaling adds replicas, rolling restarts replace them, and emerging distributed programming frameworks [2], [11], [12], [32] introduce runtime computation migrations. Unless breakpoints automatically follow these state changes and
computation migrations, the developer silently loses debugging coverage as execution moves across processes.
Execution pauses cause timeout cascades (Figure 2 3⃝). Distributed applications use timeouts extensively to detect and handle failures. We surveyed timeout thresholds in three open-source distributed systems: LogCabin [33] (a Raft implementation), RAMCloud [34] (in-memory distributed storage), and Nu [12] (a distributed programming framework). Thresholds range from 100 ms (RPC retry) to 500 ms (election timer). A developer pausing at a breakpoint for even a few seconds triggers every timeout in this range. The consequences range from harmless (extra heartbeats) to severe (aborted transactions, cluster-wide crash recovery for a healthy node). The disruption breaks the intended debug flow. For example, when crash recovery is wrongfully triggered by execution pauses, the system transitions to a recovery state that did not exist before the pause, and the developer ends up inspecting recovery logic instead of the intended code path.
3 Overview: A DDB Debugging Session↩︎
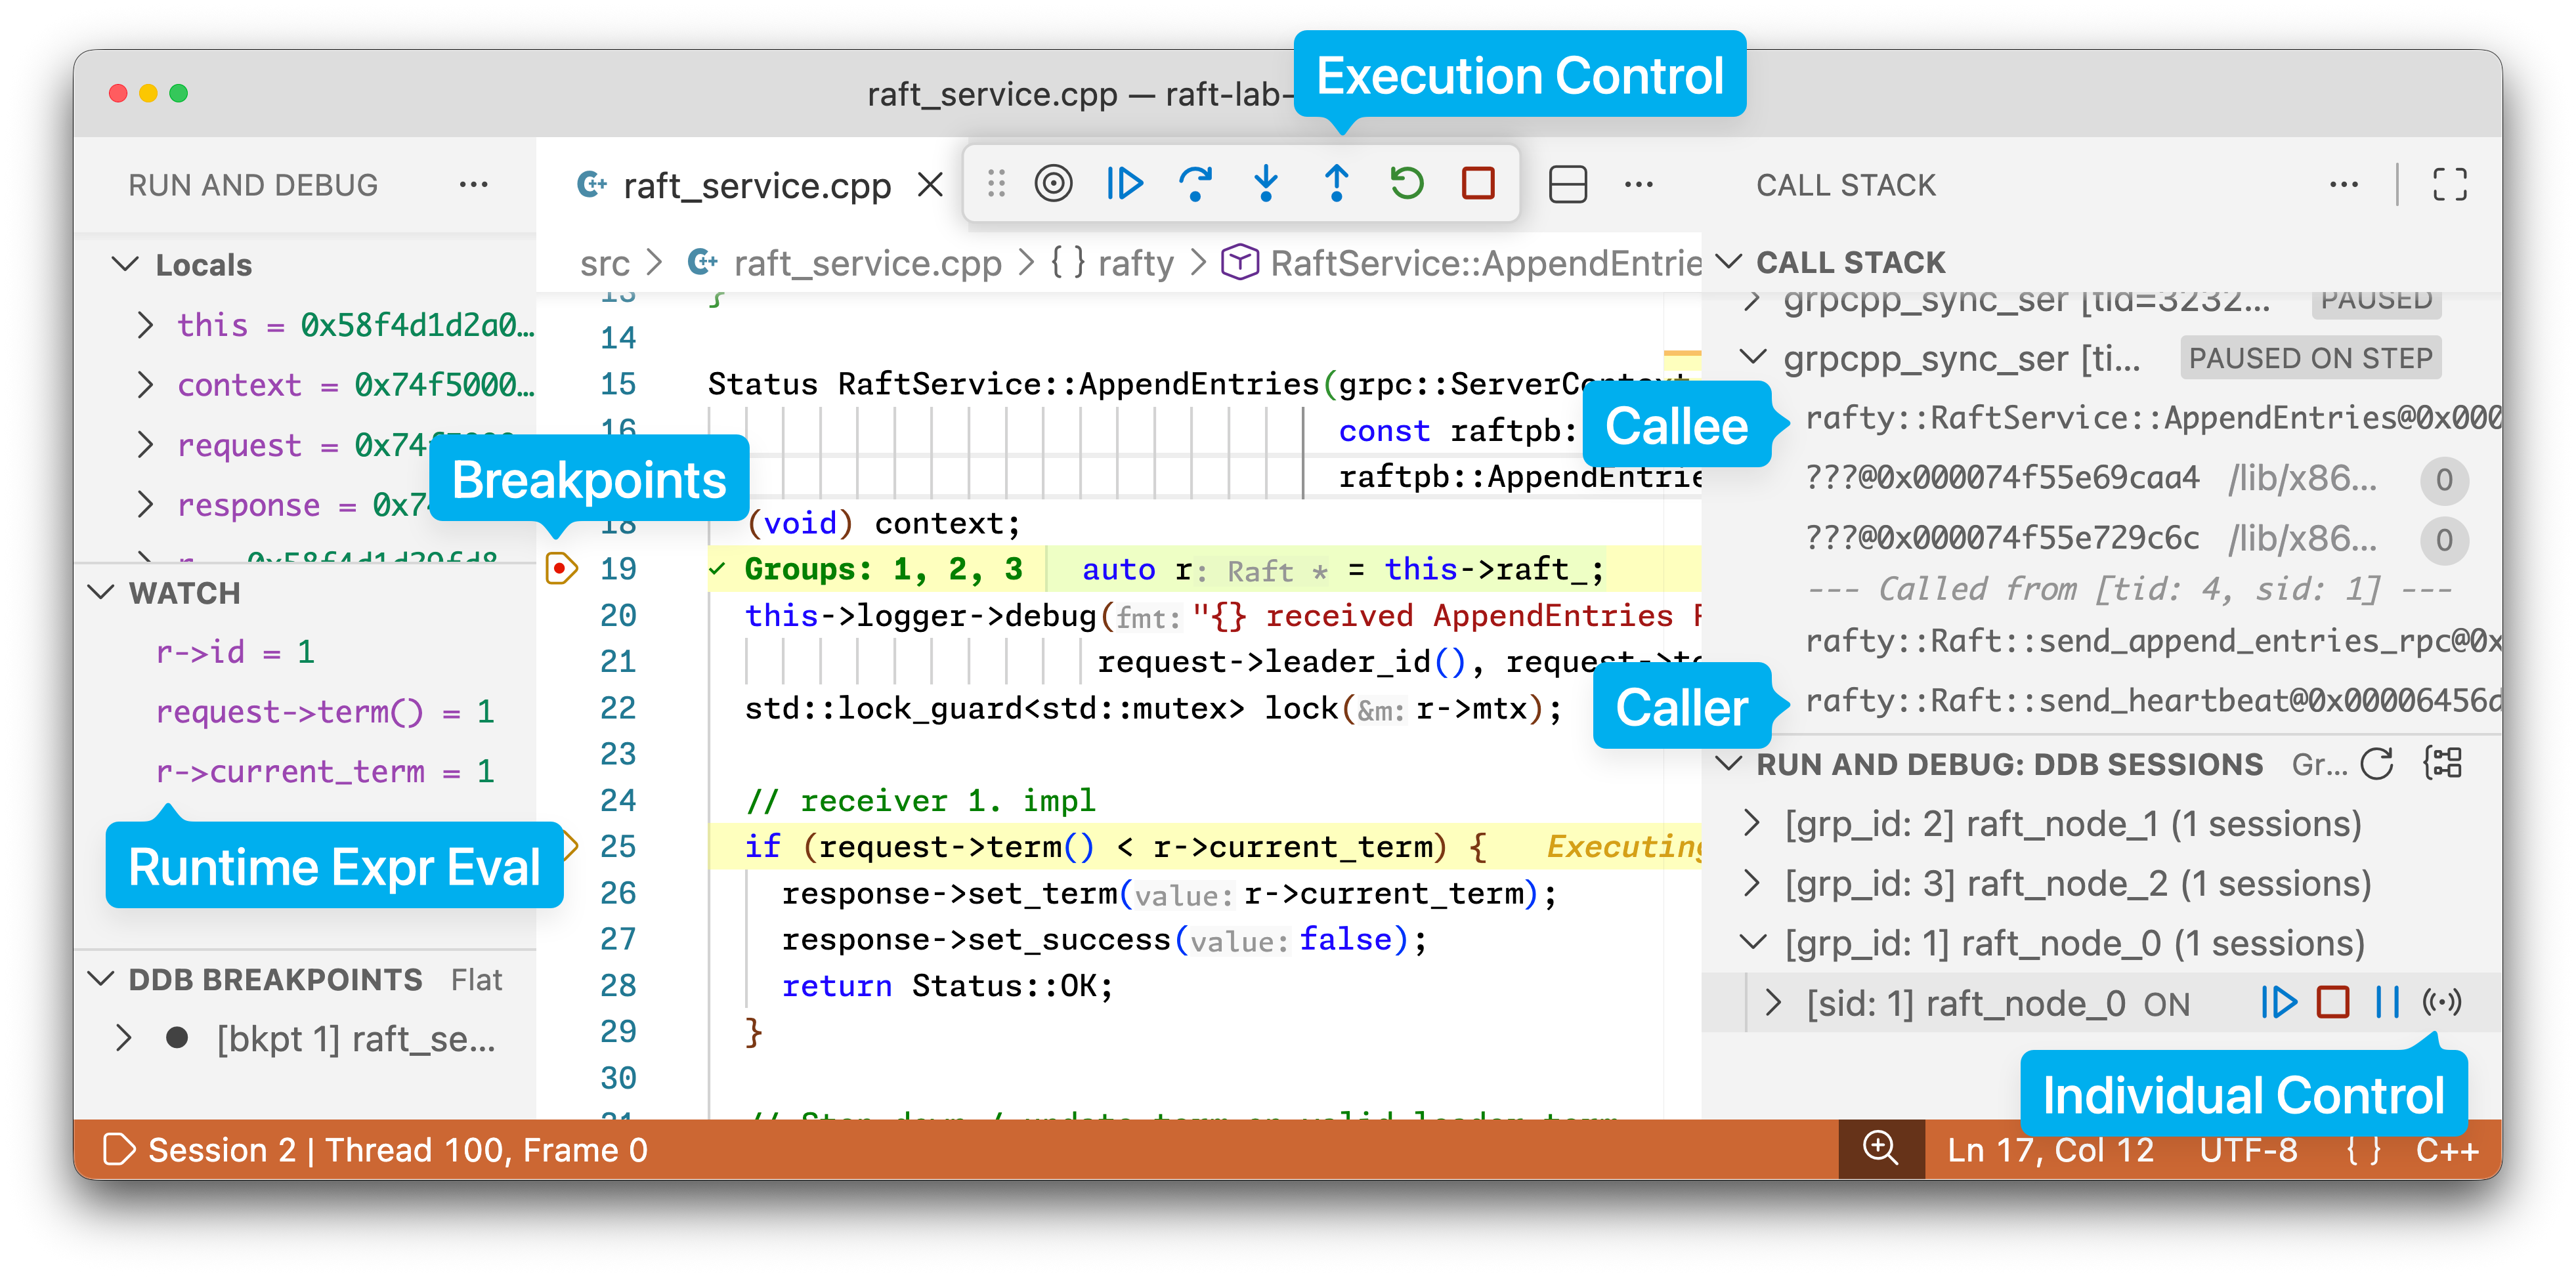
To illustrate how DDB addresses the challenges outlined in §2, Figure 3 shows a live debugging session on a 3-node Raft cluster. In Raft, a single
leader node coordinates the cluster by sending periodic heartbeat RPCs (AppendEntries) to each follower replica; if a follower stops receiving heartbeats, it initiates a leader election. The developer is investigating a bug
where followers are improperly rejecting the leader’s heartbeats. Instead of adding iterative logging statements and restarting the cluster, the developer attaches the DDB VSCode extension and resolves the issue in a single
interactive session.
Setting a breakpoint across replicas. The developer sets a single breakpoint at the AppendEntries RPC handler. DDB’s intent-preserving control plane (§4.2) automatically applies this breakpoint to all follower replicas in the cluster, without requiring the developer to identify or attach to each process individually.
Pausing the cluster safely. When the leader broadcasts its next heartbeat, both followers hit the breakpoint concurrently and DDB defaults to a pause-the-world model, halting the entire cluster. Without DDB, this pause would be fatal: Raft’s election timeouts (typically 100–500 ms) would expire immediately, triggering a spurious leader election that destroys the state being debugged. DDB’s Pause-Erased Time (PET) (§4.3) virtualizes each process’s clock, keeping the cluster’s failure detectors entirely unaware of the execution pause.
Inspecting the cross-RPC call chain. With the cluster safely paused, the developer opens the Call Stack pane. Instead of the local stack frames that a single-process debugger would show, DDB presents a
Distributed Backtrace (DBT) (§4.1) that extends from the follower’s handler back to the leader’s send_heartbeat caller frame. The developer clicks on the upstream leader frame to inspect the exact arguments
sent across the network. The local variable and expressions will be automatically re-evaluated in the context of the selected frame.
Granular per-process control. While the cluster remains globally paused, the developer selects one follower and single-steps it forward (identifiable as “PAUSED ON STEP” in the interface), while the other follower stays suspended at the
entrypoint. The developer then evaluates expressions in the Watch pane—comparing the incoming request->term() against the local r->current_term—and observes how divergent state across replicas affects execution flow,
arriving at the root cause. This coordination is managed by DDB’s intent-preserving control plane (§4.2).
This workflow relies on three core technical pillars—Distributed Backtrace, an intent-preserving control plane, and Pause-Erased Time (Figure 4), as described in the following section.
4 DDB Debugging Model and Design↩︎
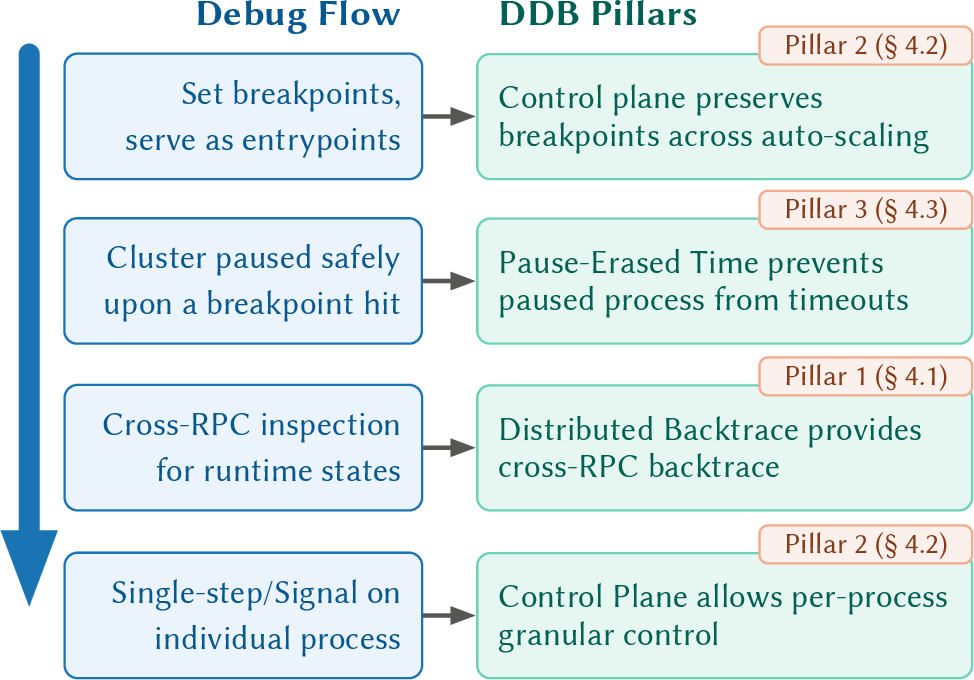
DDB is organized around three pillars: Distributed Backtrace (DBT), an intent-preserving unified control plane, and Pause-Erased Time (PET). For each pillar, we describe the developer-facing abstraction, the mechanism that realizes it, and the guarantees it provides.
4.1 Distributed Backtrace (DBT)↩︎
Abstraction. When execution pauses at any entrypoint, the developer issues dbt command to start a distributed backtrace. DDB returns a single, unified call stack that begins at the current frame in the paused process and
extends backward across each RPC boundary to the root of the request path. For a request that traversed A → B → C, pausing in C and issuing dbt presents frames from C, then B, then A, in standard GDB backtrace format. The developer can
navigate to any frame (including frames in remote processes) to inspect local variables, read heap-allocated objects, and modify values, much as in single-process debugging. We use this three-service request path as a running example throughout the rest of
this section.
Mechanism. Realizing DBT requires solving two problems: locating the correct caller context in a remote process, and presenting a coherent unified call stack.
Caller-context capture design. When process A sends an RPC to B, the distributed backtrace must record enough context at the call site so that the caller’s stack can later be reconstructed to form a coherent call stack along the entire causal chain (the exact recursive algorithm is detailed in Appendix §10.1). A strawman design records the caller’s OS thread ID at the time of sending the RPC and, at reconstruction time, retrieves the thread using that ID to perform stack unwinding. This fails when the application uses user-level threads (uthreads), such as Go goroutines, CILK workers [35], Folly fibers [36], Shenango [37], Caladan [38], etc., that multiplex over a smaller pool of OS threads. Between the RPC send and the callee’s pause, the runtime may reschedule the calling uthread off its original OS thread. Therefore, unwinding the stack on the caller thread identified by the OS thread ID produces the wrong call frames.
DDB instead captures the thread context (a set of register values that identify the stack) at the call site and embeds it directly in the RPC payload as a compact caller-context metadata. Because the metadata
carries the thread context rather than a thread identity, it remains valid regardless of thread scheduling decisions made by the runtime. This embedding is the only change to the RPC protocol and requires approximately 20LoC per framework. At the
callee process, the RPC handler extracts this metadata and stores it in a lightweight injected extraction frame (DDB::Backtrace::extraction, as shown in Figure 5), making it available on the stack for DDB to read at reconstruction time.
Cross-process stack reconstruction. When dbt is issued at process C, DDB locates the injected extraction frame in C’s stack and reads the caller-context metadata, which identifies B by the embedded IP
address and PID. Crucially, the reconstruction of B’s stack does not happen inside C’s address space. Instead, DDB’s centralized control plane reads the metadata, contacts the debugger agent attached to process B out-of-band,
and fetches the necessary stack memory segments. The agent then temporarily restores B’s thread context and performs standard DWARF stack unwinding using B’s debug symbols. DDB repeats this procedure for B’s caller, iterating
until no further caller-context metadata exists. It then concatenates all stack frames into a single stack and presents it to the developer. The entire procedure is transparent and the developer sees one contiguous call stack.
Guarantees. DBT provides three guarantees. Completeness: the cross-RPC caller chain is reconstructed to the root or to the earliest reachable caller, correctly recovering each caller’s stack regardless of user-level thread rescheduling. Inspectability: every reconstructed frame exposes locals, arguments, and heap-accessible objects for reading and modification. Order preservation: frames appear in reverse of request-path order (from callee to ancestor callers).
Edge cases. Under replication, DBT reconstructs the chain for the specific request that reached the paused process. If a caller has terminated before the callee pauses, DBT reports a truncated backtrace with a "caller terminated" annotation. If an upstream framework lacks DDB integration, DBT stops at that boundary and reports the truncation reason.
None
Figure 5: Illustration of the frame injection. Blue numbers on the left indicates the frame number, where 0 is the outermost frame and 4 is the innermost frame. Frame #2 is the injected frame. The local variable meta is inside
the extraction frame..
4.2 Intent-Preserving Unified Control Plane↩︎
Abstraction. We define a debug-intent as a triple: a source-code location (file and line number), a scope identifying which processes to target ("all replicas of service X" or "a specific process"), and a debugger command ("set breakpoint," "continue," "evaluate expression," "send signal", etc.). The control plane resolves each intent against the current application topology and propagates it to every matching process. This unified control plane lowers the cognitive overhead of developers in operating individual debuggers when deal with distributed applications. Crucially, to provide a consistent view of distributed state, the control plane enforces a pause-the-world policy by default. When an intent (such as a breakpoint) triggers a pause in one process, the control plane automatically broadcasts a pause command to all other processes attached to the debugging session. This prevents in-flight requests from advancing while the developer is inspecting the system, decoupling the human speed of inspection from the execution speed of the cluster.
For example, if a developer sets a breakpoint targeting "all replicas of service B", DDB will preserve the debug-intent and install the breakpoint on every current replica and on every future replica that joins, restarts, or receives a migrated computation. The developer never manages a process list. This abstraction reduces the operational complexity of debugging from per-process to per-intent, regardless of deployment size.
Logical Groups and Scope Resolution. DDB organizes processes into logical groups. By default, processes running the same binary belong to the same group. In the case of microservices, the default
binary-based grouping policy puts all replicas of the same service under the same group. In the socialnet example with 36 services at 5 replicas, the developer sees 36 groups rather than 180 processes; expanding a group reveals its
members.
When a developer specifies a source-code location, DDB performs automatic scope resolution: it identifies which logical groups map that source file, presents them as selectable scopes, and lets the developer choose a target. This eliminates the need to know which binary hosts a source file—a non-trivial question in distributed application deployments. Internally, DDB maintains a two-level source-map, which maps source-code paths to logical groups and maps logical groups to running processes.
Intent Preservation Under Dynamics. Distributed applications are dynamic: auto-scaling, rolling restarts, and failover continuously change the process set. The control plane tracks these changes and continuously enforces each intent on the correct set of processes. Specifically, it maintains a continuous invariant: an intent is active on a process if and only if the process matches the intent’s logical scope and its loaded binary maps the specified source-code location. When a new process joins the system, the control plane evaluates this invariant and applies the relevant intents immediately upon debugger attachment. Conversely, when a process terminates, its debugging state is cleanly garbage-collected. The intent is a specification (e.g.,"all replicas of service X should a breakpoint inserted at line 42") and DDB continuously enforces it.
For frameworks that support computation migration (Nu [12], Quicksand [11], [32], ServiceWeaver [2]), breakpoints follow the computation automatically: because the control plane targets logical scopes rather than physical processes, the receiving process simply evaluates the invariant and applies the breakpoint locally. Heap state requires additional handling, as a migrated caller’s heap may no longer reside on the original process; DDB’s modular control plane addresses this through framework-specific plugins that locate and restore heap segments on demand (Appendix §13).
Guarantees. Invariant enforcement: the control plane maintains strict consistency with the live topology; no process matching the intent’s scope misses it, and no out-of-scope process receives it. Minimal developer
expression: developers operate at source-file and logical-group granularity, abstracted from physical process churn or state migration. Composability: intents compose orthogonally with DDB’s other primitives; a
developer can specify an intent, allow the system to continuously enforce it across churn, and subsequently issue commands like dbt against the paused state without managing the underlying topology.
4.3 Pause-Erased Time (PET)↩︎
Problem. Every debugger-induced pause — breakpoint hit, single-step, manual interrupt — advances the system clock while the application is stopped. From the application’s perspective, time jumps by the pause duration. Distributed applications fundamentally rely on these strict physical timing invariants for failure detection: a missed heartbeat triggers a leader election [39], a late RPC triggers a retry storm, and an expired lease triggers client disconnection. A developer pausing a process for ten seconds triggers every timeout below that threshold, forcing the distributed system into recovery procedures that permanently alter the state and destroy the intended debug flow. Because of this coupling, pause-based interactive debuggers has historically been considered impractical in distributed contexts [15], [28].
| Semantic | Description | Example POSIX APIs |
|---|---|---|
| get_time | Get the current timestamp | clock_gettime gettimeofday |
| sleep_until | Sleep until the absolute deadline | pthread_cond_timedwait sem_timedwait |
| sleep | Sleep for the relative duration | sleep nanosleep |
Abstraction. Pause-Erased Time gives each debugged process a pause-erased view of time: a clock in which all debugger pauses are invisible. Timestamps and timer waits operate against this clock. From the application’s perspective, it was never paused; thus, mitigating the timeout cascades caused by debugger-induced execution pauses.
PET covers three broad categories of time semantics that implement a large portion of timeout and timer logic observed in distributed systems: reading the current timestamp (e.g.,get_time), sleeping until an absolute deadline
(e.g.,sleep_until(deadline)), and sleeping for a relative duration (e.g.,sleep(duration)). These semantic categories map to a wide range of underlying POSIX APIs, as demonstrated in Table 1.
Pause-offset Accumulation. DDB records a timestamp when a given debuggee process are paused and another when it is resumed. The difference is the measured pause duration. DDB
accumulates these into a running cumulative pause offset. Before resuming execution, DDB publishes this offset to a local shim layer, which sits between user-level process and the libc library to intercept time
API calls. This shim layer intercepts POSIX time API calls and subtracts the cumulative offset from the libc and kernel’s return value, erasing all pauses from the process’s view of time.
Virtual Deadline Enforcement. The offset mechanism handles get_time correctly, but a subtler problem arises for processes that are sleeping when the debugger pauses them. On resume, the kernel observes that the
real-time deadline has passed and wakes the thread immediately—before the pause-adjusted deadline has been reached. This premature wakeup can produce spurious timeouts.
PET prevents this with the Virtual Deadline Enforcement mechanism. The shim layer tracks the pause-adjusted absolute deadline for every active timer wait. On every return from the underlying libc sleep primitive—whether a genuine
wakeup, a signal interruption, or a spurious wakeup from a debugger resume—the shim layer reads the current PET. If the current PET is earlier than the adjusted deadline, the deadline has not been reached in pause-erased time; the shim layer re-arms the
wait for the remaining duration and returns to the kernel sleep. Application code does not execute until the PET deadline is genuinely reached. The shim layer re-traps the thread whenever a resume would wake it prematurely.
Virtual Deadline Enforcement is a fundamental requirement for interactive distributed debugging. Without it, dynamically erasing pauses would successfully adjust get_time but fail to prevent timeout cascades triggered by in-flight sleeps.
Unlike virtual clocks in discrete event simulation [40], [41] or chaos engineering [42]–[45]—which use static offsets or state rollbacks—PET handles a fundamentally different temporal anomaly: the application state remains static while real time progresses, requiring dynamic offset
growth upon every pause.
Guarantees. PET satisfies two invariants; the formal correctness proofs are detailed in Appendix §9.1.
Monotonicity. PET never decreases. Two consecutive
get_timecalls return non-decreasing values regardless of intervening pauses.Timer correctness. Time-blocking operations (both absolute deadlines via
sleep_untiland relative durations viasleep) return only when PET reaches or exceeds their target. Any pause during the sleep, and any premature kernel wakeup from a debugger resume, causes the shim to re-arm. Application post-sleep code executes only when the intended PET duration has genuinely passed.
These invariants ensure that application logic that is correct with respect to real time remains correct with respect to PET. Timeouts fire when and only when the application intends, as if no debugger were attached. PET works for both monotonic and wall-clock time APIs (Appendix §9.3).
Limitations. PET maintains virtual time purely within the boundaries of the attached cluster. It effectively prevents internal timeout cascades because all attached processes are concurrently paused (§4.2) and independently virtualize their local clocks. However, PET cannot virtualize the physical flow of time for external, true-time observers. If the cluster interacts with external systems that rely on physical time—such as an uninstrumented cloud storage service enforcing a strict lease expiration, or a third-party API gateway—those external services will perceive the developer’s pause as a genuine timeout. Thus, DDB’s temporal guarantees are strictly intra-cluster, requiring developers to either mock time-sensitive external dependencies or ensure the load-generating client is also attached to the control plane.
5 Implementation↩︎
We implement DDB on x86_64 architecture and Linux environment. We also add experimental support for aarch64.
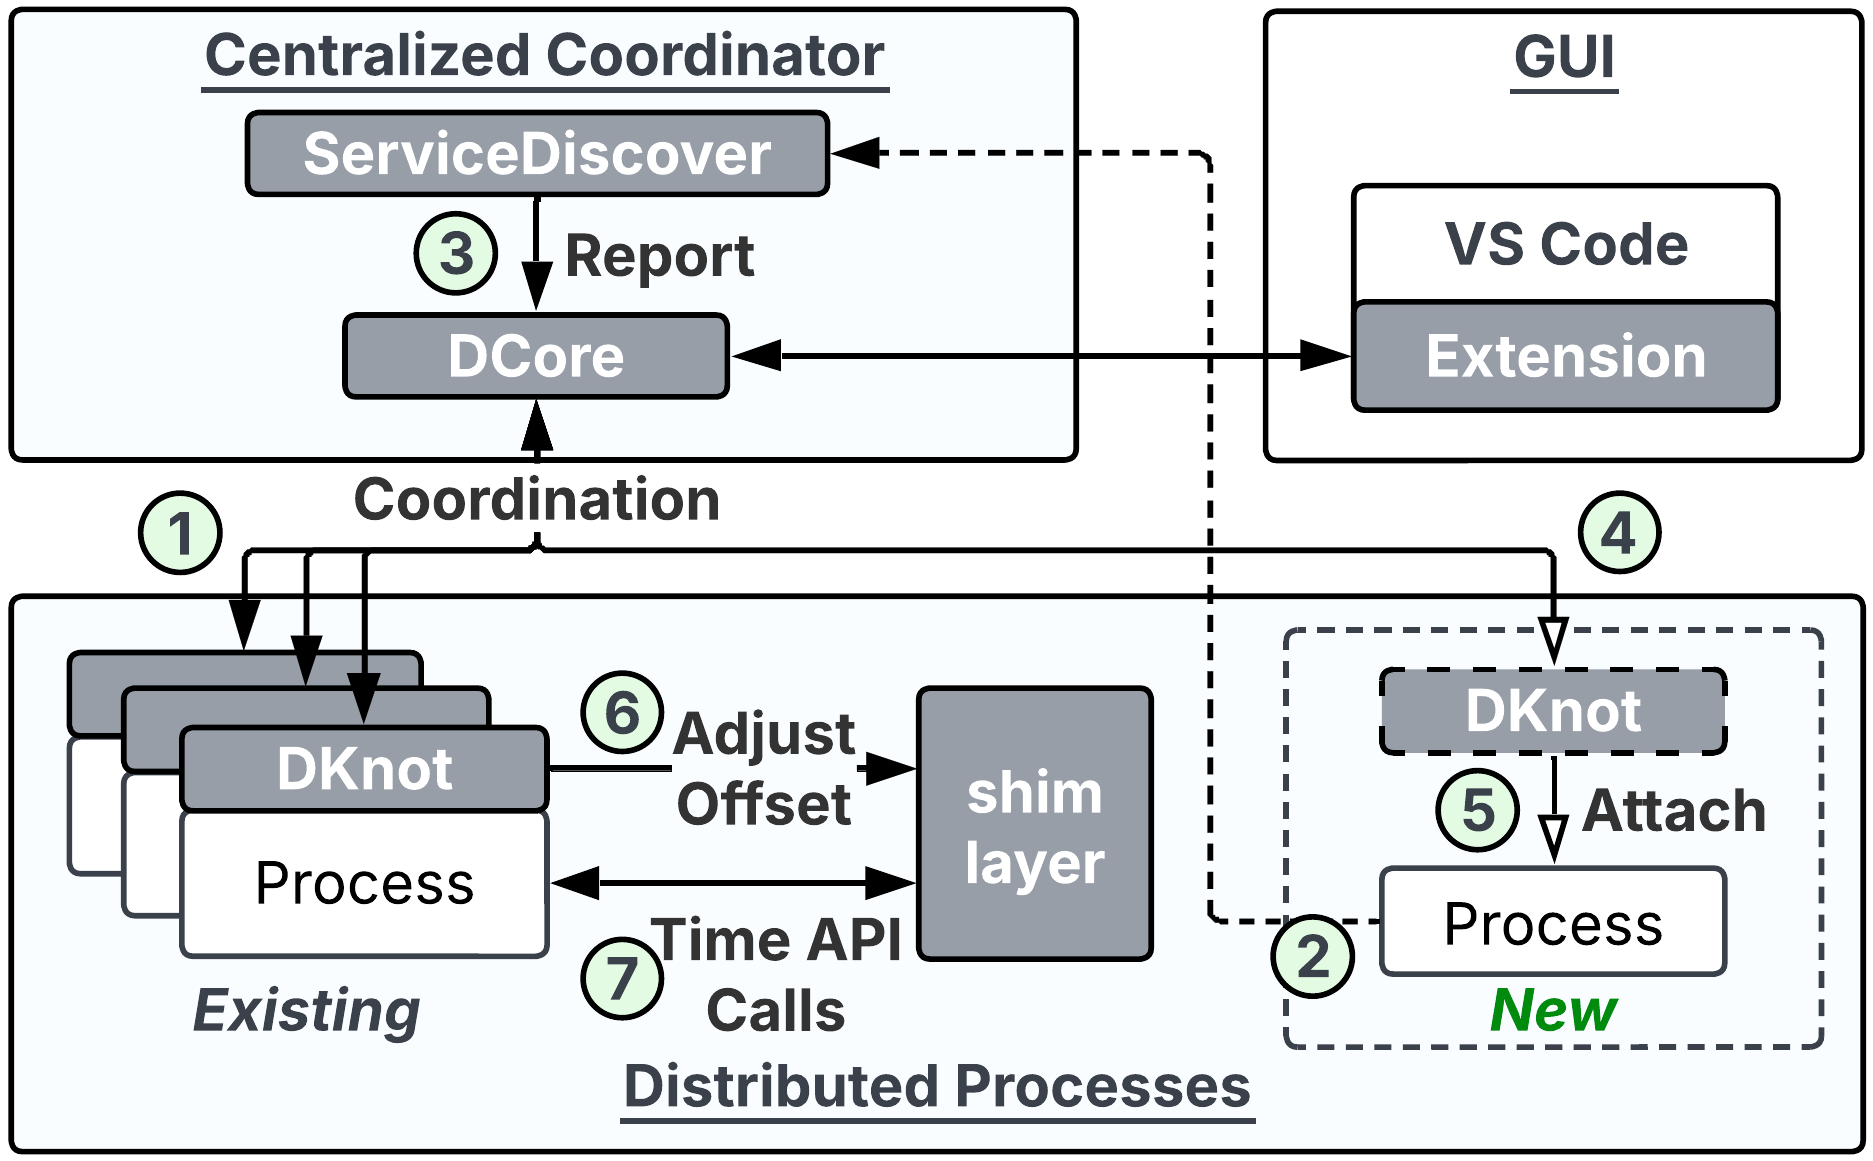
System Architecture. Figure 6 illustrates DDB’s architecture, which comprises a centralized coordinator, a graphical frontend, and per-process distributed components. The VS Code Extension serves as the graphical user interface (GUI) for the developer. This frontend communicates with the Centralized Coordinator, which uses ServiceDiscover to track dynamic process topologies and report them to DCore. DCore acts as the central engine, orchestrating debugging sessions and distributing coordination messages to the relevant Distributed Processes. At the application layer, DDB pairs each target process with a DKnot agent (an extended version of GDB). DKnot attaches to the underlying process, relaying debug-intents to the attached process, and implements the Distributed Backtrace.
To prevent timeout cascades, DKnot sends offset adjustments to a locally interposed shim layer. This shim layer intercepts POSIX time API calls from the process to enforce Pause-Erased Time. The shim layer approach uses LD_PRELOAD to
interpose on top the libc interfaces and works with vDSO transparently (Appendix §9.4). Finally, a lightweight DConnector integration library (not pictured) embeds caller-context metadata within RPC
payloads.
Interaction Between Components. The lifecycle of a debugging session follows the numbered steps in Figure 6. During normal execution, DCore maintains continuous coordination ( ) with all active DKnot agents. When a new process spins up ( ), ServiceDiscover detects its presence and reports ( ) to DCore updating the global topology. DCore then immediately initializes a new DKnot instance ( ) which performs an attach ( ) to the new process, ensuring seamless debug-intent propagation across dynamic scaling. When a process hits a breakpoint, DCore pauses the world and the DKnot agents calculate the precise timestamp of the pause time. Upon resuming, each DKnot calculates the accumulative paused duration and publishes it as an offset to its local shim layer ( ). The shim layer then intercepts all subsequent time API calls from the application ( ), seamlessly applying the offset to enforce the Pause-Erased Time abstraction.
| Component | LoC | Language | |
|---|---|---|---|
| DDB | DCore | 14,867 | Rust |
| DKnot | 1,401 | Python | |
| DConnector | 1,954 | C/C++/Go | |
| Adapter | \(\approx\)700 | TypeScript | |
| Framework Support | gRPC | \(\approx\)20 | C++ |
| Nu | \(\approx\)30 | C++ | |
| Quicksand | \(\approx\)60 | C++ | |
| ServiceWeaver | \(\approx\)10 | Go | |
| Ported Apps | socialnet | 3,154 | Go |
| 22,196 |
Codebase. To evaluate our realization, we added DDB support for four frameworks, gRPC [47], Nu [12], Quicksand [11], and ServiceWeaver [48]. We summarize the LoC in Table 2. To support DDB for four frameworks, we made \(\approx\)20 LoC changes to gRPC, \(\approx\)30 LoC changes to Nu, \(\approx\)60
LoC changes to Quicksand, and \(\approx\)10 LoC changes to ServiceWeaver. To facilitate the evaluation of ServiceWeaver-based applications, we ported socialnet from DeathStarBench [31] to ServiceWeaver.
The modest integration effort reflects DDB’s design philosophy: the communication framework layer is the ideal interposition point. Integrating DDB’s caller-context embedding within the framework’s payload handling path guarantees transparent cross-process stack reconstruction without heavy application-level instrumentation. This one-time, minimal integration cost (under 60 LoC per framework) instantly unlocks interactive distributed debugging for all downstream application code. We defer the discussion of more implementation-specific aspects to Appendix §11.
5.1 Limitations↩︎
Programming Language Support. Our prototype currently assumes GDB as the underlying debugger. Therefore, our prototype does not work for binaries and programming languages that GDB cannot interpret and manage.
PET. In our realization, DDB only provides PET on top of POSIX time APIs. Thus, it does not work in applications that directly use raw rdtsc or NIC hardware timestamp. However, three API semantics and two invariants ensure
our techniques are transferable to other cases.
In-flight Packets During Execution Pauses. DDB relies on the host OS’s TCP receive buffers to queue in-flight packets during a pause, avoiding complex infrastructure-level checkpointing [49]. Thanks to PET, the application processes these buffered packets upon resumption exactly as if they arrived over a congested link. Crucially, under DDB’s pause-the-world behavior, clients and upstream services are also paused, halting transmission. Thus, TCP buffers trivially absorb the in-flight traffic without exhausting capacity, provided the cluster is not exposed to unmanaged, continuous external traffic.
6 Evaluation↩︎
We evaluate DDB to answer the following key questions:
How does DDB’s integration effort compare to existing tools? (§6.1)
Does DDB improve diagnostic reliability and efficiency over existing tools? (§6.1)
Is DDB responsive enough for interactive debugging at distributed scale? (§6.2)
Does PET effectively prevent timeout cascades? (§6.3)
What is the runtime overhead of the DDB distributed control plane? (§6.4)
Setup. We evaluate DDB responsiveness on a cluster of 24 physical servers hosted on Chameleon [50]. The servers are
compute_cascadelake_r instances located at the CHI@TACC site. Each server has an Intel Xeon Gold 6240R (24 cores, 2.4GHz), 187GB RAM, and Broadcom BCM57414 NIC. We evaluate DDB’s PET effectiveness in minimizing time gaps on our local server,
which has Intel Xeon Gold 5420+ (28 cores, 2.00 GHz) and 256GB RAM. We measure the DDB metadata embedding and attachment overhead on a cluster of 12 physical servers hosted on CloudLab [51]. These servers are c6525-25g instances (16-core AMD 7302P at 3.00GHz, 128GB RAM, Mellanox ConnectX-5 NIC).
Applications. We evaluate DDB across a suite of applications. To measure responsiveness and overhead across our target research frameworks (ServiceWeaver, Nu, Quicksand), we use the socialnet
microservice benchmark as a standardized baseline. For gRPC, we evaluate a C++ Raft consensus implementation, which is representative of internal cluster communication. Finally, we isolate PET effectiveness using a synthetic application (§6.3) paired with a survey of real-world timeout thresholds.
6.1 User Study↩︎
To evaluate DDB’s ease of adoption and its impact on developer velocity, we conducted a two-part controlled user study. The study quantifies the gap between DDB and the status quo of debugging tools for distributed applications across two dimensions: the effort required to integrate the tools, and the diagnostic efficacy of DDB during real debugging tasks. Prior to the main study, we piloted our methodology by recruiting one volunteer for each study to conduct a trial-run, allowing us to refine the tasks and improve the clarity of the study materials.
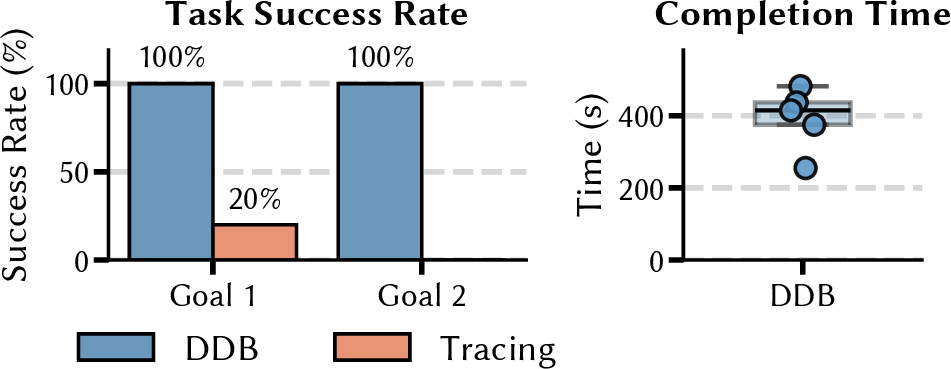
Study 1: Integration Effort. The first study evaluates the operational overhead of deploying distributed debugging capabilities. We recruited 5 participants for this study, consisting of graduate researchers from the ECE and CS departments with distributed systems experience Each participant was asked to integrate DDB and OpenTelemetry into a C++ codebase using official documentation. Each tool integration task was allocated 20 minutes. A successful integration required two goals: tracing execution backward from callee to caller with local state visible (G1), and observing a concurrent fan-out pattern (G2). DDB’s integration inherently satisfies both goals, whereas OpenTelemetry requires distinct, context-specific instrumentation for each. As shown in Figure 7, all 5 participants completed both goals with DDB(median 400 seconds), while only 1 completed G1 with OpenTelemetry and none completed G2.

Study 2: Diagnostic Efficacy. The second study evaluated diagnostic efficiency and reliability. This study employed a within-subjects (repeated measures) design to compare DDB against GDB and OpenTelemetry
(OTel). A total of 9 participants were recruited for this study; each participant was required to solve three separate bug cases, utilizing a different tool for each case. To mitigate potential order effects, learning effects, and fatigue, the presentation
sequence of the tools was partially counterbalanced using a \(3 \times 3\) Latin Square design: DDB-GDB-OTel, GDB-OTel-DDB, or OTel-DDB-GDB. Across all conditions, participants had full access to structured logging (spdlog [52]) and
a traffic-replay utility (grpcreplay [27]), so the OTel baseline effectively represents the modern status quo: using a
distributed tracer to identify the failing node, followed by iterative logging to find the root cause.
The three test cases were selected to highlight different diagnostic challenges:
A segmentation fault where an out-of-bounds memory access is non-deterministically triggered across two out of three Raft processes.
A logic error within the Raft consensus implementation, where a stale leader fails to correctly update its term after recovering from a network partition.
A distributed deadlock triggered by concurrent leader elections that paralyze cluster operations.
All three cases require reasoning across multiple Raft processes (three to five nodes) and involve timing-sensitive protocol behavior, making them representative of the cross-service faults.
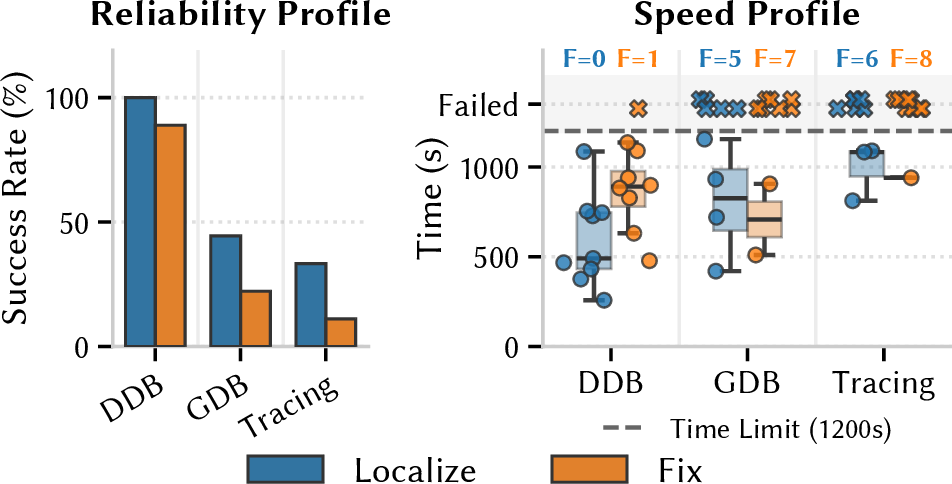
For each task, we recorded the success rate and the total time required to localize and fix the bug, capped at a 1200-second (20-minute) time limit. Figure 8 summarizes the reliability and speed profiles across all trials. DDB enabled participants to localize the root cause in 100% of trials and fix the bug in 89% within the time limit. In contrast, GDB achieved only 44% localization and 22% fix rates; OTel achieved 33% and 11%, respectively.
| Command | Scale (# pods) | Latency (ms) | ||||
|---|---|---|---|---|---|---|
| 3-7 | Count | Mean | Median | P95 | P99 | |
| dbt | 38 | 2,348 | 32.5 | 14.2 | 128.5 | 153.9 |
| 62 | 4,303 | 32.1 | 13.9 | 144.5 | 156.3 | |
| 122 | 14,573 | 26.5 | 13.3 | 110.1 | 160.1 | |
| continue | 38 | 37 | 2.2 | 2 | 3 | 4.2 |
| 62 | 8 | 2.8 | 2.7 | 3.6 | 3.6 | |
| 122 | 7 | 4.7 | 4.8 | 4.9 | 4.9 | |
For successful trials, DDB also demonstrated high efficiency. Participants using DDB attained a median localization time of approximately 500 seconds across all bug cases. The case-by-case breakdown (Figure 9) confirms this consistency: in Cases 1 and 3, baseline tools timed out for most of participants, while in Case 2, participants using baseline tools required substantially more time than those using DDB. Overall, these results indicate that DDB provides the necessary primitives to not only accelerate distributed debugging, but to make complex diagnostic tasks easier to reason about.
Qualitative analysis. Analysis of screen recordings of participant debugging procedures revealed two recurring patterns behind baseline failures. Participants assigned to OTel spent a disproportionate share of their session performing the instrumentation and switching between the trace visualizer and log collector, rather than performing diagnostic reasoning. This instrumentation and navigation overhead consumed substantial time and, in many cases, participants exceeded the time limit. GDB was effective for single-process faults but scaled poorly: participants managed three processes, but at five could no longer efficiently attach to and navigate the relevant threads. In timing-sensitive cases (Cases 2 and 3), pausing a process for inspection triggered RPC timeouts from its callers, which invalidated the cluster state and forced participants to restart the debugging session from scratch.
6.2 Responsiveness↩︎
An interactive debugger must respond to user commands and reconstruct state fast enough to maintain the developer’s train of thought at human timescales. Table 3 presents the end-to-end latency of two basic
control plane operations—executing a distributed backtrace (dbt) and continuing execution—across varying cluster sizes (38, 62, and 122 processes). Due to the space constraint, we present the full measurement of command handling latencies
in Appendix §12.
DDB exhibits stable, interactive-grade latency across all tested scales. The continue command consistently finishes under 5 ms because debug-intent distribution is heavily parallelized. Crucially, evaluating
dbt latency serves as a rigorous stress test of DDB’s responsiveness under heavy concurrent load. When execution pauses globally, the VS Code frontend automatically issues a burst of dbt commands—one
for every thread across every paused process—resulting in over 14.6 k concurrent requests at the 122-pod scale. Despite this sheer volume of requests triggering a costly, iterative stack-stitching algorithm, dbt latency remains under 200 ms
even at the tail.
| Call Depth | Latency (ms) | ||||
|---|---|---|---|---|---|
| 2-6 | Mean | Median | StdDev | P95 | P99 |
| 2 | 47.9 | 48.0 | 1.1 | 48.9 | 49.6 |
| 3 | 121.4 | 120.9 | 2.0 | 125.1 | 125.1 |
| 4 | 173.1 | 173.0 | 0.9 | 175.0 | 175.2 |
| 5 | 216.6 | 216.5 | 1.1 | 218.1 | 220.3 |
| 6 | 259.1 | 259.0 | 1.6 | 260.8 | 261.0 |
| 10 | 434.8 | 434.9 | 2.7 | 439.7 | 443.3 |
Call Depth. Because distributed backtrace is an iterative algorithm, dbt handling latency is primarily bounded by call depth. A longer call chain entails larger latency, as DDB must cross more
RPC boundaries, query more DKnot agents, and perform iterative stack restorations and frame stitching. To evaluate this impact, Table 4 isolates the end-to-end latency of a single dbt command as a
function of RPC call depth. Reconstructing the distributed stack takes a median of 48 ms at a depth of two hops, and 173 ms at a depth of four hops. A recent study [53] reports that typical call depths observed in modern cloud applications average around 3 to 4. At these depths, the sub-second dbt latency remains well within the target threshold for a fluid interactive
experience. For long call chain, we discuss a mitigation in Appendix §10.2 that harnesses parallelism for a lower latency.
| System | Case | Threshold | Aftermath | Effect Category | Severity | |
|---|---|---|---|---|---|---|
| LogCabin [54] | Heartbeat Timeout | 250 | ms | Send excessive heatbeats | low | |
| Election Timeout | 500 | ms | Disrupt established leadership | + | moderate | |
| Client Session Expiry | 3600 | s | Disconnect clients undesirably | + | severe | |
| RPC Timeout | 100 - 200 | ms \(^*\) | Send excessive RPCs | low | ||
| Lease Renewal Threshold | 900 | s | Force clients to renew the lease | moderate | ||
| Transaction Timeout | \(N \times 50\) | ms \(^\dagger\) | Abort the transaction | + + | severe | |
| Crash Recovery Trigger | 250 | ms | Initiate large-scale crash recovery | + + | severe | |
| Nu [12] | Full Shard Probing | 400 | ms | Probe full shards for freed memory | + | moderate |
| Connection Pool Timeout | 10 | s | Disconnect as considered as dead | + + | severe | |
| Service Keepalive | 10 | s | Disconnect as considered as idle | + | severe | |
| Time APIs | w/ PET(ns) | w/o PET(ns) |
|---|---|---|
| gettimeofday | 95 | 29 |
| clock_gettime(REALTIME) | 88 | 28 |
| clock_gettime(MONOTONIC) | 89 | 28 |
6.3 PET Effectiveness↩︎
To evaluate the effectiveness of the PET mechanism, we answer two questions: how much overhead does the interception layer introduce, and how effectively does it virtualize time to prevent unintended timeouts?
Overhead. We first measure the overhead of PET’s interception by invoking common POSIX time APIs one million times. Compared to direct bare-metal execution, the intercepted time APIs introduce only nanosecond-scale overhead per call as described in Table 6. Furthermore, the routine that calculates and publishes the cumulative pause offset before a process resumes execution takes 1.265 \(\mu\)s on average. These negligible overheads confirm that the PET layer does not distort the normal execution performance of the debugged application.
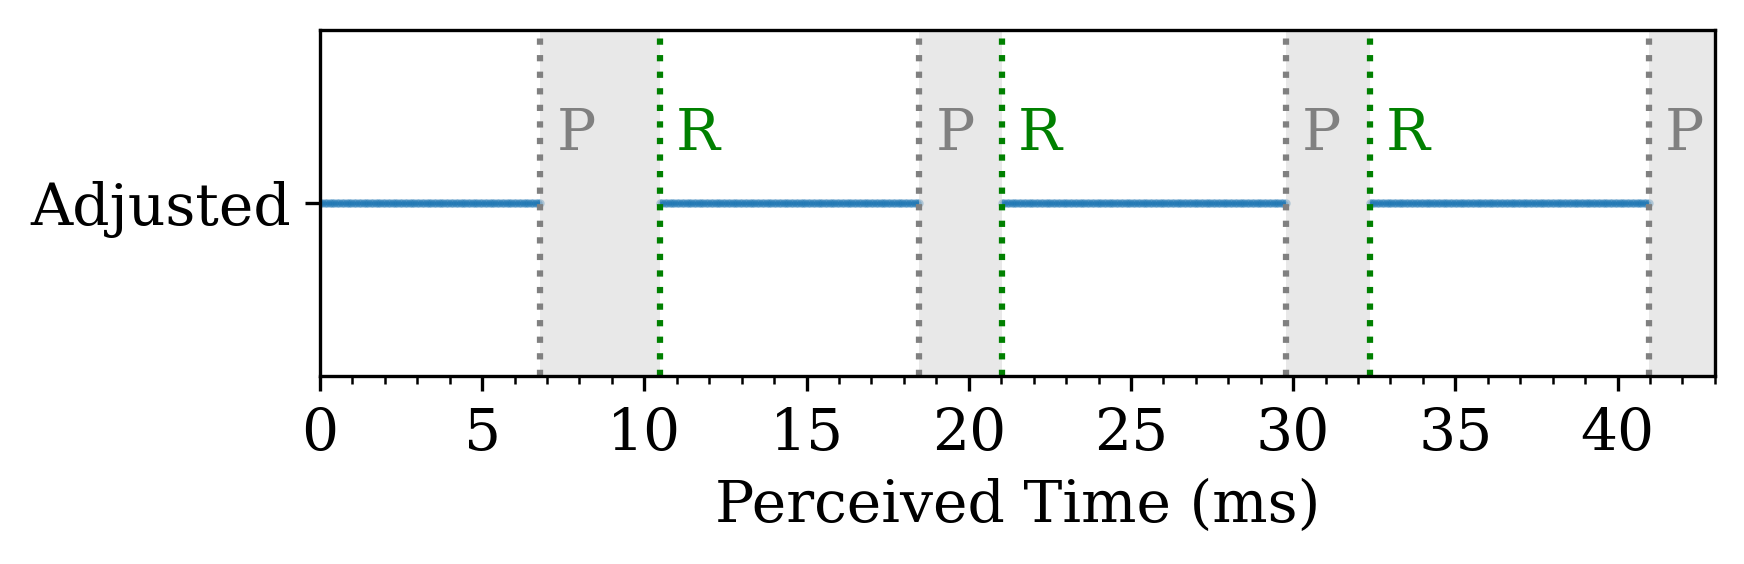
Masking Time Jumps. To evaluate the effectiveness of PET at masking time jumps, we run a synthetic application and repeatedly retrieve timestamps using POSIX time APIs when PET is applied. The synthetic application executes a tight loop with a light workload (\(\approx\) 50 \(\mu\)s) in each iteration. We attach DDB to the synthetic application with PET enabled and repeatedly inject pause and resume commands while the application is running. In this experiment, we control the time interval between pause and resume to 100 ms, which can be randomly and arbitrarily large during real-world interactive debugging. Because we tightly control the interval of each loop iteration to the microsecond scale, any noticeable time jumps at the millisecond scale are effectively captured. We present the timeline perceived by the synthetic application in Figure 10. The application consistently perceives \(\leq\) 5 ms time jumps, which is clearly smaller than the 100 ms interval. Because PET accumulates and subtracts the cumulative pause offset, we observe similar sub-5 ms results regardless of the actual duration between pause and resume.
Real-World Safety Margin. To contextualize this 5 ms maximum drift, we examined default timing thresholds in three distributed systems, LogCabin [54], RAMCloud [34], and Nu [12].
As summarized in Table 5, these systems rely on timeouts to detect and handle failures, such as LogCabin’s election timers and RAMCloud’s fast crash recovery [55]. Exceeding these thresholds triggers non-neglectable side-effects, ranging from degraded performance via excessive heartbeats to completely disrupted system states via forced leader step-downs or a massive crash recovery. Our survey indicates that the most aggressive timeout thresholds in these systems typically range from 50 ms to 250 ms. Because PET reliably bounds the perceived time jump to under 5 ms, it provides an order-of-magnitude safety envelope that isolates the application from debugger-induced timeout cascades.
6.4 DDB Runtime Overhead on Applications↩︎
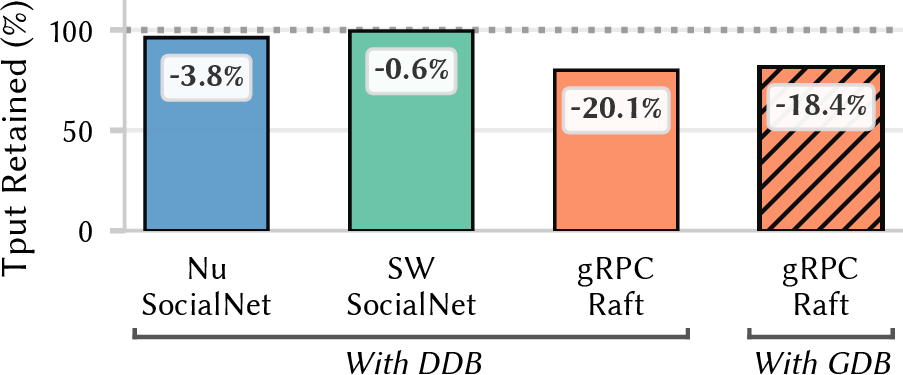
While DDB targets staging and test environments, its runtime impact must be low enough to avoid distorting application behavior. Figure 11 plots the retained throughput of the
socialnet benchmark (on both Nu and ServiceWeaver runtime) and a gRPC-based Raft consensus implementation with and without DDB attached.
DDB introduces minimal throughput degradation on socialnet. Specifically, socialnet running on ServiceWeaver and Nu exhibits a 0.6% and 3.8% throughput drop, respectively. To establish a baseline
for binary-level debugging overhead, we also compare DDB against GDB. Attaching GDB to the gRPC Raft service yields an 18.4% throughput degradation. Attaching DDB to the same gRPC Raft service
yields a 20.1% throughput degradation. This demonstrates that DDB achieves distributed debugging capabilities with overhead comparable to a traditional single-process debugger. The caller-context metadata embedding required
for dbt adds only 52 bytes to each RPC payload, resulting in an minimal impact on network utilization.
7 Related Work↩︎
Formal methods and model checking. Formal verification and model checking [56]–[58] provide strong correctness guarantees for protocol specifications but operate on mathematical models, not running code. Verification-guided tests are effective [59], [60], but they require substantial expertise. Runtime verification systems [61], [62] check specifications against live executions but do not enable interactive inspection or modification of the state that triggered a violation.
Record and Replay. Capturing and reproducing non-determinism are crucial in distributed applications [63]–[65]. Some work [26], [66] also explore the interface for replay, which is similar to a traditional symbolic debugger, e.g., GDB. Record-and-replay is orthogonal to DDB: it targets non-deterministic bugs by replaying a recorded execution, whereas DDB operates on live, real-time execution.
Distributed logging, tracing, and monitoring. These frameworks enhance the logging and reasoning experience by automatically aggregating logs [67]–[69], establishing causality between cross-service interactions and improving observability [20]–[22], [70]–[73], and enabling tracing-based aftermath-analysis to reveal erratic symptoms [74]–[77]. Monitoring tools [78], [79] can also provide high-level metrics to indicate potential issues. While these tools are well-suited at identifying which service is behaving anomalously or reconstructing the sequence of events around a failure [80], [81], they do not provide source-level interactive debugging. DDB addresses a different need: once a developer knows where a problem occurs, they need to understand why by pausing execution, navigating the cross-service call chain, and inspecting live runtime state. Unlike tracing, DDB’s metadata is not sampled and produces no persistent records; it is interrogated on demand.
HPC/Distributed debuggers. TotalView [29] and Linaro DDT [30] are interactive debuggers for HPC applications that support multi-process debugging at scale. Although they provide mechanisms for managing breakpoints across MPI processes, they are designed for HPC’s homogeneous execution model: they do not reconstruct call stacks across RPC boundaries, and they offer no protection against timeout interference from debugger pauses [82]. Both are also proprietary. Ray [5] features a built-in interactive source-level debugger [83] that provides a single-point view of distributed tasks within the Ray framework. However, Ray’s debugger does not offer distributed backtrace and still requires developers to manually cross-reference call stacks across process boundaries.
Classic distributed debugging. Early research in distributed debugging focused heavily on algorithms for consistent global snapshots [84], distributed halting [85], and determining causal ordering of asynchronous message passing [86]. However, modern cloud-native architectures have shifted the problem space. Today’s systems are characterized by deep RPC chains [73], dynamically scaling replica sets [77], and strict timeout-driven availability requirements [87]. Where classic systems focused on theoretically consistent state spaces for asynchronous events, DDB addresses practical developer workflow bottlenecks by providing an intent-preserving control plane that manages debug state across ephemeral infrastructure.
8 Conclusion↩︎
Interactive debugging enables developers to pause execution, inspect runtime state, and navigate call stacks at the source level, yet it has been widely treated as impractical for distributed systems. Call stacks stop at process boundaries, debugging state fails to survive infrastructure dynamics, and, most critically, physical debugger pauses trigger catastrophic timeout cascades. We present DDB, a distributed interactive debugger that restores this tight hypothesis-testing loop through three user-space mechanisms—Distributed Backtrace, an intent-preserving control plane, and Pause-Erased Time—without requiring kernel modifications.
In a controlled user study, DDB achieves 100% fault localization (vs.% for baseline tools) with 30 ms median backtrace latency and 1–5% throughput overhead, requiring only 20–60 lines of per-framework integration.
9 PET Mechanism↩︎
9.1 Formal Description and Invariants Correctness↩︎
We formalize the Pause-Erased Time (PET) abstraction and prove two invariants that guarantee PET induces no incorrect timing behavior. Let \(t \in \mathbb{R}_{\ge0}\) denote the continuous absolute physical time. Suppose the debugger suspends the target process multiple times during a debugging session. We represent these debugger-induced pauses as a sequence of disjoint, half-open physical time intervals \(G_k = [p_k, r_k)\). Here, \(p_k\) and \(r_k\) are the exact physical times on the \(t\) continuum when the process pauses and resumes, respectively. During each pause interval \(G_k\), the process executes no user code and makes no time API calls. To measure the duration of these pauses from within the process, we rely on the operating system’s timekeeping. Let \(T(t)\) denote the value of the kernel’s monotonic clock at any given physical time \(t\). The shim layer measures the duration of each pause \(G_k\) by recording two internal timestamps from this kernel clock \(T\). Specifically, it records \(t_{\text{stop}}^{(k)}\) immediately after all threads are stopped, and \(t_{\text{resume}}^{(k)}\) immediately before execution resumes. Because these internal timestamp reads inevitably occur sequentially within the physical pause interval \([p_k, r_k)\), their recorded values are strictly bounded by the true kernel clock values at the interval’s boundaries: \(T(p_k) \le t_{\text{stop}}^{(k)} < t_{\text{resume}}^{(k)} \le T(r_k)\). The shim layer defines the measured pause duration \(\Delta_k\) for the interval \(G_k\) as the difference between these two internal timestamps. \[\Delta_k \;=\; t_{\text{resume}}^{(k)} - t_{\text{stop}}^{(k)} \;\in\; [0,\; T(r_k) - T(p_k)].\] As the process resumes at physical time \(r_k\), the shim layer adds \(\Delta_k\) to a global cumulative offset \(O(t)\). Formally, we define \(O(t) = \sum_{k:\, r_k\le t} \Delta_k\). When the application subsequently calls a time API, the shim layer intercepts the call and returns the virtualized time \(T_v(t) = T(t) - O(t)\). This mechanism implements three time-related semantics:
get_time directly returns \(T_v(t)\).
sleep_until\((D_v)\) safely blocks the thread and returns at the earliest physical time \(t^\star\) such that \(T_v(t^\star) \ge D_v\). To
achieve this, the shim layer repeatedly arms the kernel’s blocking system call with an absolute physical deadline \(D_{\text{real}} = D_v + O(t_{\text{now}})\). Whenever the kernel wakes the thread prematurely—either due to
the offset \(O\) increasing from an intervening pause or a spurious signal—the shim layer intercepts the wakeup, recalculates \(D_{\text{real}}\), and re-arms the sleep until the virtual
condition holds.
sleep\((D)\) is syntactic sugar for sleeping until a relative duration elapses, implemented as sleep_until\((T_v(t_{\text{now}}) + D)\).
Lemma 1 (Cumulative offset property). For any physical times \(t_1 < t_2\), the change in the cumulative offset is exactly the sum of measured pause durations that concluded within that interval. Specifically, \(O(t_2) - O(t_1) = \sum_{k:\, t_1 < r_k \le t_2} \Delta_k\).
By definition, \(O(t)\) is a right-continuous step function that only increases by \(\Delta_k\) precisely at \(t = r_k\). The function otherwise remains constant during all running intervals and pauses. Therefore, the difference \(O(t_2) - O(t_1)\) perfectly isolates and sums the increments of those steps where \(r_k \in (t_1, t_2]\).
Invariant 1: Monotonicity. The Pause-Erased Time never decreases. Let two get_time calls occur at physical times \(t_1 <
t_2\), returning \(v_1 = T_v(t_1)\) and \(v_2 = T_v(t_2)\). Then \(v_2 \ge v_1\).
Because the application is entirely suspended during any pause interval \(G_k\), the observation times \(t_1\) and \(t_2\) must strictly fall within running intervals. Consequently, any pause interval \(G_k\) that intersects the window \((t_1, t_2]\) must be fully contained within it, implying \(t_1 < p_k < r_k \le t_2\). We can partition the timeframe \((t_1, t_2]\) into a collection of maximal running intervals \(\mathcal{R}\) and a collection of paused intervals \(\mathcal{P} = \{G_k \mid G_k \subseteq (t_1, t_2]\}\). The total elapsed real time measured by the kernel clock decomposes over these intervals. \[\begin{align} T(t_2) - T(t_1) &= \sum_{I \in \mathcal{R}} \bigl[T(\max I) - T(\min I)\bigr] \\ &\quad + \sum_{G_k \in \mathcal{P}} \bigl[T(r_k) - T(p_k)\bigr] \end{align}\] We expand the difference in virtual time using Lemma 1. \[\begin{align} v_2 - v_1 &= \bigl(T(t_2) - T(t_1)\bigr) - \bigl(O(t_2) - O(t_1)\bigr) \\ &= \sum_{I \in \mathcal{R}} \bigl[T(\max I) - T(\min I)\bigr] \\ &\quad + \sum_{G_k \in \mathcal{P}} \bigl[T(r_k) - T(p_k) - \Delta_k\bigr] \end{align}\] The kernel’s monotonic clock strictly non-decreases, making the first sum over the running intervals naturally non-negative. For the second sum, earlier definitions establish that the measured pause \(\Delta_k\) is bounded by the true interval duration, meaning \(\Delta_k \le T(r_k) - T(p_k)\). Because both sums are non-negative, the virtual time successfully preserves monotonicity such that \(v_2 - v_1 \ge 0\).
Invariant 2: Timer Correctness. Time-blocking operations unblock strictly when their virtual time constraints are satisfied. Specifically, a call to
sleep_until\((D_v)\) returns at the earliest physical time \(t^\star\) where \(T_v(t^\star) \ge D_v\). Consequently, a relative
sleep\((D)\) issued at physical time \(t_0\) returns at an unblocking instant \(t^\star\) that guarantees \(T_v(t^\star) - T_v(t_0) \ge D\).
When an application blocks using sleep_until\((D_v)\), the shim layer arms the underlying kernel sleep primitive with the absolute physical deadline \(D_{\text{real}} = D_v +
O(t_{\text{now}})\). The shim layer subsequently intercepts every wakeup. It unconditionally returns control to the application only when the virtual time satisfies \(T_v(t) \ge D_v\). We must guarantee that the
armed physical deadline \(D_{\text{real}}\) mathematically expires no later than the true physical time when the virtual condition is satisfied. Suppose at some subsequent physical time \(t_{\text{target}}\), the virtual time reaches the deadline such that \(T_v(t_{\text{target}}) \ge D_v\). By definition, this implies \(T(t_{\text{target}}) -
O(t_{\text{target}}) \ge D_v\), which rearranges algebraically to \(T(t_{\text{target}}) \ge D_v + O(t_{\text{target}})\). Because the cumulative offset never decreases, we have \(O(t_{\text{target}}) \ge O(t_{\text{now}})\). Therefore, we are mathematically guaranteed that \(T(t_{\text{target}}) \ge D_v + O(t_{\text{now}}) = D_{\text{real}}\). This inequality is
essential: it proves that the initially armed kernel deadline \(D_{\text{real}}\) will inevitably expire at or strictly prior to any physical time where the virtual deadline is satisfied. If no intervening pauses occur, the
offset remains unchanged and the kernel wakes the thread exactly when the valid condition \(T_v(t) \ge D_v\) is met. However, if an intervening pause occurs, the offset increases, causing \(D_{\text{real}}\) to expire prematurely while the actual virtual time \(T_v(t)\) remains strictly less than \(D_v\). The shim layer automatically traps this
premature wakeup, recalculates a pushed-back \(D_{\text{real}}\) using the updated offset, and re-arms the sleep. By repeatedly filtering out these premature wakeups through persistent recalculation, the shim layer
guarantees that the application ultimately unblocks precisely at the earliest observable physical instant satisfying the virtual deadline.
For a relative sleep\((D)\), the implementation uniformly maps the request to an absolute wait using sleep_until\((D_v)\), where the deadline is initialized to
\(D_v = T_v(t_0) + D\). By the preceding logic, the unblocking instant \(t^\star\) guarantees \(T_v(t^\star) \ge D_v\). Substituting \(D_v\), we logically conclude that \(T_v(t^\star) - T_v(t_0) \ge D\). This analytically validates that relative sleep durations are strictly preserved across arbitrary debugger pauses.
Guarantees and Scope. The proof of these two invariants substantiates the mathematical soundness of the pause-erased time semantics. Because arbitrarily complex timeout and rate-limiting schemes ultimately decompose into these elemental time-reads and blocking sleeps, the shim layer averts any artificial failure cascades induced by debugger pauses. System decisions evaluated against PET, such as lease expiration and election deadlines, remain observationally equivalent to an unpaused execution state. This temporal equivalence holds completely up to a minimal under-measurement slack, formally defined in §9.2 and empirically verified in §[sec:time-jump]. The PET abstraction specifically governs local time reads and localized timeout evaluations, making no attempts to artificially synchronize or warp clocks across divergent system processes.
9.2 PET Under-measurement Slack↩︎
The Pause-Erased Time mechanism cannot entirely eliminate the physical duration of execution pauses due to unavoidable implementation latencies across the suspension and resumption pathways. Recall from the definitions above that for any debugger-induced pause \(G_k = [p_k, r_k)\), the true physical time elapsed during the suspension is exactly the kernel clock difference \(\Delta^{\text{true}}_k = T(r_k) - T(p_k)\). To ensure the system never over-estimates the pause duration—which would dangerously cause virtual time to flow backwards—the measurement is taken strictly from within the interval boundaries. Specifically, the internal timestamps \(t_{\text{stop}}^{(k)}\) and \(t_{\text{resume}}^{(k)}\) are captured exclusively after all debuggee threads are safely paused and exclusively before they are allowed to resume user-space execution.
Because coordinating thread suspension across a process involves asynchronous signals and OS scheduler delays, there exists a strictly non-negative latency at both boundaries. The measured pause duration \(\Delta_k = t_{\text{resume}}^{(k)} - t_{\text{stop}}^{(k)}\) is therefore strictly less than or equal to the true pause duration.
Remark 1 (Under-measurement slack). Let \(\eta_k\) denote the under-measurement slack for a pause interval \(G_k\), defined mathematically as the unmeasured residual duration: \[\eta_k \;\stackrel{\mathrm{def}}{=}\; \bigl(T(r_k) - T(p_k)\bigr) \;-\; \Delta_k \;\ge\; 0.\] Let \(T^{\text{ideal}}_v(t)\) formally represent a hypothetically perfect virtual time that completely erases the true physical duration of every pause without any latency: \[T^{\text{ideal}}_v(t) \;\stackrel{\mathrm{def}}{=}\; T(t) \;-\; \sum_{k:\,r_k\le t}\bigl(T(r_k) - T(p_k)\bigr).\] For any physical time \(t\), the actual virtual time \(T_v(t)\) governed by PET algebraically relates to the theoretically ideal virtual time as follows: \[T_v(t) \;=\; T^{\text{ideal}}_v(t) \;+\; \sum_{k:\,r_k\le t} \eta_k.\] This mathematically demonstrates that the actual virtual time \(T_v\) perpetually remains (weakly) ahead of the ideal debug time by exactly the global cumulative slack \(\sum\eta_k\). Furthermore, if the OS-level pause and resume measurement latencies are empirically bounded by maximum delays \(\sigma_{\text{pause}}\) and \(\sigma_{\text{resume}}\), the per-pause slack is strictly bounded by \(\eta_k \le \sigma_{\text{pause}} + \sigma_{\text{resume}}\).
9.3 Wall Clock as the Clock-Source↩︎
For APIs that use the REALTIME (wall clock) as the clock-source, Invariant 1 (Monotonicity) inherently does not apply, as NTP synchronization can abruptly step the physical wall clock backwards or forwards. Crucially, this is a fundamental
property of the OS wall clock, and handling such organic time jumps is strictly an application-level responsibility. PET’s formal correctness therefore remains inviolate: Invariant 2 (Timer Correctness) holds completely. The shim layer guarantees that the
virtualized wall clock yields an observationally equivalent unpaused execution, faithfully preserving all natural slews and steps of the physical wall clock while seamlessly omitting the debugger pauses.
We reuse the established mathematical notation from the preceding proofs: continuous absolute physical time \(t\), the measured cumulative pause offset \(O(t) = \sum_{r_k\le t}\Delta_k\), and the debugger pause intervals \(G_k = [p_k, r_k)\). Let \(R(t)\) denote the value of the kernel’s wall clock at any given physical time \(t\). We define the virtualized wall clock value returned to the application as: \[R_v(t) \;\stackrel{\text{def}}{=}\; R(t) \;-\; O(t).\]
Here, \(R_v(t)\) acts as the true wall clock \(R(t)\) observed on a pristine timeline where all recorded debugger pauses are seamlessly subtracted. For any two physical time reads \(t_1 < t_2\) (occurring outside of an execution pause), we observe: \[\begin{align} R_v(t_2) - R_v(t_1) &= \bigl[R(t_2) - R(t_1)\bigr] \;-\; \bigl[O(t_2) - O(t_1)\bigr] \\ &= \bigl[R(t_2) - R(t_1)\bigr] \;-\; \sum_{t_1 < r_k \le t_2} \Delta_k. \end{align}\] This algebraically proves that \(R_v\) preserves the exact slews and discrete jumps of the underlying physical wall clock \(R(t)\), omitting only the measured duration of any debugger-induced pause intervals.
REALTIME API Semantics. The shim layer maps the wall clock time APIs as follows:
get_time_realtime directly returns \(R_v(t)\).
sleep_until_realtime\((D_v)\) safely blocks the thread by arming a REALTIME absolute physical deadline \(D_{\text{real}}^{\mathrm{RT}} = D_v +
O(t_{\text{now}})\). Whenever the kernel wakes the thread prematurely—due to the offset \(O\) increasing from a pause, a spurious signal, or an NTP-induced backward clock step—the shim layer recalculates \(D_{\text{real}}^{\mathrm{RT}}\) and re-arms the sleep until the virtual condition \(R_v(t) \ge D_v\) properly holds.
sleep_realtime\((D)\) mathematically reduces into sleep_until_realtime\((R_v(t_{\text{now}}) + D)\).
Invariant 2: Timer Correctness for REALTIME. Time-blocking operations dependent on the wall clock unblock strictly when their virtual wall time constraints are satisfied. Specifically, a call to
sleep_until_realtime\((D_v)\) returns at an unblocking physical instant \(t^\star\) where \(R_v(t^\star) \ge D_v\). Consequently, a relative
sleep_realtime\((D)\) issued at physical time \(t_0\) returns at an instant \(t^\star\) guaranteeing \(R_v(t^\star) -
R_v(t_0) \ge D\).
By construction, the shim layer yields control back to the application only when it verifies \(R_v(t^\star) \ge D_v\), which occurs strictly when the underlying kernel reports \(R(t^\star) \ge
D_{\text{real}}^{\mathrm{RT}}\) using the most recently calculated deadline \(D_{\text{real}}^{\mathrm{RT}} = D_v + O(t^\star)\). If the physical wall clock \(R(t)\) steps backwards
due to NTP synchronization, the virtual wall clock \(R_v(t)\) accurately reflects this backward jump. Because the shim unconditionally intercepts every kernel wakeup and strictly re-evaluates the mathematical inequality
\(R_v(t) \ge D_v\), backward steps of \(R(t)\) inherently prolong the suspension exactly as they would in an un-debugged, pristine execution. The persistent re-arming loop logically masks
both debugger pauses (which abruptly increase \(O(t)\)) and spurious interrupts, mathematically guaranteeing the earliest legitimate release time. Similarly, because sleep_realtime\((D)\) algebraically expands to an absolute deadline \(D_v = R_v(t_0) + D\), the release at \(t^\star\) rigorously enforces \(R_v(t^\star) \ge R_v(t_0) + D\), preserving relative wall clock durations despite temporal discontinuities.
9.4 vDSO Handling↩︎
Linux’s vDSO (virtual Dynamic Shared Object) is a kernel-provided shared library mapped directly into a process’s user-space memory, exposing critical kernel services without the overhead of a system call context switch. Most modern libc
implementations optimize time-reading APIs (e.g.,gettimeofday and clock_gettime) by internally routing them through the vDSO.
Our implementation seamlessly supports these vDSO optimizations without undermining their performance benefits. The shim layer interposes itself strictly between the user application and the underlying libc. When an application invokes a
time API, the symbol is intercepted by the shim. The shim then queries the actual libc function—which successfully leverages the vDSO—to retrieve the true physical time, and subsequently applies the mathematical offset adjustments.
Consequently, our design mechanically inherits the zero-syscall performance advantages of vDSO while rigorously enforcing the Pause-Erased Time abstraction.
We inherently acknowledge a structural limitation: if an application deliberately bypasses libc to manually resolve and invoke function pointers directly from the vDSO memory mapping (or uses raw syscall assembly), our
LD_PRELOAD shim cannot intercept the observation. While such raw-level resolution is exceptionally rare in conventional application code, completely bypassing libc technically breaks the shim’s localized enforcement scope.
However, because we have formally decoupled the PET semantics into rigorous mathematical invariants rather than relying on an implementation quirk, the exact same abstraction logic can be cleanly transplanted into deeper, more privileged interception
frameworks (e.g., eBPF or hypervisor trapping) to support these extreme edge-cases if strictly required.
10 Distributed Backtrace↩︎
10.1 Distributed Stack Stitching↩︎
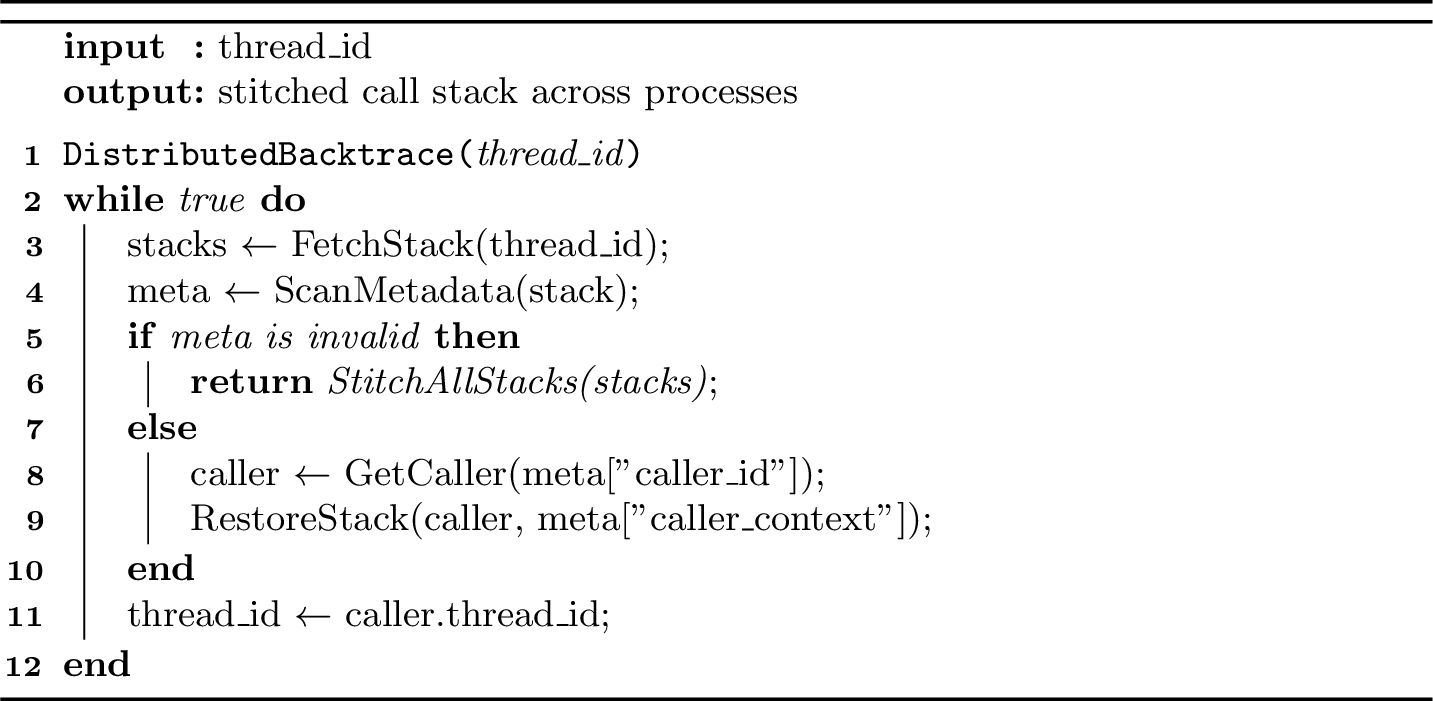
As described in Figure 12, DDB reconstructs the global call graph by iteratively tracing the causal chain backward across network boundaries. Specifically, DDB:
fetches the local call stack of the targeted thread and appends it to the stitched array;
unwinds the stack to locate the injected RPC frame and parses the embedded causal metadata;
terminates the local trace if no valid metadata is found, concluding that the root of the call chain has been reached;
utilizes the extracted metadata to identify the upstream caller process (which may reside on a remote node) and restores the caller’s exact register-level execution context;
transitions the backtrace focus to the restored upstream thread and recursively repeats the entire trace process until the origin is fully resolved.
10.2 Stack Stitching Latency at Scale↩︎
Because the distributed backtrace algorithm recursively sweeps the call stack backwards across RPC boundaries, its time complexity is inherently linear with respect to the depth of the distributed call chain. Consequently, resolving full traces for deeply nested call chains incurs proportional end-to-end cross-RPC latency. A viable optimization to mitigate this sequential bottleneck is to configure the instrumentation to propagate \(N\) consecutive ancestor metadata records within each RPC packet, rather than strictly maintaining just the immediate parent. This enables DDB to immediately exploit network parallelism by dispatching concurrent stitching queries to multiple ancestor nodes in the chain, effectively masking the sequential round-trip delays. Naturally, this latency-hiding optimization inherently trades off against a modest increase in the baseline RPC payload size during routine application execution.
11 Implementation Details↩︎
Framework Integration. Integrating DDB into existing distributed frameworks requires minimal engineering effort. For high-level orchestrators like Nu, Quicksand, and ServiceWeaver, DDB’s instrumentation is embedded entirely within the framework’s underlying runtime, achieving complete transparency for end-user application code. For standard RPC libraries like gRPC, minor boilerplate adjustments during service initialization are sufficient to propagate discovery metadata.
Metadata Extraction Barrier. During an RPC invocation, DDB injects causal metadata into a local stack variable to mark the network boundary. Because this variable is exclusively read asynchronously by an
external debugger process at runtime, aggressive optimizing compilers naturally assume the assignment to be dead code and eagerly elide it during compilation. To circumvent this, we insert a specialized volatile inline assembly directive that
acts as a strict structural optimization barrier. This artificially forces the compiler to materialize and preserve the metadata securely on the physical stack.
Wait-for-Attach. To permit deterministic debugging of early startup routines, DDB provides a wait-for-attach mechanism. When enabled via the DConnector module, the application explicitly
blocks its initialization path and waits for an external attachment signal. We repurpose the POSIX real-time signal SIGRTMIN+6 (SIG40) as a dedicated wakeup trap. Upon successfully establishing the debugging session, the central
control plane instructs the local DKnot daemon to cleanly inject SIG40 into the debuggee, synchronously unleashing its execution.
Multi-ABI Stack Restoration. Properly stitching causal call stacks dynamically requires rewriting explicit thread hardware registers, strictly governed by the target’s Application Binary Interface (ABI). For Go on x86_64,
overwriting the stack pointer (RSP) and instruction pointer (RIP) is natively sufficient. In contrast, for C++, the C ABI mandates additionally restoring the frame base pointer (RBP). Architectural boundaries present
similar strict register requirements; ARM64 (aarch64) deployments intrinsically require precise restoration of the Link Register (lr) alongside sp and pc to guarantee that subsequent unwinding operations
successfully chain the call stack.
Auxiliary Thread for Expression Evaluation. To inspect complex application states, developers routinely evaluate in-guest functions. Dynamically executing arbitrary application logic inherently necessitates harnessing a live thread
context. To strictly prevent execution side effects or accidental state corruption within the primary application execution, we spawn an isolated, no-op auxiliary thread within each debuggee process dedicated exclusively to expression evaluation. During
interactive evaluations, DKnot surgically resumes only this distinct auxiliary thread while forcing all primary application threads to remain safely frozen.
Debugger with Kubernetes. Modern production container images are typically aggressively minimized (distroless) to reduce attack surfaces, making it fundamentally impractical to bundle massive debugger binaries natively alongside microservices. For our ServiceWeaver evaluation over Kubernetes, DDB adheres to deployment best practices by injecting its localized debugger agents dynamically into targeted, running pods using Kubernetes Ephemeral Containers [88]. Because Kubernetes overlay networks are rigidly isolated internally, we deploy a designated gateway container to act as a secure ingress trampoline. This gateway exposes a singular multiplexed port securely to the DDB control plane, efficiently bridging remote SSH tunnels directly into the ephemeral debugging environments cleanly attached to the target microservices.
12 Extended Measurement of Command Handling Latencies↩︎
| Command | Latency at the Scale of 38 Processes (ms) | ||||
|---|---|---|---|---|---|
| 2-6 | Count | Mean | Median | P95 | P99 |
| dbt | 2,348 | 32.5 | 14.2 | 128.5 | 153.9 |
| continue | 37 | 2.2 | 2.0 | 3.0 | 4.2 |
| break-delete | 1 | 1.8 | 1.8 | 1.8 | 1.8 |
| break-insert | 1 | 64.4 | 64.4 | 64.4 | 64.4 |
| exec-interrupt | 4 | 8.1 | 7.3 | 7.8 | 7.8 |
| stack-list-variables | 66 | 3.1 | 2.6 | 4.6 | 12.8 |
| var-create | 146 | 24.4 | 7.4 | 48.5 | 51.2 |
| var-list-children | 3 | 3.0 | 3.0 | 3.0 | 3.0 |
| var-update | 11 | 19.2 | 4.6 | 47.6 | 47.6 |
| Command | Latency at the Scale of 62 Processes (ms) | ||||
|---|---|---|---|---|---|
| 2-6 | Count | Mean | Median | P95 | P99 |
| dbt | 4,303 | 32.1 | 13.9 | 144.5 | 156.3 |
| continue | 8 | 2.8 | 2.7 | 3.6 | 3.6 |
| break-delete | 1 | 6.9 | 6.9 | 6.9 | 6.9 |
| break-insert | 2 | 46.9 | 46.9 | 8.5 | 8.5 |
| exec-interrupt | 4 | 15.4 | 16.1 | 17.3 | 17.3 |
| stack-list-variables | 28 | 6.1 | 3.8 | 12.9 | 30.3 |
| var-create | 78 | 24.6 | 16.3 | 49.6 | 50.1 |
| var-list-children | 3 | 5.6 | 3.8 | 3.8 | 3.8 |
| Command | Latency at the Scale of 122 Processes (ms) | ||||
|---|---|---|---|---|---|
| 2-6 | Count | Mean | Median | P95 | P99 |
| dbt | 14,573 | 26.5 | 13.3 | 110.1 | 160.1 |
| continue | 7 | 4.7 | 4.8 | 4.9 | 4.9 |
| break-insert | 1 | 81.1 | 81.1 | 81.1 | 81.1 |
| exec-interrupt | 6 | 26.1 | 25.6 | 29.0 | 29.0 |
| stack-list-variables | 19 | 7.6 | 4.4 | 15.7 | 15.7 |
| var-create | 43 | 24.4 | 18.8 | 49.8 | 69.9 |
To complement the primary evaluation, we present the exhaustive measurements of DDB’s command handling latencies across varying deployment scales (ServiceWeaver’s socialnet app). Specifically,
Table ¿tbl:table:full-cmd-lat-38?, Table [table:full-cmd-lat-62], and Table [table:full-cmd-lat-122] detail the granular end-to-end response times measured under settings of 38, 62, and 122 concurrent microservice instances.
As illustrated in the results, state-inspection commands are automatically emitted in bulk by the IDE frontend (e.g., VSCode) to dynamically instantiate and fetch local variable scopes for UI rendering. Examples include
stack-list-variables, var-create, var-list-children, and var-update. Conversely, the exec-interrupt command operates as an asynchronous control signal, issued exclusively when a developer
manually asserts a global pause sequence via the debugger control panel.
13 Migration Continuity (Nu and Quicksand)↩︎
DDB’s design guarantees extensibility to dynamic microsecond-scale environments like Nu [12] and Quicksand [11]. Specifically, DDB seamlessly preserves two absolute forms of debugging continuity:
when a computation migrates, all established breakpoint intents automatically follow the execution context; and
when heap state migrates, the distributed backtrace mathematically reconstructs the global call graph with all caller-visible local variables fully intact.
Architectural Assumptions. To orchestrate heap continuity, DDB leverages two core architectural properties natively provided by these advanced execution frameworks:
Symmetric Address-Space Layouts. The underlying frameworks deploy an identical, universally linked binary across all cluster nodes with Address Space Layout Randomization (ASLR) strictly disabled. Consequently, virtual memory addresses and object layouts are guaranteed identical cluster-wide. This implies that DDB’s inspection-time restoration can safely map distributed objects directly to the same virtual addresses without requiring complex pointer swizzling or relocation maps.
Logical Heap Locator API. The frameworks expose a queryable API that, given a stable logical context identifier, returns the specific remote host and process currently owning a migrating heap region. DDB invokes this locator exclusively on-demand during a distributed backtrace.
Breakpoints Follow Computations. Environments like Nu and Quicksand enforce that any specific logical computation unit is actively resident on exactly one host at any given physical time. DDB fundamentally
decouples breakpoints from physical memory addresses, instead expressing them as logical intents broadcasted globally to all attached DKnot daemons. As the orchestrator spawns new processes to handle migrating workloads, DDB’s service discovery immediately captures them to seamlessly inherit the global breakpoint configurations. Consequently, whichever physical process currently hosts the migrating computation instantly reports the hit, and DDB simply focuses the debugger on that localized entrypoint.
Reconstructing Stack Frames Post-Migration. Because Nu and Quicksand structurally pin the originating sender thread on its native process while its outbound RPC remains outstanding, the fundamental stack frames remain completely sound even if surrounding threads or active heaps dynamically relocate. However, to robustly reveal active on-heap objects navigating from a caller frame whose heap has already migrated, DDB executes a rigid sequence of on-demand heap restorations during each specific traceback hop:
Presence Verification. For every reconstructed caller frame, DDB queries the local runtime to verify whether the caller’s target heap remains physically present in the local address space.
Surgical Heap Restoration. If the heap is absent, DDB queries the framework’s locator API to pinpoint the current physical owner. It then coordinates a targeted remote dump of the latest synchronized heap state. DDB physically writes these bytes into the reconstructed caller’s address space at the exact same virtual addresses, instantly rendering all pointers and local variables valid for live IDE inspection.
Ephemeral Cleanup. Upon intercepting a
continuecommand, DDB aggressively scrubs any temporary restorations. The process memory state rigidly reverts to its pristine original configuration before execution resumes.