DebugTracker: Lightweight Process Evidence for Classroom Debugging
July 07, 2026
Abstract
Debugging exercises are often assessed from final code and test outcomes, yet these artifacts hide how students reproduced failures, formed hypotheses, inspected evidence, edited code, and verified fixes. We present DebugTracker, a Visual Studio Code extension that records lightweight debugging-process evidence for classroom tasks. DebugTracker separates uncoached Evaluation Mode traces from coached Training Mode traces, stores append-only JSONL events, and exports timeline and Markdown reports for human review. The prototype records test commands, editor and debugger metadata, student checkpoints, source snapshots, optional image evidence, human labels, and optional AI-assisted practice feedback. DebugTracker is largely language-agnostic: it captures process evidence through standard VS Code mechanisms rather than language-specific tooling, although debugger evidence depends on the relevant VS Code language extension. We validate the prototype with debugging tasks in Python, TypeScript, and Java, 16 automated checks, and an 11-case manual trial matrix spanning packaged VSIX installation and three operating systems.
<ccs2012> <concept> <concept_id>10011007.10011006.10011041</concept_id> <concept_desc>Software and its engineering Software testing and debugging</concept_desc> <concept_significance>500</concept_significance> </concept> <concept> <concept_id>10003456.10003457.10003527.10003531</concept_id> <concept_desc>Social and professional topics Software engineering education</concept_desc> <concept_significance>300</concept_significance> </concept> </ccs2012>
1 Introduction↩︎
Debugging is a process of observing failures, asking questions, inspecting state, testing hypotheses, and validating repairs [1], [2]. It is also one of the hardest skills for students to learn because the reasoning that separates a systematic investigation from lucky guessing happens between the failing test and the final patch. Classroom assessment, however, commonly sees only that final patch, the final test result, or a short written note. The intermediate steps—reproducing the failure, narrowing it to a suspect location, forming a hypothesis, and checking that the repair fixes the observed symptom—leave no durable record once the session ends.
This creates a process-visibility gap in assessment. Viewed from the student’s side, a debugging exercise unfolds as the rich, multi-step process just described. Viewed from the instructor’s or examiner’s side, however, the available artifact is often only the submitted code plus a pass/fail test result. Consider two students who both submit a passing solution: one may have followed an evidence-based debugging process, while the other may have edited and tested repeatedly until the suite turned green. The final code can look identical even when the underlying debugging competence differs. When the goal of the exercise is to teach a process, feedback that ignores the process misses what the exercise was meant to assess.
Richer alternatives exist but fit the classroom poorly. Screen recording and live observation capture the process faithfully, yet they do not scale to large cohorts, are intrusive, and collect far more data—faces, unrelated windows, keystrokes—than a review task requires. Commit history is too coarse and is easily rewritten, so it rarely reflects the moment-to-moment investigation. Automated debugging and fault-localization tools target the act of finding bugs, not the assessment of how a learner did so, and prior work cautions that such automation does not straightforwardly help programmers in practice [3]. Classroom assessment therefore needs a lightweight, structured record of the debugging process: one that is cheap to produce, cheap to read, and bounded to the task at hand.
DebugTracker targets this gap with a task-scoped IDE tool. Its goal is not to replace debuggers, automated fault localization, or interactive explanation systems such as the Whyline [4]; nor does it claim that automated debugging alone can assess student practice. Instead, it makes the evidence surrounding ordinary tests, breakpoints, edits, checkpoints, and verification inspectable after a session ends, so an instructor can review the debugging narrative rather than only its outcome.
DebugTracker is designed for three users: students who need a lightweight way to record their debugging narrative, instructors and teaching assistants who need reviewable evidence, and researchers who need structured traces without full screen capture. The paper contributes (1) a VS Code extension implementing this workflow, (2) a privacy-conscious event and report model for debugging-process evidence, and (3) a validation package with cross-language sample tasks, automated tests, a demo script, and a packaged VSIX build. A demonstration video is available at https://youtu.be/-hzR-Whu2s4.
2 DebugTracker↩︎
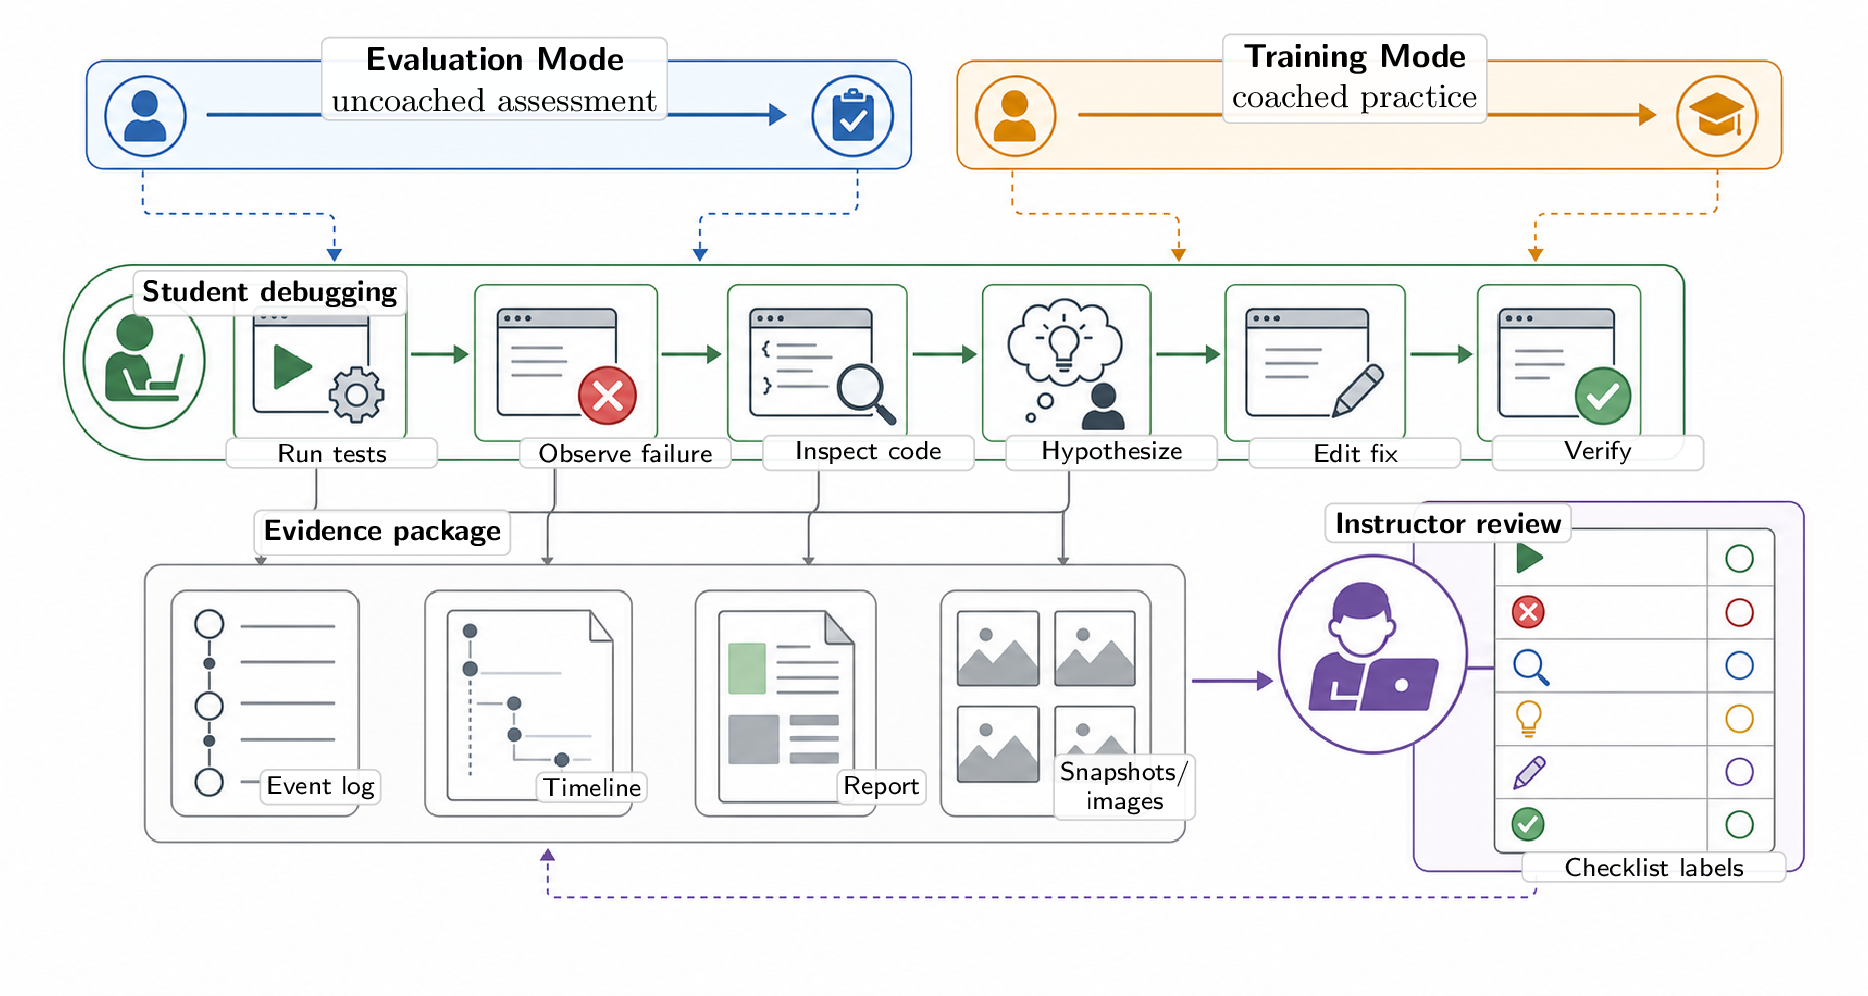
1 summarizes the workflow that DebugTracker makes visible. The first choice is the session mode: Evaluation Mode produces an uncoached assessment trace, whereas Training Mode records coached practice. Within either mode the student carries out the same ordinary debugging routine inside VS Code—the path shown across the middle of 1, from running tests to verifying the fix (we walk a concrete instance in 3). From the instructor’s perspective, those same actions become a structured evidence package: an event log, timeline, report, snapshots or images, and optional human labels.
The command surface is deliberately small: start an Evaluation session, start a Training session, add a checkpoint—a timestamped failure observation, hypothesis, or verification note—and finish. The two modes differ only in coaching. Evaluation Mode is uncoached: it disables process prompts, solution hints, and after-session feedback, and marks its reports as assessment traces. Training Mode is coached: it prompts the student through the debugging process—for example, reminding them to reproduce the failure, record a hypothesis before editing, and verify the fix afterward—and can add optional, OpenAI-compatible feedback on how the student is debugging. This coaching deliberately targets the process, not the answer: it never reveals the fix or patches the code for the student. The explicit mode boundary keeps these coached practice traces separate from assessment evidence.
At finish time, DebugTracker exports a Markdown report and a timeline that together summarize the session: its mode and privacy boundary, the detected tests and failures, the student’s hypotheses and edits, and the post-edit verification. Instructors can add human labels afterward, and those labels are stored as separate events rather than overwriting the raw trace.
3 Demonstration↩︎
This section describes the live demonstration: a single scripted debugging session that an audience can follow end to end, and the assessment evidence it leaves behind.
The demonstration centers on the included Python checkout-pricing task; TypeScript and Java variants are also available. The task starts from a failing test whose bug is small enough to fix on stage but still demands a genuine debugging chain: the shipping-eligibility check uses the original subtotal instead of the discounted taxable subtotal, so a discounted order is incorrectly granted free shipping.
1 lists the script and, for each step, the assessment question that the step’s recorded evidence lets an instructor answer. The presenter installs the VSIX (or launches the extension from source), opens the sample task,
selects the Evaluation branch of 1, and runs python -m unittest. Once the failing test appears, the presenter follows the student path from the figure: record the observed failure, inspect
src/pricing.py, state the hypothesis that the free-shipping threshold uses the wrong subtotal, edit the shipping-basis assignment, rerun the test, and record verification. A final step opens the timeline and Markdown report; 2 shows an excerpt, including the underlying JSONL events whose schema is defined in 4.
The payoff is the trace, not the fix. Reading only the final patch, the two students contrasted in the introduction are indistinguishable; reading the exported trace, an instructor can answer every question in the last column of 1—whether the failure was reproduced, whether the suspect code was inspected, whether the hypothesis preceded the edit, whether the edit was targeted, whether verification followed it, and whether any coaching was involved—without having watched the session.
| Demo step | Captured evidence | Instructor check |
|---|---|---|
| Start session | Mode, purpose, privacy boundary, and session id. | Coaching used? |
| Run failing test | Test command and failure context. | Failure reproduced? |
| Inspect code | Editor navigation and debugger activity. | Suspect code inspected? |
| Record hypothesis | Pre-edit failure note and hypothesis. | Hypothesis before edit? |
| Edit fix | Source snapshot and edit metadata. | Targeted repair? |
| Verify and export | Passing test event, timeline, report, and optional labels. | Verification after edit? |
4pt
None
Figure 2: Exported Markdown report excerpt and syntax-highlighted JSONL event excerpts from the Python checkout-pricing evaluation task..
The same artifacts support a lightweight classroom workflow beyond the stage. An instructor publishes a debugging task with its source, tests, and any custom test-command patterns; students open it in VS Code, run an Evaluation session, debug normally, and submit the exported report and trace alongside their final solution. An instructor or teaching assistant then reviews the process evidence directly, without screen recordings or commit-history archaeology. Because the questions in 1 map onto common debugging rubrics, they can attach rubric labels through the human-label mechanism; these are stored as later events, leaving the student’s original trace intact.
4 Design and Implementation↩︎
DebugTracker is implemented in TypeScript as a VS Code extension targeting VS Code 1.88 or newer, using the VS Code extension API [5]. It contributes a DebugTracker activity-bar container, a session dashboard, a timeline tree/webview, command-palette actions, and workspace settings for capture and storage policy. All primary artifacts are workspace-local: JSONL session logs, Markdown reports, source snapshots, and optional image attachments.
The event schema in src/eventTypes.ts records a session id, timestamp, mode, source, event type, optional file location, a short summary, and a structured payload. 2 shows the implemented fields and event
families. The log is append-only, so raw behavior, human labels, and AI feedback remain distinguishable during review.
| Schema item | Implemented values or purpose |
|---|---|
| Required fields | id, timestamp, sessionId, type, source, mode, summary, payload. |
| Optional location | filePath, line, and column when an event is tied to source code. |
| Modes | evaluation and training. |
| Sources | session, editor, debugger, terminal, test, student, human, ai. |
| Event families | Session start/stop, file open/edit, debugger lifecycle (start, stop, step, breakpoint, continue), terminal commands, test runs, source snapshots, failure evidence, image evidence, student checkpoint/hypothesis/note, verification, human labels, AI analysis, and AI coaching. |
| Payload | Source-specific structured metadata, such as command lines, checkpoint text, snapshot paths, image attachment paths, and label details. |
Internally, capture is organized as a thin set of listeners over existing VS Code events feeding a single append-only writer. When a session starts, the extension subscribes to editor, debugger, and terminal events, normalizes each one into the schema of 2, and appends it to the session’s JSONL log; the timeline tree/webview and the Markdown report are derived views over that same log rather than independent stores. Test runs are detected from shell-integrated terminal commands against built-in and instructor-configured patterns, debugger activity is observed through the Debug Adapter Protocol, and student checkpoints and human labels enter through explicit command-palette actions. Because every artifact is reconstructed from the ordered event stream, the trace remains the single source of truth: re-rendering a report or timeline never mutates the underlying evidence, and a later instructor sees the same raw sequence the student produced.
DebugTracker is language-agnostic by design. Because it captures evidence through these standard VS Code mechanisms rather than a language-specific toolchain, the same event model applies across languages. Built-in patterns recognize common JavaScript,
Python, Java, and C/C++ test commands when shell integration is available, and instructors can extend coverage through the debugTracker.testCommandPatterns setting. The languages used in this paper are therefore a validation set, not a
constraint on the tool.
DebugTracker treats privacy as a capture-policy problem: it records task-relevant metadata rather than a full interaction replay. By default, it does not store complete terminal output, screen video, mouse movement, or per-keystroke history. For instructor-authored tasks, it saves baseline and final source snapshots so instructors can compare the starting bug with the submitted fix.
Reports also separate captured evidence from instructor-only interpretation. Student-facing reports describe what was captured and, in Training Mode, provide practice feedback. Instructor actions come later and never overwrite the trace: human labels are appended as separate events, and instructor-side reports are derived from the log. This keeps the student’s raw assessment trace distinct from the instructor’s interpretation of it.
5 Implementation Validation↩︎
This section reports engineering evidence that the implemented workflow installs, runs, and produces the expected evidence across configurations. It validates the artifact rather than the pedagogy: it shows that DebugTracker reliably does what describe, not that the resulting evidence improves grading. We return to that distinction at the end of the section.
The automated test entry point dist/test/runTests.js runs 16 checks that exercise the mechanisms behind those claims: session identifiers, terminal test-command detection, mode policy, report generation, AI-coach prompt construction, image
evidence, source-snapshot reporting, timeline rendering, session-summary rendering, human-label entry, and Training Mode feedback. All 16 pass in the current workspace.
A manual practice matrix of 11 documented cases covers what unit tests cannot: packaged VSIX installation; Windows, macOS, and Linux task wrappers; Evaluation Mode on the Python, TypeScript, and Java tasks; Training Mode feedback; AI-coach guidance; image evidence; instructor-side report generation; and the missing-debugger warning. The three language tasks deliberately share a single intended bug—free-shipping eligibility computed from the original rather than the discounted taxable subtotal—so that running them confirms DebugTracker records the debugging process through one shared event model rather than a flow specialized to a particular language, exercising the language-agnostic design of 4.
6 Related Work↩︎
DebugTracker sits at the intersection of debugging education, programming-process analytics, and automated debugging, and it is positioned as a complement to, rather than a replacement for, work in each area.
Debugging as a learned skill. Debugging is repeatedly identified as one of the harder competencies for students to acquire. McCauley et al. [6] survey the educational literature and treat debugging as a distinct skill rather than a by-product of writing code, while the multi-institutional study of Fitzgerald et al. [7] reports that novices oscillate between systematic investigation and ad hoc “flailing.” These accounts align with classic characterizations of debugging as a question-driven, hypothesis-testing activity [1], [2]. Such work motivates assessing the process rather than only the final patch; DebugTracker operationalizes this by recording the reproduce–observe–hypothesize –edit–verify chain as reviewable evidence.
Programming-process data. A substantial body of computing-education research captures fine-grained student activity. Blackbox [8] collects snapshots and compilation events from BlueJ at large scale, Marmoset [9] captures incremental snapshots through a submission and testing system, and ProgSnap2 [10] standardizes a portable format for programming-process data; surveys of educational data mining catalog how such traces are analyzed [11]. These systems are optimized for large-scale, often institution-wide, research collection. DebugTracker differs in granularity and intent: it produces a task-scoped, human-readable narrative for individual review, records task-relevant metadata rather than full keystroke replay, and keeps coached and uncoached traces separate.
Automated debugging and explanation. Interactive systems such as the Whyline [4] let developers ask why and why-not questions about program behavior, and automated fault localization has been surveyed extensively [12]. Parnin and Orso [3], however, caution that such automation does not straightforwardly help programmers in practice. DebugTracker is complementary to this line of work: it does not localize faults or explain behavior, but instead makes the surrounding human investigation inspectable so that an instructor can judge how a student debugged.
7 Tool Availability↩︎
DebugTracker is distributed as a self-contained artifact. It contains the VS Code extension source, a prebuilt VSIX installer, cross-language sample tasks, a demo script, student and instructor guides, reproducibility notes, and a practice test report. The extension targets VS Code 1.88 or newer and installs from the VSIX without additional services; the optional AI coach is off by default and requires only an OpenAI-compatible endpoint when explicitly enabled. The source repository is available at https://github.com/t3-research/DebugTracker, a demonstration video is available at https://youtu.be/-hzR-Whu2s4, and an archived snapshot of the artifact is available at https://doi.org/10.5281/zenodo.20955037. The artifact is released under CC BY-NC-SA 4.0.
8 Conclusion↩︎
DebugTracker demonstrates a practical middle ground between final-code-only grading and intrusive screen capture. It records enough structured evidence for instructors to review how a student debugged while keeping coached practice, human labels, and raw assessment traces separate. By turning ordinary tests, breakpoints, edits, checkpoints, and verification into a reviewable, privacy-conscious trace, it makes the debugging process—not just its outcome—something an instructor can see, discuss, and assess. Future work will study DebugTracker in real classrooms, measuring whether process traces improve review efficiency, inter-instructor agreement, and the specificity of debugging feedback.