Population-Level Profiling of DSM-5 Depressive Symptoms Among Self-Reported ADHD and ASD Users on Twitter: An Exploratory Study Using Advanced NLP and Statistical Analysis
July 06, 2026
Abstract
Background: Depression frequently co-occurs with attention-deficit/hyperactivity disorder (ADHD) and autism spectrum disorder (ASD). However, population-level differences in how depressive symptoms are expressed between these groups remains underexplored.
Objective: This study examined whether social media users with ADHD and ASD differ in how they express Diagnostic and Statistical Manual of Mental Disorders, Fifth Edition (DSM-5) depressive symptoms in their tweets, focusing on the relative prominence of the nine symptoms at population level and testing whether observed differences persist across varying levels of depressive-content filtering.
Methods: We analysed 1,282,437 tweets from 792 users (622 ADHD; 170 ASD) from a diagnosis-disclosure Twitter dataset. Tweets were pre-filtered for depressive relevance using zero-shot NLI, then classified into nine DSM-5 depressive symptoms using MentalRoBERTa fine-tuned on ReDSM5 (an expert annotated dataset). Nine-symptom profiles were created and mean-centered per user. We applied L1-penalised logistic regression with 5-fold cross-validation to distinguish between ADHD and ASD users, complemented by Pearson correlations to assess symptom co-occurrence. We tested the robustness of our approach across five filtering thresholds (0.45–0.65) using 1,000-resample bootstrapping and cross-threshold sign consistency.
Results: For multi-label depression symptom classification, MentalRoBERTa achieved macro-F1 of 0.901 on a held-out set (\(\geq\) 0.85 F1 on 8/9 symptoms), substantially outperforming the original ReDSM5 benchmark. ADHD vs ASD classification using fitted logistic regression yielded stable but modest performance (cross-validated ROC-AUC 0.645–0.653 across thresholds). Coefficient analysis revealed that cognitive issues, sleep issues, appetite change, and fatigue consistently leaned toward ADHD, while suicidal ideation and anhedonia consistently leaned toward ASD (bootstrap selection \(\geq\) 0.90 across all thresholds). Psychomotor disturbance showed the same ASD-leaning directional effect with slightly lower stability. Correlation analysis revealed a largely shared symptom co-occurrence structure between groups (17 of 36 pairs individually bootstrap-robust in both groups and in the same direction); no pair met our pre-specified criterion for a robust disorder-specific difference.
Conclusions: Population-level differences in depression-related language between self-reporting social media users with ADHD and ASD were consistently observed across multiple analytic thresholds, indicating distinct patterns of depressive symptom expression. These differences reflect population-level reproducibility rather than clinical validity and should be interpreted as exploratory rather than as evidence of differing depressive phenomenology at the individual level.
Keywords: depression; DSM-5; ADHD; autism spectrum disorder; digital phenotyping; MentalRoBERTa; social media; natural language processing; Twitter.
Figure 1:  .
.
1 Introduction↩︎
Major depressive disorder is one of the most common psychiatric comorbidities in both attention-deficit/hyperactivity disorder (ADHD) [1], [2] and autism spectrum disorder (ASD) [3], [4], two highly prevalent and frequently co-occurring neurodevelopmental conditions [5], [6]. Epidemiological work has consistently reported elevated rates of depressive symptoms in both populations relative to neurotypical comparators, with prevalence estimates that vary widely depending on age, sex, and ascertainment. Beyond differing prevalence, several clinical accounts suggest that the phenomenology of depression itself differs between the two groups, encompassing differences in executive dysfunction [7], [8], autistic burnout and camouflaging-related exhaustion [9], [10], reward sensitivity and loneliness [11], and suicide risk [12]. Quantitative population-scale evidence that simultaneously profiles all nine DSM-5 symptoms across both conditions, however, has remained comparatively scarce [13].
We were motivated by two practical considerations. First, social media discourse provides a substantially large, naturalistic window onto how individuals describe their own symptoms, complementing the structured language of clinical interviews [14], and forms part of a broader digital-phenotyping paradigm for inferring behavioural and mental health states from naturalistic data streams [15]. A growing body of work has applied natural language processing to social media posts to study depressive language [16]–[18], with approaches ranging from bag-of-words and lexicon-based features [19], [20] to contextual embeddings from transformer-based models such as BERT [21], [22] and its domain-adapted successors such as MentalBERT and MentalRoBERTa [23]. Public diagnosis-disclosure datasets have also enabled characterisations of how individuals who self-report ADHD or ASD describe their experience online [24]–[26], though these analyses have generally focused on lexical or topical differences rather than formally defined depressive symptom dimensions. Second, the maturation of domain-adapted transformers—in particular MentalRoBERTa [23], which further pre-trains RoBERTa [27] on large mental-health social media corpora—has made it feasible to operationalise the DSM-5 depressive criteria as a multi-label text-classification task with credible sentence-level performance. We build directly on the ReDSM5 corpus [28], in which each sentence is labelled by a licensed psychologist for the presence or absence of each of the nine DSM-5 major depressive episode symptoms.
A further methodological challenge motivates our analytical design. Pipelines that combine zero-shot pre-filtering, supervised symptom classification, and downstream group comparisons are sensitive to design choices, particularly the probability threshold used for zero-shot depression-relevance filtering. Rather than selecting a single cutoff, we treat the threshold as a sensitivity parameter and report results across five values (0.45–0.65), requiring findings to remain consistent across this range before interpretation. We further combine within-threshold bootstrap stability with cross-threshold directional consistency to separate robust findings from those with unstable magnitude or no support.
We frame this study as exploratory and population level. We do not attempt to screen individuals, to diagnose, or to estimate clinical severity from text. Instead, we ask whether the relative emphasis on each DSM-5 depressive symptom dimension differs systematically between self-reported ADHD and ASD users at population level. This paper makes four contributions. First, it provides an exploratory, population-level characterisation of how the nine DSM-5 depressive symptoms are differentially emphasised across the two communities. Second, it introduces a two-stage classification pipeline that couples a zero-shot depression-relevance pre-filter with a MentalRoBERTa multi-label classifier fine-tuned on ReDSM5, with per-label decision-threshold calibration. Third, it contributes a graded robustness scheme that explicitly separates findings supported by both bootstrap stability and cross-threshold consistency from those that are not. Fourth, it adds a user-level co-occurrence analysis that tests whether the two groups differ in how depressive symptoms are organised pairwise.
2 Methods↩︎
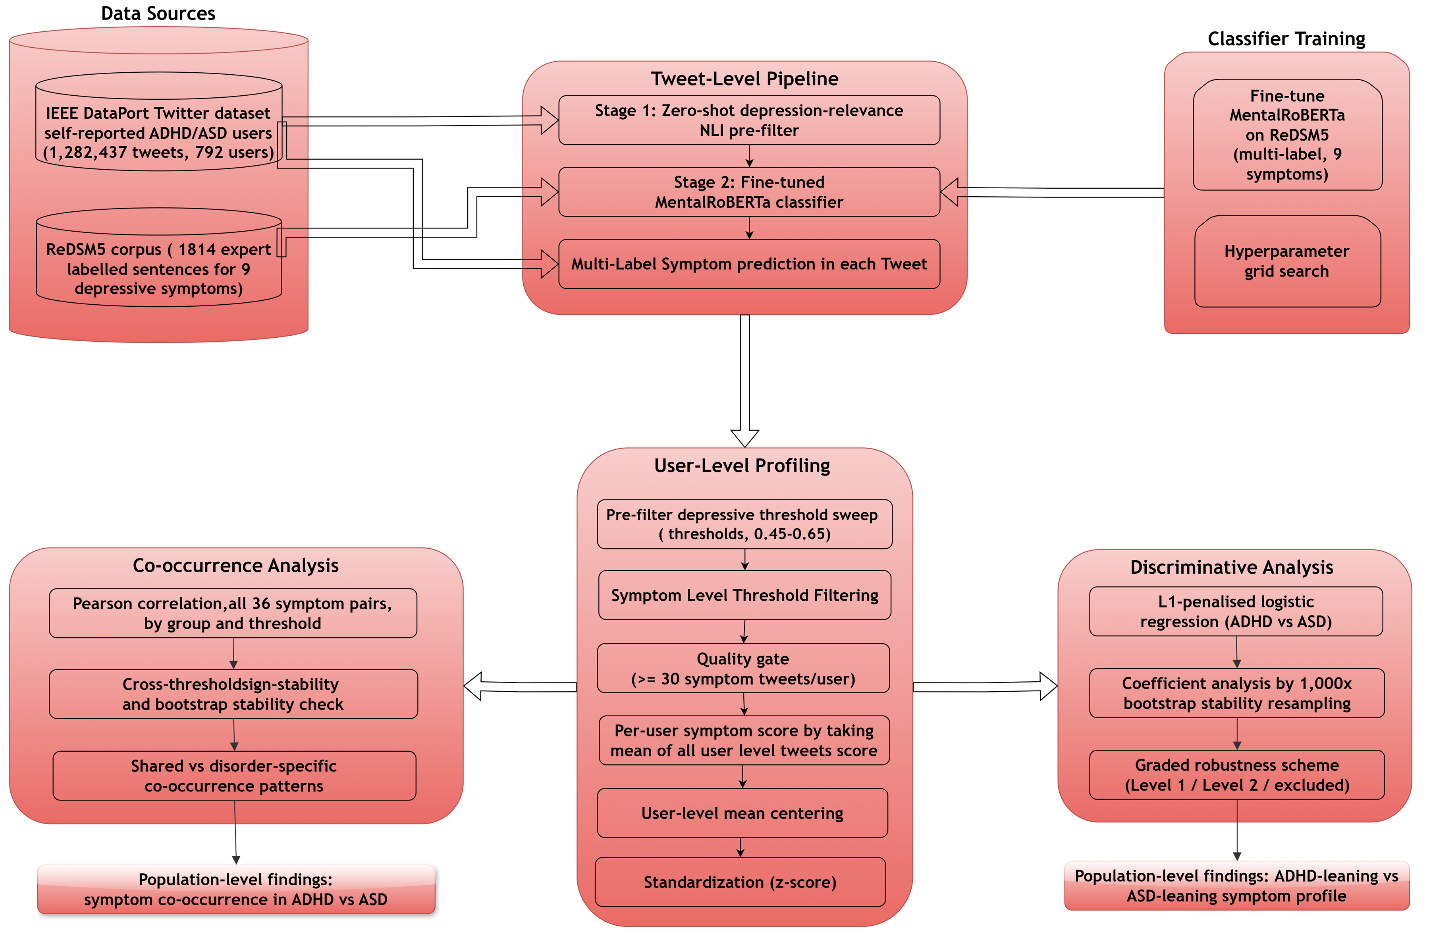
In this section we first describe our data sources, then our two-stage tweet-level classification pipeline and its calibration. We then turn to how we built user-level symptom profiles and compared users with ADHD and ASD, including our threshold-sensitivity design and bootstrap-based robustness criteria, before closing with a complementary symptom co-occurrence analysis. Figure 2 summarises the overall study workflow.
2.1 Data Sources↩︎
2.1.1 Twitter Data↩︎
We obtained the Twitter mental health dataset from IEEE DataPort [29]. The source dataset covers self-reported users across several mental health conditions; for this study we consider only the subset of users who self-reported a diagnosis of ADHD or ASD, and we do not analyse the other diagnostic groups this dataset contains. The dataset comprises tweets from users who explicitly self-reported a clinical diagnosis of ADHD or ASD within their public posts—not merely an expression of symptoms. Users and timeline posts were identified via the Twitter full-archive API using diagnosis-related search rules, enabling retrieval of historical tweets. All data are publicly available and were collected between September 1, 2020, and August 31, 2021 [29]. We use “Twitter” throughout for consistency with the dataset, noting the platform was rebranded to X after the collection period. The raw corpus comprised 1,009,002 tweets from 622 self-reported ADHD users and 273,435 tweets from 170 self-reported ASD users (total: 1,282,437 tweets from 792 users).
2.1.2 Annotation Corpus for Classifier Training↩︎
We trained and evaluated the multi-label symptom classifier on ReDSM5 [28], an expert-annotated corpus of Reddit posts in which a licensed psychologist labelled each sentence for the presence or absence of the nine DSM-5 major depressive episode criteria [30] (depressed mood, anhedonia, appetite change, sleep issue, psychomotor disturbance, fatigue, worthlessness, cognitive issues, and suicidal ideation). After preprocessing, the working corpus comprised 1,814 sentences, of which 1,427 (1379 unique) carried at least one DSM-5 symptom label. We found the symptom labels to be distributed unevenly i.e.worthlessness (\(n\) = 340), depressed mood (\(n\) = 364), suicidal thoughts (\(n\) = 190), fatigue (\(n\) = 140), anhedonia (\(n\) = 137), sleep issue (\(n\) = 112), cognitive issues (\(n\) = 61), appetite change (\(n\) = 48), and psychomotor (\(n\) = 35). This imbalance motivates the class-imbalance handling described under Stage 2 (Multi-Class Model Training), below, and we interpret findings for the sparsest labels with correspondingly greater caution throughout. The sentence-level annotation of ReDSM5 training data mostly mitigates domain shift [31]. Unlike full Reddit posts, sentence-level Reddit data more closely resembles tweets in terms of length and semantic granularity. Since symptom mentions are typically expressed within a single sentence (e.g., “I have a persistent sadness”), sentence-level training encourages the model to learn symptom-specific contextual representations rather than relying on long-document context.
2.2 Tweet-Level Classification Pipeline↩︎
2.2.1 Stage 1: Zero-Shot Depressive Content Screening↩︎
In stage 1, we screened all 1,282,437 tweets for depressive relevance before symptom-level classification, using a zero-shot depression-relevance pre-filter based on natural language inference (NLI): a cross-encoder NLI model (cross-encoder/nli-deberta-v3-large) scored each tweet against two candidate labels, “DSM-5 depressive symptom present” and “no DSM-5 depressive symptom.” In brief, NLI-based zero-shot classification reframes each candidate label as a hypothesis (e.g., “this text expresses a DSM-5 depressive symptom”) and uses a model trained on large-scale entailment data to judge whether the tweet (the premise) entails that hypothesis, which lets the same pre-trained model score arbitrary candidate labels without any label-specific training data. We emphasise that this stage performs binary depressive-relevance screening only: it does not identify which DSM-5 symptom(s) a tweet expresses. That determination is made entirely by the fine-tuned multi-label MentalRoBERTa classifier in Stage 2, which is the only component of the pipeline that produces symptom-level (multi-label) output. It is built on the DeBERTa-v3 architecture [32], and cross-encoder NLI models of this kind report the strongest published accuracy among general-purpose entailment models of comparable size on standard NLI benchmarks [33], [34], trained with the SentenceTransformers Cross-Encoder class on the combined SNLI and MultiNLI corpora [34]. A supervised alternative would require a labelled Twitter depression-relevance corpus that does not exist for this population, and risks conflating relevance filtering with Stage 2’s symptom-level labels. Because our Stage 1 task is itself an entailment judgement (whether a tweet entails the hypothesis that it expresses a DSM-5 depressive symptom), we consider these general-purpose NLI benchmarks directly relevant to its suitability as a depression-relevance screen, rather than requiring a zero-shot-specific benchmark.
The conventional default decision boundary for zero-shot NLI classifiers is a positive-label probability of 0.5 [33]. We adopted 0.5 as the nominal default and assessed the stability of all downstream findings by sweeping the threshold across five values (0.45–0.65), as described under Pre-Filter Zero-Shot Threshold Sensitivity Design, below. We deliberately calibrated this stage toward recall rather than precision: a tweet wrongly excluded here (a false negative) is permanently lost to the analysis, since no later stage can recover it, whereas a tweet wrongly retained (a false positive) can still be corrected downstream. Two further gates absorb that cost: the per-label calibrated threshold introduced under the section Per-Label Decision Threshold Calibration, below, discards any pre-filtered tweet that fails to clear a symptom-specific evidence threshold, and the per-user quality gate, described under User Symptom Scoring and Quality Gating, below, additionally requires at least 30 doubly-gated tweets before a user’s symptom profile is computed at all. Stage 1 is therefore intentionally a wide, high-recall candidate filter, with precision enforced by the two downstream gates rather than by the zero-shot threshold itself. The same recall-first logic used to justify permissive screening in biomedical text mining, where a missed relevant item cannot be recovered by later stages but a wrongly retained one still can be [35]. A high-recall first-stage filter followed by a higher-precision second-stage model is a good strategy in such applications [36]. In practice, the NLI pre-filter performed well as an initial screen for depressive language, substantially reducing the volume of off-topic tweets. Of the 1,282,437 tweets in the initial corpus, the number retained fell sharply. For instance, 579,569 tweets (45.2%) passed at a threshold of 0.45, dropping to 474,415 (37.0%) at 0.50, 373,667 (29.1%) at 0.55, 280,328 (21.9%) at 0.60, and 197,213 (15.4%) at 0.65. This decline reflects the expected recall-precision trade-off across the sweep: lower thresholds (e.g., 0.45) favour recall, admitting more candidate tweets (and more eventual false positives for the downstream gates to filter out), while higher thresholds (e.g., 0.65) favour precision at the cost of prematurely discarding some genuinely relevant tweets. Supplementary Table S7 carries these counts forward through the two downstream gates. Only the depressively-relevant subset that survived this screen was then passed to the fine-tuned multi-label DSM-5 symptom classifier described under Stage 2.
2.2.2 Stage 2: Multi-Class Model Training↩︎
We fine-tuned MentalRoBERTa [23] as the Stage 2 symptom model, since domain-adapted transformers pre-trained on mental-health social media text represent the state-of-the-art approach for symptom-level text classification of this kind [23]. Because a single tweet can express more than one DSM-5 symptom, the underlying task is formally multi-label [37]. MentalRoBERTa’s domain-adaptive pre-training makes it well-suited to the informal, symptom-expressive register of Twitter discourse.
We added a classification layer on top of the model: it takes the model’s representation of each post (a 768-number vector) and turns it into nine scores, one for each DSM-5 depression symptom, using a sigmoid function to keep scores between 0 and 1, with dropout used to prevent overfitting. We trained the model using Binary Cross-Entropy with Logits loss (a standard way to score multi-label predictions), extended with inverse-frequency positive-class weighting so that rarer symptoms count for more—a common fix for imbalanced data [38]—plus an optional smoothing step that stops the model from being overconfident about rare symptoms. Each post was shortened or padded to 128 tokens (word pieces), using a batch size of 16.
To tune Stage 2 classifier hyperparameters, we ran a grid search over 48 configurations (Table 1), training the classification head at 10\(\times\) the encoder learning rate. All runs used AdamW [39] (weight decay 0.01, gradient clipping 1.0), a linear warmup schedule, up to 16 epochs, and early stopping (patience = 3) based on validation macro-F1. Data were split into stratified training (70%), validation (15%), and test (15%) sets (965/207/207 sentences), making sure that no duplicate entry comes in the test set. After selecting the best hyperparameters and epoch count via grid search, we retrained the model on the full dataset using these fixed settings to maximise data utilisation.
| Hyperparameter | Values Considered (Grid Search) |
|---|---|
| Encoder learning rate | \(8\times10^{-6}\), \(2\times10^{-5}\) |
| Dropout | 0.3, 0.4 |
| Label smoothing | 0.0, 0.05 |
| Positive-weight boost multiplier | 1.0, 1.5, 2.0 |
| Warmup ratio | 0.06, 0.10 |
Best configuration found: encoder learning rate = \(2\times10^{-5}\)
; dropout = 0.4; label smoothing = 0.0; boost multiplier = 1.5; warmup ratio = 0.10; converging at epoch 9.
2.2.3 Per-Label Decision Threshold Calibration↩︎
We performed a per-label threshold sweep on the validation set, rather than applying one uniform sigmoid threshold to every symptom, selecting the value that maximised binary F1 for each label independently. The resulting thresholds ranged from 0.150 (Suicidal Thoughts) to 0.825 (Depressed Mood), reflecting differences in base rate and linguistic specificity across symptoms. We use these calibrated thresholds for two purposes: to convert continuous scores into binary decisions for classifier evaluation and reporting (reported later under Classifier Performance), and, as a secondary per-tweet relevance gate, to identify which pre-filtered tweets carry calibration-consistent symptom-level signal before they are aggregated into per-user profiles. As described under User Symptom Scoring and Quality Gating and Per-User Symptom Vectors and User-Level Centering, below, per-user symptom profiles are then formed by averaging the raw calibrated sigmoid scores across a user’s gated, pre-filtered tweets.
2.2.4 User Symptom Scoring and Quality Gating↩︎
We applied the fine-tuned model to every tweet that passed the zero-shot depression-relevance pre-filter (described above under Stage 1), producing a sigmoid probability score in [0, 1] for each of the nine DSM-5 dimensions per tweet. Before aggregating these scores into per-user profiles, we applied a further per-tweet symptom-relevance gate: a tweet was retained only if at least one of its nine symptom scores exceeded that symptom’s own per-label calibrated decision threshold introduced above (Table 2). This gate ensures that per-user symptom means are computed from tweets carrying calibration-consistent symptom-level signal, rather than being diluted by tweets whose scores are uniformly low across all nine dimensions. For each user, we then formed a per-symptom score by averaging the raw sigmoid scores across that user’s gated, pre-filtered tweets, separately for each of the nine symptoms.
We excluded users contributing fewer than 30 depressive relevant tweets, so that each per-user mean vector was computed from a statistically reliable sample. Under a worst-case binomial assumption, the standard error of a per-user mean is at most \(\sqrt{0.25/30} \approx 0.091\), and falls below 0.03 at realistic per-symptom base rates. At the nominal pre-filter threshold (0.50), the symptom-relevance gate followed by this per-user quality gate retained 560 ADHD and 150 ASD users; the retained counts vary with the pre-filter threshold, as in Supplementary Table S1; the full tweet- and user-level attrition at each filtering stage (Stage 1 pre-filter, per-tweet symptom-score gate, and per-user minimum-tweet gate) is given in Supplementary Table S7. We note that mean scores close to zero are expected here: they reflect base rates of symptom-relevant language in naturalistic Twitter discourse, not individual clinical severity.
2.3 Group-Level Comparison↩︎
2.3.1 Per-User Symptom Vectors and User-Level Centering↩︎
For each retained user, we built a nine-dimensional symptom profile by averaging the raw per-tweet sigmoid scores across that user’s pre-filtered tweets. To remove between-user differences in overall depressive-language intensity and isolate each user’s relative symptom emphasis, we centered each profile on that user’s own average across the nine symptoms—a step we refer to as user-level centering—for user \(u\), the centered value for symptom \(k\) is \(x_{u,k} = s_{u,k}\) minus that user’s own mean across all nine symptom scores. We then standardised each centered feature to zero mean and unit variance across users before fitting the logistic regression (discriminative model) described under L1-Penalised Logistic Regression with Nested Cross-Validation, below.
In effect, this two-step procedure asks which symptoms a given user emphasised more or less than their own personal baseline, rather than how much depressive language they produced overall.
2.3.2 Pre-Filter Zero-Shot Threshold Sensitivity Design↩︎
We re-ran the full downstream analysis at five depression-relevance pre-filter zero-shot thresholds spanning 0.45 to 0.65 in steps of 0.05, to establish whether our group-level findings are robust to the zero-shot pre-filter cutoff. At each threshold we re-derived per-user symptom profiles, re-centered and re-standardised them, and re-fit the discriminative model. Because both the per-tweet symptom-relevance gate and the per-user quality gate (\(\geq\) 30 gated tweets, as defined above under User Symptom Scoring and Quality Gating) were re-applied at each threshold, the retained sample size decreased across the swept range, from \(n\) = 719 (ADHD = 567; ASD = 152) at the lowest threshold (0.45) to \(n\) = 658 (ADHD = 522; ASD = 136) at the highest (0.65), while the ADHD:ASD ratio remained approximately stable throughout (Supplementary Table S1).
2.3.3 L1-Penalised Logistic Regression with Nested Cross-Validation↩︎
We trained an L1-penalised (LASSO) logistic regression classifier [40] at each threshold to discriminate ADHD from ASD users from their centered, standardised symptom profiles, using class-balanced weights to compensate for the ADHD:ASD imbalance. We selected the inverse regularisation strength \(C\) by 5-fold cross-validated ROC-AUC [41], [42] over a 20-point logarithmic grid (LogisticRegressionCV; liblinear solver; maximum 2,000 iterations). We chose L1 regularisation so that uninformative symptom dimensions would be driven to exactly zero, providing an automatic sparsity-based selection signal alongside the bootstrap stability analysis described next.
2.3.4 Bootstrap Stability and Robustness Criteria↩︎
We performed 1,000 nonparametric bootstrap resamples of users at each threshold (sampling with replacement, preserving the original sample size; seed = 42) [43]. For each symptom we derived the bootstrap mean coefficient, the 2.5–97.5 percentile interval, the selection frequency (the proportion of resamples in which the coefficient was non-zero), and a stability flag indicating whether the 95% interval excluded zero. We then applied a pre-specified graded robustness scheme that combines cross-threshold directional consistency with within-threshold bootstrap selection frequency. Level 1 (robust; primary findings) required an identical coefficient sign at all five thresholds and bootstrap selection \(\geq\) 0.90 at every threshold. Level 2 (directionally consistent; secondary findings) required an identical sign at all five thresholds and selection \(\geq\) 0.90, but allowed intervals that include zero. We excluded from interpretation any symptom whose sign flipped across the range, whose selection declined monotonically, or whose non-zero status was confined to one end of the range. This scheme privileges direction over magnitude estimates that are inherently noisy under L1 regularisation at small effect sizes.
2.3.5 Symptom Co-occurrence Analysis↩︎
To complement the discriminative analysis, we computed Pearson correlation coefficients between all 36 pairs of the nine DSM-5 symptom dimensions over the centered per-user symptom profiles, separately for each disorder group (ADHD and ASD) at each pre-filter threshold.
Because profiles were user-level centered before correlation, the resulting coefficients describe relative co-emphasis after between-user differences in overall depressive-language intensity have been removed. For each pair and threshold, we additionally performed 1,000 nonparametric bootstrap resamples of users (sampling with replacement, preserving the original sample size; seed = 42), yielding a 95% percentile bootstrap confidence interval on each correlation. We classified a pair as sign-stable if its point-estimate correlation retained the same sign at every threshold, and as bootstrap-robust if it was additionally sign-stable and its 95% bootstrap interval excluded zero at every threshold—a stricter criterion analogous to the graded robustness scheme used for the discriminative analysis (described above under Bootstrap Stability and Robustness Criteria). To compare groups directly rather than relying on informal inspection of each group’s estimates, we bootstrapped the ADHD \(-\) ASD difference in \(r\) for each pair at each threshold; because the two groups’ bootstrap resamples are independent, subtracting the resampled correlations element-wise yields a valid empirical distribution of the difference. We classified each pair into one of three categories: disorder-specific (the between-group difference was sign-stable and its 95% CI excluded zero at every threshold); shared (both groups’ own correlations were individually bootstrap-robust, in the same direction, and the between-group difference CI included zero at every threshold); or ambiguous (neither criterion was met—for example, because one group’s own estimate was not itself bootstrap-robust, even where the point-estimate gap between groups was large).
| Symptom | Calibrated Threshold | Test F1 | ReDSM5 Corpus Support |
|---|---|---|---|
| Depressed Mood | 0.825 | 0.901 | 364 |
| Worthlessness | 0.575 | 0.889 | 340 |
| Suicidal Thoughts | 0.150 | 0.983 | 190 |
| Fatigue | 0.425 | 0.851 | 140 |
| Anhedonia | 0.425 | 0.850 | 137 |
| Sleep Issues | 0.600 | 0.970 | 112 |
| Cognitive Issues | 0.300 | 0.941 | 61 |
| Appetite Change | 0.450 | 1.000 | 48 (Low Support) |
| Psychomotor | 0.450 | 0.727 | 35 (Low Support) |
| Overall | — | Macro-F1 0.901 / Micro-F1 0.904 | |
| Train: 965 / Val: 207 / Test: 207 | |||
3 Results and Discussion↩︎
3.1 Corpus Overview↩︎
The raw corpus comprised 1,282,437 tweets from 792 users (ADHD: 1,009,002 tweets from 622 users; ASD: 273,435 tweets from 170 users). At the nominal pre-filter threshold (positive-class probability \(\geq\) 0.5), the zero-shot depression-relevance pre-filter retained 474,415 tweets (37.0%) as depressively relevant, which were then passed to the fine-tuned MentalRoBERTa classifier. Applying the per-tweet symptom-relevance gate (described under User Symptom Scoring and Quality Gating in the Methods) further narrowed this to 369,300 tweets, and applying the per-user quality gate (\(\geq\) 30 gated tweets) to those produced the final analytic sample of 710 users (ADHD \(n\) = 560; ASD \(n\) = 150) and 368,011 tweets. The ADHD-to-ASD ratio reflects the substantially larger ADHD user base in the source dataset [29]. We note that the user counts reported in the threshold-sweep supplementary analysis (Supplementary Table S1) already reflect both the per-tweet symptom-relevance gate and the per-user quality gate applied separately at each of the five swept thresholds, and therefore decrease across the range—from \(n\) = 719 at the lowest threshold (0.45) to \(n\) = 658 at the highest (0.65).
3.2 Classifier Performance↩︎
Our fine-tuned MentalRoBERTa model achieved strong multi-label performance on the held-out test set (Table 2): macro-F1 = 0.901, micro-F1 = 0.904, Hamming loss = 0.022, and exact match accuracy = 0.874, establishing the classifier as a suitable measurement instrument for the population-scale comparisons that follow. For reference, the original ReDSM5 resource paper reported considerably lower baseline performance on the same nine-symptom classification task: its best-performing baseline, a fine-tuned LLM, achieved macro-F1 = 0.49 and micro-F1 = 0.54, while a fine-tuned BERT baseline achieved macro-F1 = 0.36 and micro-F1 = 0.51 [28]. It should be noted that the original authors reported the performance using an 80/20 train-test split, whereas we report our results using a 70/15/15 train/validation/test split. Our domain-adapted MentalRoBERTa classifier, trained with inverse-frequency class weighting and per-label threshold calibration, therefore substantially exceeds these previously published reference benchmarks on the corpus from which it was derived. This methodological contribution stands independent of the downstream ADHD–ASD analysis. For comparison within our own pipeline, applying a single uniform sigmoid threshold to every symptom, rather than the per-label calibrated thresholds described under Per-Label Decision Threshold Calibration in the Methods, yielded a lower macro-F1 of 0.87 on the same held-out test set, confirming that per-label calibration meaningfully improves classifier performance over a fixed-threshold baseline. We observed generalisation gaps for Fatigue (val-F1 = 0.976 vs test-F1 = 0.851), Anhedonia (0.923 vs 0.850), and Psychomotor (0.909 vs 0.727), likely attributable to limited annotated support for Psychomotor (\(n\) = 35) and to cross-platform linguistic variability in fatigue and anhedonia expressions. We treat the best test-F1 for Appetite Change with corresponding caution, since it reflects a small support set (\(n\) = 48) rather than a fully generalisable result.
3.3 ADHD vs ASD Discriminative Symptom Profile↩︎
The L1-penalised logistic classifier achieved modest but stable discrimination across the swept pre-filter thresholds, with 5-fold cross-validated ROC-AUC ranging narrowly from 0.645 (threshold = 0.45) to 0.653 (threshold = 0.50), and training accuracy ranging from 0.673 to 0.681 over the same range (see Supplementary Table S1). Neither metric varied monotonically with threshold: AUC peaked at 0.50 (0.653) and was essentially flat across the remaining four thresholds (0.645–0.649), while training accuracy likewise stayed within a narrow 0.673–0.681 band throughout. This flatness, despite the retained sample shrinking from \(n\) = 719 (0.45) to \(n\) = 658 (0.65), indicates that discrimination performance was not concentrated at either extreme of the sweep and was not an artefact of sample size. We consider the modest absolute AUC expected: the task is to separate two populations sharing substantial depressive comorbidity, using only the relative emphasis of nine symptoms after user-level centering.
Seven of the nine DSM-5 symptoms retained an identical coefficient sign across all five pre-filter thresholds (Table 3, Figure 3), which is the principal robustness signal of the analysis: the ADHD-versus-ASD symptom-profile contrast does not depend on the depression-relevance cutoff. Six symptoms met our Level 1 (robust) criterion, with bootstrap selection \(\geq\) 0.90 at every threshold. Cognitive issues were ADHD-leaning at every threshold (selection 0.99–1.00); sleep disturbance was ADHD-leaning throughout (0.94–1.00); appetite change was ADHD-leaning throughout (0.98–1.00; though we note its low annotated support, \(n\) = 48, as in Table 2); fatigue was ADHD-leaning throughout (0.98–1.00); suicidal ideation was ASD-leaning throughout (0.997–1.00); and anhedonia was ASD-leaning throughout (0.95–0.98). Together, these six symptoms define the discriminative profile we observe: an ADHD-leaning axis of cognitive, sleep, appetite, and fatigue-related depressive expression, contrasted with an ASD-leaning emphasis on suicidal ideation and anhedonia.
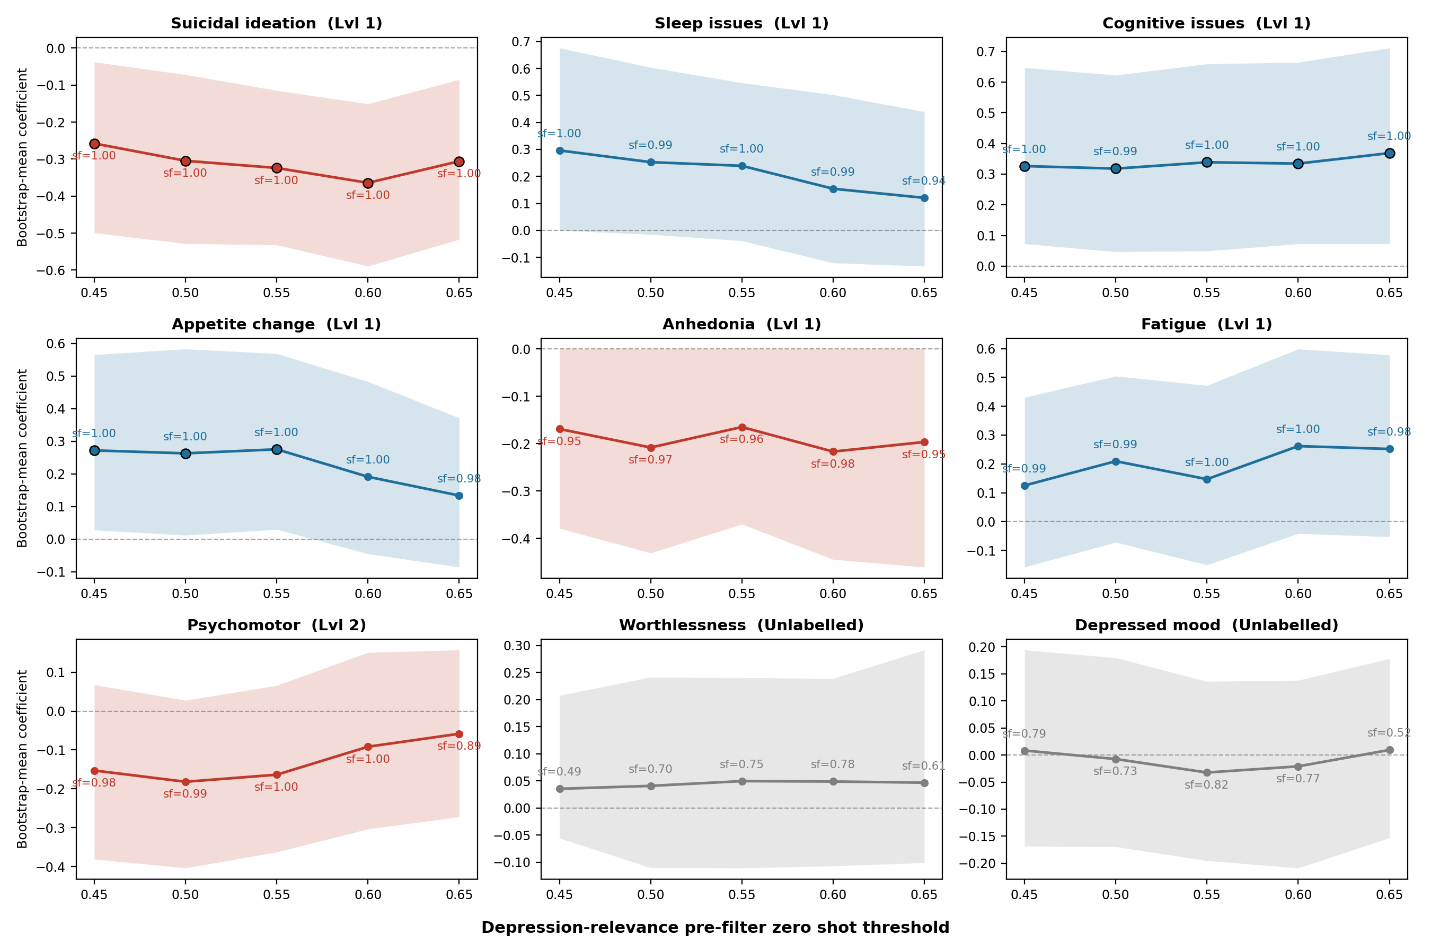
One further symptom met our Level 2 (directionally consistent) criterion: an identical sign across all five thresholds, but with bootstrap selection dipping marginally below 0.90 at one end of the range. Psychomotor disturbance was ASD-leaning at every threshold, with selection ranging from 0.89 to 1.00 and dipping just below 0.90 only at the highest threshold (0.65). The remaining two symptoms did not meet our pre-specified criteria. Worthlessness was ADHD-leaning at four of the five thresholds (0.45, 0.50, 0.60, and 0.65), with a coefficient that fell to exactly zero at 0.55; bootstrap selection remained low throughout (0.49–0.78) and never reached 0.90, so we do not interpret it as discriminative. Depressed mood was ASD-leaning at three of the five thresholds (0.50, 0.55, and 0.60; selection 0.73–0.82), with coefficients that fell to exactly zero at both ends of the sweep (0.45 and 0.65); selection across the full sweep ranged from 0.52 (lowest, at 0.65) to 0.82, never reaching 0.90; we likewise do not interpret this symptom as discriminative.
The ADHD-leaning emphasis on cognitive complaints aligns broadly with clinical accounts that foreground attentional and executive symptoms in adult ADHD presentations of depression [7], [8], and our finding is agnostic to whether such complaints are read as residual ADHD-attributed difficulty or as a depressive cognitive symptom. The accompanying ADHD-leaning emphasis on sleep disturbance, appetite change, and fatigue likewise converges with clinical evidence that these somatic correlates are common, frequently under-recognised features of ADHD in adulthood [44], [45]. Suicidal ideation and anhedonia were the two Level 1 ASD-leaning findings: the former is broadly consistent with clinical literature documenting elevated suicide risk in autistic populations [12], and the latter is in line with prior reports that anhedonia is a prominent feature of depression in autistic adults [11], though we discuss both descriptively and at the language level only. Psychomotor disturbance showed the same ASD-leaning direction at a secondary (Level 2) level of robustness. We caution that our analysis is correlational, language-based, and population-level, and does not establish that any individual would meet diagnostic criteria in a clinical interview.
| Symptom | Coefficient Direction | Selection freq.range | Level | Interpretation |
|---|---|---|---|---|
| Cognitive issues | ADHD | 0.99–1.00 | 1 | Primary finding; consistent sign and selection \(\geq\) 0.90 at every threshold |
| Sleep disturbance | ADHD | 0.94–1.00 | 1 | Primary finding |
| Fatigue | ADHD | 0.98–1.00 | 1 | Primary finding |
| Anhedonia | ASD | 0.95–0.98 | 1 | Primary finding |
| Suicidal ideation | ASD | 0.99–1.00 | 1 | Primary finding |
| Appetite change | ADHD | 0.98–1.00 | 1 | Primary finding; interpret with some caution given low annotated support (\(n\)=48) |
| Psychomotor | ASD | 0.89–1.00 | 2 | Directionally consistent (ASD-leaning); selection dips marginally below 0.90 at threshold 0.65 |
| Depressed mood | ASD (unstable) | 0.52–0.82 | — | ASD-leaning at three of five thresholds (0.50–0.60); coefficient zero at both the lowest (0.45) and highest (0.65) thresholds; selection never reaches 0.90; not interpreted |
| Worthlessness | ADHD | 0.49–0.78 | — | ADHD-leaning at four of five thresholds; coefficient zero at threshold 0.55; bootstrap selection remains low throughout, never reaching 0.90; not interpreted |
3.4 Symptom Co-occurrence Structure↩︎
The pairwise symptom co-occurrence structure was largely stable across the swept pre-filter thresholds: 34 of 36 symptom pairs (94%) retained the same correlation sign at every threshold in the ADHD group and 31 of 36 (86%) in the ASD group. Applying our stricter bootstrap-robustness criterion (sign-stable and 95% CI excluding zero at every threshold), 26 of 36 pairs (72%) were bootstrap-robust in ADHD and 20 of 36 (56%) in ASD. We interpret the sign-unstable pairs in each group (2 in ADHD, 5 in ASD), all of which showed weak mean Pearson coefficients (\(-0.06\) to \(+0.07\)), as noise rather than substantive co-occurrence relationships.
A shared co-occurrence backbone was evident across both groups: a somatic cluster in which fatigue, sleep, psychomotor disturbance, and appetite change were positively intercorrelated—fatigue–sleep being the strongest pair within this shared cluster in both disorders (ADHD mean \(r\) = \(+0.53\); ASD mean \(r\) = \(+0.52\)). A mood trade-off structure in which depressed mood, worthlessness, anhedonia, and suicidal thoughts (together with sleep- and cognitive-related language) were mutually negatively correlated, indicating that emphasising one symptom register comes at the expense of others. The worthlessness–suicidal pair was the sole consistently positive association within the affective set in both groups (ADHD mean \(r\) = \(+0.32\); ASD mean \(r\) = \(+0.30\)). In total, 17 of 36 pairs met our criteria for a shared pattern—individually bootstrap-robust in both groups, in the same direction, with a between-group difference whose 95% CI included zero at every threshold (full details in Supplementary Table S2).
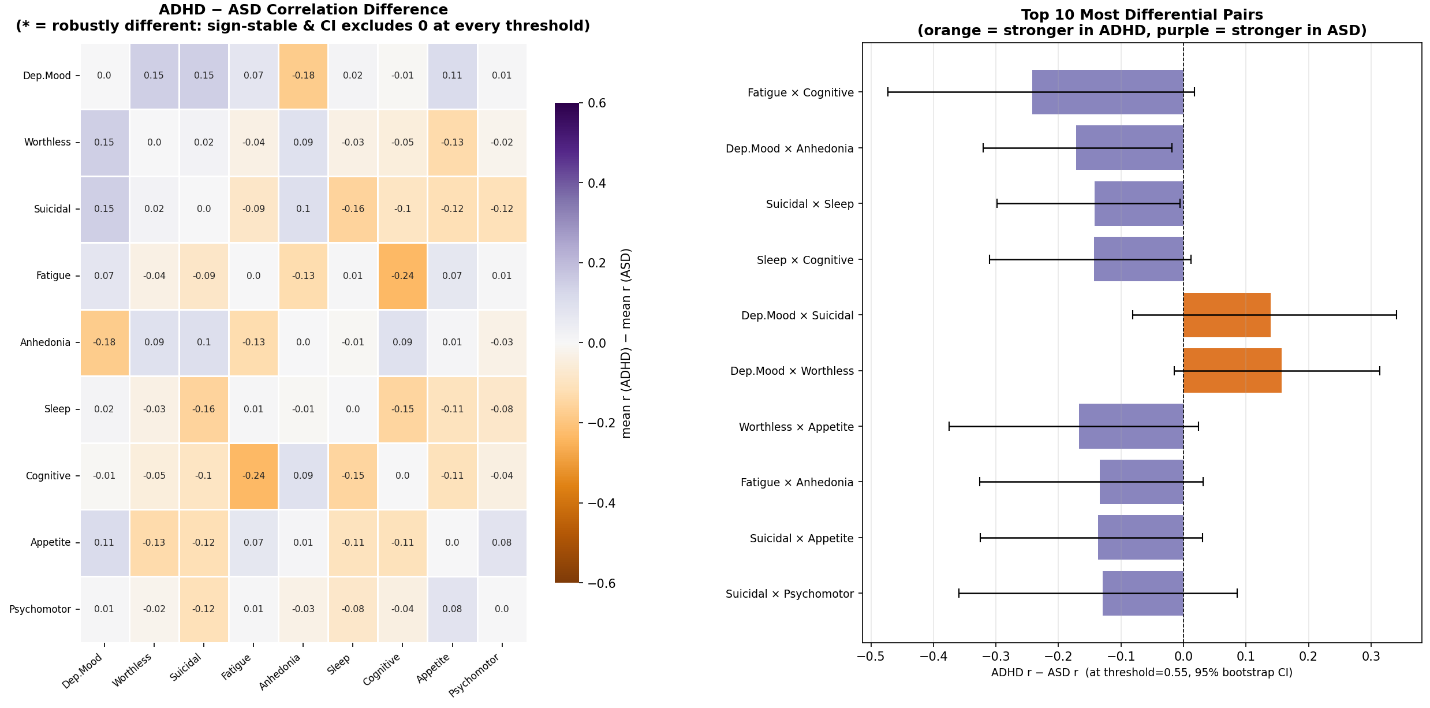
No pairwise relationship met our stricter disorder-specific criterion—a between-group difference that is sign-stable and whose 95% bootstrap CI excludes zero at every threshold. Under the fully gated pipeline described under User Symptom Scoring and Quality Gating in the Methods, every pair that showed a large point-estimate gap between ADHD and ASD also had at least one threshold at which the between-group difference’s bootstrap interval touched zero, at least one group’s own within-group estimate that was not itself bootstrap-robust, or both. We therefore do not report a confirmed disorder-specific co-occurrence pattern; the closest candidates are described below as exploratory only (Table 4, Figure 4).
These findings illustrate the complementary value of co-occurrence analysis alongside conventional discriminative modelling in population-level digital phenotyping studies. The remaining 19 of 36 pairs showed inconsistent or underpowered evidence for either a shared or a disorder-specific pattern under our stricter joint test and are not interpreted as confirmed findings (Supplementary Tables S3–S4). The three pairs with the largest point-estimate group gaps illustrate why: fatigue–cognitive coupling was bootstrap-robust and positive in ASD (mean \(r\) = \(+0.31\)) but only weakly and non-robustly positive in ADHD (mean \(r\) = \(+0.07\)); depressed mood–anhedonia was bootstrap-robust and negative in both groups but noticeably stronger in ADHD (mean \(r\) = \(-0.44\)) than in ASD (mean \(r\) = \(-0.26\)), with the between-group difference itself not consistently significant across the sweep. Suicidal ideation–sleep language was bootstrap-robust and negative in ADHD (mean \(r\) = \(-0.13\)) but sign-unstable in ASD (mean \(r\) = \(+0.02\)). In each case, at least one side of the comparison falls short of our pre-specified robustness bar, so we flag these three pairs as candidates for confirmation in future, larger samples rather than treating any of them as an established disorder-specific finding.
| Symptom pair | ADHD mean \(r\) | ASD mean \(r\) | Pattern | |
|---|---|---|---|---|
| Fatigue \(\times\) Cognitive | \(+0.07\) | \(+0.31\) | \(+0.24\) | Bootstrap-robust and positive in ASD; only weakly, non-robustly positive in ADHD |
| Suicidal \(\times\) Sleep | \(-0.13\) | \(+0.02\) | \(+0.16\) | Bootstrap-robust and negative in ADHD; sign-unstable in ASD |
| Dep.Mood \(\times\) Anhedonia | \(-0.44\) | \(-0.26\) | \(+0.18\) | Bootstrap-robust and negative in both groups; between-group difference not consistently significant across the sweep |
3.5 Summary of Results↩︎
The discriminative model identified six robust ADHD- or ASD-leaning symptoms (Table 3): cognitive issues, sleep disturbance, appetite change, and fatigue leaned ADHD, while suicidal ideation and anhedonia leaned ASD, with psychomotor disturbance showing the same ASD-leaning pattern at secondary robustness. The co-occurrence analysis showed a broadly shared symptom backbone across groups (17 of 36 pairs; Supplementary Table S2); no pair met our pre-specified disorder-specific criterion, and the remaining 19 pairs—including fatigue–cognitive, depressed mood–anhedonia, and suicidal ideation–sleep, the three largest point-estimate gaps between groups (Table 4)—showed ambiguous or underpowered evidence and are not interpreted as confirmed findings.
4 Limitations↩︎
Several limitations should be considered when interpreting these findings. First, classifier performance is less certain for the sparsest symptom categories (psychomotor, \(n\) = 35; appetite change, \(n\) = 48) and MentalRoBERTa was fine-tuned and evaluated entirely on Reddit-based annotated sentences, so the reported macro-F1 = 0.901 (Table 2) may not fully transfer to the tweets it was applied to. Manual inspection of tweet-level scores suggests some activations reflect lexical or topical cues rather than genuine symptom content; per-user averaging over many tweets should dilute such isolated misfires.
Second, logistic regression accuracy is appropriate for detecting population-level signal but insufficient for individual-level prediction, screening, or clinical application; the modest ROC-AUC (0.645–0.653) means our robustness checks establish that the signal is stable, not that it is large or clinically valid, so the discriminative findings should be read as reproducible but modest language-level tendencies.
The study relies on unverified self-reported ADHD/ASD diagnoses, which may include misdiagnosis or self-diagnosis, potentially affecting the validity of the findings. It is also subject to selection bias, as only users who publicly disclose their diagnosis are included, making the sample unrepresentative. Finally, without a neurotypical control group, the results can distinguish ADHD from ASD but cannot determine how either group differs from the general population.
Finally, the use of Twitter data introduces additional constraints on generalisability, as the user population is likely biased toward adults in a limited set of predominantly English-speaking regions, and may not reflect symptom expression across different age groups, languages, or cultural contexts.
5 Conclusion↩︎
Self-reported social media discourse contains a small but consistent population-level signal distinguishing how DSM-5 depressive symptoms are expressed and organised in ADHD and ASD communities, with ADHD users showing a cognitive/sleep/appetite/fatigue-leaning profile and ASD users showing greater emphasis on anhedonia and suicidal ideation. These differences remained stable across multiple preprocessing thresholds, suggesting that they are not artefacts of a single analytic setting but reflect reproducible patterns in language use. While the effects are modest and not suitable for individual-level diagnosis, they nonetheless indicate systematic differences in how depressive experiences are communicated across neurodevelopmental conditions. Together, the discriminative and co-occurrence results point to a modest but reproducible signal, potentially useful as a corroborating observational source for clinical hypotheses about phenomenological differences between the two disorders [13].
Ethics Statement↩︎
All data analysed were publicly available under restricted access subject to specific terms and conditions, already anonymised, and obtained from existing public research resources (described under Data Sources in the Methods); we did not use any private messages, protected accounts, or direct identifiers, and we do not republish any individual content, consistent with established guidance on the ethical use of public social media data for population-level mental health research [46]. We also interpret our findings in light of well-documented biases and methodological pitfalls inherent to social-media-derived samples [47]. No new human-subjects data were collected for this study.
Data and Code Availability↩︎
The Twitter dataset used in this study is publicly available on IEEE DataPort [29]. The ReDSM5 annotation corpus is available from the original authors [28]. Analysis code, trained model checkpoints, per-label calibrated thresholds, and robustness-level outputs are available at https://github.com/rizwan2phd/dsm5-adhd-asd-twitter.
Acknowledgements & Funding↩︎
This research work has received funding from the European Union’s Horizon Europe research and innovation programme under the Marie Skłodowska-Curie COFUND Postdoctoral Programme, grant agreement No. (SMASH), and by the Republic of Slovenia and the European Union from the European Regional Development Fund. The authors also acknowledge the support of the Slovenian Research and Innovation Agency (ARIS) through the research programme P2-0442, Data Science and Digital Transformation.
Generative artificial intelligence (Claude, Anthropic) was used during manuscript preparation to assist with polishing the writing (copyediting for grammar, clarity, and consistency) and to provide coding assistance during development of the analysis pipeline. All AI-assisted text and code were reviewed, verified, and edited by the authors, who take full responsibility for the accuracy and integrity of the final manuscript and analysis.
Disclaimer↩︎
Co-funded by the European Union. Views and opinions expressed are however those of the author(s) only and do not necessarily reflect those of the European Union or European Research Executive Agency. Neither the European Union nor the granting authority can be held responsible for them.
Conflicts of Interest↩︎
The authors declare no conflicts of interest.
Abbreviations↩︎
ADHD: attention-deficit/hyperactivity disorder; ASD: autism spectrum disorder; AUC: area under the receiver operating characteristic curve; DSM-5: Diagnostic and Statistical Manual of Mental Disorders, 5th edition; NLI: natural language inference; NLP: natural language processing; ReDSM5: Reddit DSM-5 annotation corpus; ROC: receiver operating characteristic.
Supplementary Material↩︎
| Pre-filter thr. | \(n\) users | \(n\) ADHD | \(n\) ASD | Chosen \(C\) | Train acc. |
| (CV AUC mean \(\pm\) SD) | |||||
| 0.45 | 719 | 567 | 152 | 29.76 | 0.673 (0.645 \(\pm\) 0.041) |
| 0.50 | 710 | 560 | 150 | 78.48 | 0.681 (0.653 \(\pm\) 0.042) |
| 0.55 | 694 | 550 | 144 | 206.91 | 0.678 (0.646 \(\pm\) 0.045) |
| 0.60 | 679 | 538 | 141 | 206.91 | 0.681 (0.649 \(\pm\) 0.052) |
| 0.65 | 658 | 522 | 136 | 1.6238 | 0.675 (0.646 \(\pm\) 0.051) |
| Symptom pair | ADHD mean \(r\) | ADHD SD | ASD mean \(r\) | ASD SD | Cluster |
|---|---|---|---|---|---|
| Fatigue \(\times\) Sleep | \(+0.526\) | 0.023 | \(+0.517\) | 0.010 | Somatic |
| Fatigue \(\times\) Psychomotor | \(+0.360\) | 0.041 | \(+0.355\) | 0.047 | Somatic |
| Worthless \(\times\) Suicidal | \(+0.323\) | 0.025 | \(+0.300\) | 0.045 | Affective |
| Appetite \(\times\) Psychomotor | \(+0.297\) | 0.016 | \(+0.213\) | 0.051 | Somatic |
| Sleep \(\times\) Psychomotor | \(+0.263\) | 0.020 | \(+0.347\) | 0.032 | Somatic |
| Sleep \(\times\) Appetite | \(+0.189\) | 0.006 | \(+0.295\) | 0.029 | Somatic |
| Dep.Mood \(\times\) Appetite | \(-0.111\) | 0.010 | \(-0.221\) | 0.021 | Affective (trade-off) |
| Anhedonia \(\times\) Appetite | \(-0.154\) | 0.002 | \(-0.164\) | 0.020 | Affective (trade-off) |
| Anhedonia \(\times\) Sleep | \(-0.205\) | 0.018 | \(-0.198\) | 0.016 | Affective (trade-off) |
| Worthlessness \(\times\) Cognitive | \(-0.244\) | 0.045 | \(-0.194\) | 0.011 | Affective (trade-off) |
| Worthlessness \(\times\) Anhedonia | \(-0.255\) | 0.051 | \(-0.348\) | 0.080 | Affective (trade-off) |
| Dep.Mood \(\times\) Worthlessness | \(-0.309\) | 0.009 | \(-0.456\) | 0.008 | Affective (trade-off) |
| Suicidal \(\times\) Anhedonia | \(-0.321\) | 0.042 | \(-0.422\) | 0.044 | Affective (trade-off) |
| Dep.Mood \(\times\) Cognitive | \(-0.357\) | 0.026 | \(-0.352\) | 0.003 | Affective (trade-off) |
| Worthlessness \(\times\) Psychomotor | \(-0.438\) | 0.040 | \(-0.417\) | 0.045 | Affective (trade-off) |
| Worthlessness \(\times\) Fatigue | \(-0.462\) | 0.006 | \(-0.426\) | 0.037 | Affective (trade-off) |
| Worthlessness \(\times\) Sleep | \(-0.482\) | 0.005 | \(-0.447\) | 0.027 | Affective (trade-off) |
| Symptom pair | Mean \(r\) | SD | Range \(r\) | Sign-stable | Bootstrap-robust |
|---|---|---|---|---|---|
| TableS (continued) | |||||
| Symptom pair | Mean \(r\) | SD | Range \(r\) | Sign-stable | Bootstrap-robust |
| Fatigue \(\times\) Sleep | \(+0.526\) | 0.023 | 0.072 | Yes | Yes |
| Fatigue \(\times\) Psychomotor | \(+0.360\) | 0.041 | 0.112 | Yes | Yes |
| Worthless \(\times\) Suicidal | \(+0.323\) | 0.025 | 0.073 | Yes | Yes |
| Appetite \(\times\) Psychomotor | \(+0.297\) | 0.016 | 0.046 | Yes | Yes |
| Sleep \(\times\) Psychomotor | \(+0.263\) | 0.020 | 0.061 | Yes | Yes |
| Fatigue \(\times\) Appetite | \(+0.230\) | 0.027 | 0.078 | Yes | Yes |
| Anhedonia \(\times\) Cognitive | \(+0.194\) | 0.045 | 0.128 | Yes | Yes |
| Sleep \(\times\) Appetite | \(+0.189\) | 0.006 | 0.018 | Yes | Yes |
| Cognitive \(\times\) Psychomotor | \(+0.163\) | 0.033 | 0.089 | Yes | No |
| Fatigue \(\times\) Cognitive | \(+0.073\) | 0.040 | 0.114 | Yes | No |
| Dep.Mood \(\times\) Sleep | \(+0.069\) | 0.058 | 0.145 | No | No |
| Dep.Mood \(\times\) Fatigue | \(+0.026\) | 0.018 | 0.049 | No | No |
| Suicidal \(\times\) Appetite | \(-0.019\) | 0.010 | 0.031 | Yes | No |
| Dep.Mood \(\times\) Suicidal | \(-0.033\) | 0.013 | 0.037 | Yes | No |
| Sleep \(\times\) Cognitive | \(-0.046\) | 0.019 | 0.051 | Yes | No |
| Anhedonia \(\times\) Psychomotor | \(-0.079\) | 0.012 | 0.026 | Yes | No |
| Dep.Mood \(\times\) Psychomotor | \(-0.080\) | 0.047 | 0.132 | Yes | No |
| Dep.Mood \(\times\) Appetite | \(-0.111\) | 0.010 | 0.027 | Yes | Yes |
| Cognitive \(\times\) Appetite | \(-0.130\) | 0.023 | 0.059 | Yes | No |
| Suicidal \(\times\) Sleep | \(-0.135\) | 0.011 | 0.032 | Yes | Yes |
| Anhedonia \(\times\) Appetite | \(-0.154\) | 0.002 | 0.004 | Yes | Yes |
| Suicidal \(\times\) Fatigue | \(-0.167\) | 0.022 | 0.065 | Yes | Yes |
| Worthless \(\times\) Appetite | \(-0.188\) | 0.019 | 0.049 | Yes | Yes |
| Anhedonia \(\times\) Sleep | \(-0.205\) | 0.018 | 0.048 | Yes | Yes |
| Fatigue \(\times\) Anhedonia | \(-0.214\) | 0.017 | 0.041 | Yes | Yes |
| Worthless \(\times\) Cognitive | \(-0.244\) | 0.045 | 0.127 | Yes | Yes |
| Suicidal \(\times\) Psychomotor | \(-0.255\) | 0.023 | 0.064 | Yes | Yes |
| Worthless \(\times\) Anhedonia | \(-0.255\) | 0.051 | 0.147 | Yes | Yes |
| Suicidal \(\times\) Cognitive | \(-0.290\) | 0.017 | 0.044 | Yes | Yes |
| Dep.Mood \(\times\) Worthless | \(-0.309\) | 0.009 | 0.027 | Yes | Yes |
| Suicidal \(\times\) Anhedonia | \(-0.321\) | 0.042 | 0.118 | Yes | Yes |
| Dep.Mood \(\times\) Cognitive | \(-0.357\) | 0.026 | 0.070 | Yes | Yes |
| Worthless \(\times\) Psychomotor | \(-0.438\) | 0.040 | 0.110 | Yes | Yes |
| Dep.Mood \(\times\) Anhedonia | \(-0.438\) | 0.024 | 0.072 | Yes | Yes |
| Worthless \(\times\) Fatigue | \(-0.462\) | 0.006 | 0.014 | Yes | Yes |
| Worthless \(\times\) Sleep | \(-0.482\) | 0.005 | 0.012 | Yes | Yes |
| Symptom pair | Mean \(r\) | SD | Range \(r\) | Sign-stable | Bootstrap-robust |
|---|---|---|---|---|---|
| TableS (continued) | |||||
| Symptom pair | Mean \(r\) | SD | Range \(r\) | Sign-stable | Bootstrap-robust |
| Fatigue \(\times\) Sleep | \(+0.517\) | 0.010 | 0.026 | Yes | Yes |
| Fatigue \(\times\) Psychomotor | \(+0.355\) | 0.047 | 0.117 | Yes | Yes |
| Sleep \(\times\) Psychomotor | \(+0.347\) | 0.032 | 0.080 | Yes | Yes |
| Fatigue \(\times\) Cognitive | \(+0.309\) | 0.046 | 0.133 | Yes | Yes |
| Worthless \(\times\) Suicidal | \(+0.300\) | 0.045 | 0.108 | Yes | Yes |
| Sleep \(\times\) Appetite | \(+0.295\) | 0.029 | 0.086 | Yes | Yes |
| Appetite \(\times\) Psychomotor | \(+0.213\) | 0.051 | 0.150 | Yes | Yes |
| Cognitive \(\times\) Psychomotor | \(+0.204\) | 0.034 | 0.093 | Yes | Yes |
| Fatigue \(\times\) Appetite | \(+0.162\) | 0.023 | 0.058 | Yes | No |
| Sleep \(\times\) Cognitive | \(+0.107\) | 0.049 | 0.150 | Yes | No |
| Anhedonia \(\times\) Cognitive | \(+0.103\) | 0.052 | 0.152 | Yes | No |
| Suicidal \(\times\) Appetite | \(+0.100\) | 0.010 | 0.025 | Yes | No |
| Dep.Mood \(\times\) Sleep | \(+0.052\) | 0.032 | 0.077 | Yes | No |
| Suicidal \(\times\) Sleep | \(+0.023\) | 0.037 | 0.099 | No | No |
| Cognitive \(\times\) Appetite | \(-0.022\) | 0.029 | 0.085 | No | No |
| Dep.Mood \(\times\) Fatigue | \(-0.049\) | 0.063 | 0.163 | No | No |
| Anhedonia \(\times\) Psychomotor | \(-0.049\) | 0.046 | 0.118 | No | No |
| Worthless \(\times\) Appetite | \(-0.056\) | 0.054 | 0.151 | No | No |
| Suicidal \(\times\) Fatigue | \(-0.079\) | 0.028 | 0.084 | Yes | No |
| Fatigue \(\times\) Anhedonia | \(-0.084\) | 0.024 | 0.069 | Yes | No |
| Dep.Mood \(\times\) Psychomotor | \(-0.085\) | 0.039 | 0.111 | Yes | No |
| Suicidal \(\times\) Psychomotor | \(-0.138\) | 0.059 | 0.164 | Yes | No |
| Anhedonia \(\times\) Appetite | \(-0.164\) | 0.020 | 0.055 | Yes | Yes |
| Dep.Mood \(\times\) Suicidal | \(-0.183\) | 0.019 | 0.059 | Yes | No |
| Suicidal \(\times\) Cognitive | \(-0.192\) | 0.023 | 0.052 | Yes | No |
| Worthless \(\times\) Cognitive | \(-0.194\) | 0.011 | 0.033 | Yes | Yes |
| Anhedonia \(\times\) Sleep | \(-0.198\) | 0.016 | 0.037 | Yes | Yes |
| Dep.Mood \(\times\) Appetite | \(-0.221\) | 0.021 | 0.060 | Yes | Yes |
| Dep.Mood \(\times\) Anhedonia | \(-0.258\) | 0.052 | 0.157 | Yes | Yes |
| Worthless \(\times\) Anhedonia | \(-0.348\) | 0.080 | 0.221 | Yes | Yes |
| Dep.Mood \(\times\) Cognitive | \(-0.352\) | 0.003 | 0.008 | Yes | Yes |
| Worthless \(\times\) Psychomotor | \(-0.417\) | 0.045 | 0.130 | Yes | Yes |
| Suicidal \(\times\) Anhedonia | \(-0.422\) | 0.044 | 0.114 | Yes | Yes |
| Worthless \(\times\) Fatigue | \(-0.426\) | 0.037 | 0.092 | Yes | Yes |
| Worthless \(\times\) Sleep | \(-0.447\) | 0.027 | 0.075 | Yes | Yes |
| Dep.Mood \(\times\) Worthless | \(-0.456\) | 0.008 | 0.022 | Yes | Yes |
| Sample Tweet (Paraphrased) & Disorder | NLI | Dep.Mood | Worth. | Suic. | Fatigue | Anhed. | Sleep | Cog. | Appet. | Psych. |
|---|---|---|---|---|---|---|---|---|---|---|
| One last attempt before I call it a night. (ADHD) | 0.740 | 0.008 | 0.505 | 0.092 | 0.002 | 0.002 | 0.535 | 0.003 | 0.002 | 0.002 |
| I completely agree—people acting so selfishly is incredibly frustrating. (ASD) | 0.736 | 0.899 | 0.861 | 0.003 | 0.001 | 0.006 | 0.001 | 0.001 | 0.001 | 0.001 |
| I’d never want to handle a gun—they honestly make me feel uneasy. (ASD) | 0.639 | 0.043 | 0.021 | 0.811 | 0.000 | 0.014 | 0.001 | 0.005 | 0.001 | 0.040 |
| That’s probably the most exciting thing that’s happened to me in a while. (ADHD) | 0.600 | 0.446 | 0.002 | 0.001 | 0.007 | 0.977 | 0.002 | 0.006 | 0.001 | 0.007 |
| You’re one step closer now—keep going! (ADHD) | 0.545 | 0.017 | 0.176 | 0.027 | 0.031 | 0.026 | 0.001 | 0.012 | 0.001 | 0.004 |
| U01 | U02 | U03 | ||||
| Symptom | Mean | Centered | Mean | Centered | Mean | Centered |
| Depressed Mood | 0.339 | \(+0.225\) | 0.166 | \(+0.021\) | 0.240 | \(+0.127\) |
| Worthlessness | 0.167 | \(+0.052\) | 0.344 | \(+0.199\) | 0.297 | \(+0.184\) |
| Suicidal Thoughts | 0.011 | \(-0.103\) | 0.003 | \(-0.142\) | 0.063 | \(-0.049\) |
| Fatigue | 0.039 | \(-0.076\) | 0.037 | \(-0.108\) | 0.049 | \(-0.063\) |
| Anhedonia | 0.231 | \(+0.116\) | 0.470 | \(+0.324\) | 0.216 | \(+0.104\) |
| Sleep Issues | 0.057 | \(-0.057\) | 0.005 | \(-0.141\) | 0.027 | \(-0.086\) |
| Cognitive Issues | 0.093 | \(-0.022\) | 0.256 | \(+0.110\) | 0.035 | \(-0.078\) |
| Appetite Change | 0.020 | \(-0.094\) | 0.003 | \(-0.143\) | 0.022 | \(-0.090\) |
| Psychomotor | 0.073 | \(-0.041\) | 0.026 | \(-0.120\) | 0.065 | \(-0.047\) |
| Thr. | Tweets after | After symptom- | Users after | Users retained | Tweets after | ADHD / ASD |
| Stage 1 filter | score gate | symptom gate | after min gate (\(\geq\)30) | min gate | Users | |
| 0.45 | 579,569 | 449,045 | 792 | 719 | 447,766 | 567 / 152 |
| 0.50 | 474,415 | 369,300 | 792 | 710 | 368,011 | 560 / 150 |
| 0.55 | 373,667 | 292,916 | 792 | 694 | 291,494 | 550 / 144 |
| 0.60 | 280,328 | 222,099 | 792 | 679 | 220,643 | 538 / 141 |
| 0.65 | 197,213 | 158,136 | 790 | 658 | 156,601 | 522 / 136 |