Catalyst Papers in Artificial Intelligence Research:
A Landscape on ICLR from 2017 to 2025
May 24, 2026
Abstract
A small number of methodological contributions, including word2vec, the Transformer, large-scale pre-training, and reinforcement learning from human feedback, have reshaped NLP and AI research over the past decade. OpenReview now makes numeric reviewer scores and accept/reject decisions public for every ICLR submission. Whether such review signals identify trajectory-changing papers at submission time, however, remains untested at corpus scale. We answer this question on \(36{,}113\) papers from ICLR 2017–2025, identifying catalysts: papers whose descendants measurably redirect future research. We compare four disruptiveness measures (the Consolidation/Destabilization (CD) index, node2vec, the direction-aware Embedding Disruptiveness Measure (EDM), and an LLM-based semantic rater) and define a five-type operational catalyst taxonomy (topic initiator, topic bridge, within-topic redirector, simultaneous, and recognition-misaligned). EDM leads at identifying highly cited ICLR papers (AUC \(0.83\) vs.\(0.60\) for CD, \(0.49\) for node2vec, and \(0.42\) for the LLM rater). Topic initiators precede a \(7.55{\times}\) topic-share growth and topic bridges precede an \(11.52{\times}\) growth in cross-topic citation flow versus year-matched controls. We found that the peer review scores are essentially orthogonal to future disruptiveness (\(|\rho|{\leq}0.005\); accepted and rejected papers have indistinguishable mean EDM, \(p{=}0.11\)).
1 Introduction↩︎
A small number of methodological contributions, including word2vec [1], the Transformer architecture [2], large-scale pre-training [3], [4], and reinforcement learning from human feedback [5], have reshaped NLP and AI research over the past decade. OpenReview makes per-paper reviewer scores and accept/reject decisions publicly available for every submission to the International Conference on Learning Representations (ICLR) [6]. Identifying which submissions later redirect research trajectories has become a central question in the science of science [7]–[9]; estimating this potential at submission time, however, remains difficult.
The CD index [10] captures only one-hop citation displacement and clusters near zero on sparse networks [11], [12]; whether recent embedding- or content-based alternatives [12], [13], combined with peer-review signals, can identify submissions that later reorient a sub-field remains open.
Prior work has progressed along two largely separate lines. The bibliometric line introduced the Consolidation/Destabilization (CD) index [10], reported a multi-decade decline in disruptiveness [7], linked team size and atypical combinations to impact [8], [14], used citation-structure features to anticipate impact [15], and recently proposed the Embedding Disruptiveness Measure (EDM), a direction-aware alternative that is more robust to sparse networks [12]. The peer-review line has documented status effects [16], [17], novelty penalties [18], and reviewer inconsistency at ML venues [19].
The two lines have rarely been joined: journal corpora (Web of Science, APS) do not include per-paper reviewer scores [7], [12], [15], while conference-side work has not connected reviewer signals to long-run trajectory change [19]. Prior work has examined the relationship between ML-conference review scores and raw citation outcomes [20], but has not extended this to direction-aware, multi-generational trajectory measures. Whether submission-time review signals predict long-run trajectory change at a major ML venue therefore remains open.
We define a catalyst paper as a submission whose descendants measurably redirect later research. We address this gap with three connected research questions on the nine-year ICLR record (2017–2025). RQ1 (Measurement) asks which operationalization best identifies catalyst papers: topology-based metrics [10], generic graph embeddings [21], the directional citation embedding EDM [12], or an LLM-based semantic rater. RQ2 (Mechanisms) asks through what mechanisms catalyst papers reshape ICLR research, considering topic initiation, topic bridging, within-topic redirection, and simultaneous discovery. RQ3 (Recognition) asks whether submission-time reviewer signals track future trajectory change, and where the residual miscalibration concentrates.
This paper makes four contributions: (i) a formal five-type catalyst taxonomy; (ii) a head-to-head comparison of four disruptiveness measures on a common ICLR corpus; (iii) year-matched evidence that catalyst types precede subsequent topic-share growth and cross-topic citation-flow changes; and (iv) the first analysis pairing per-paper OpenReview signals with direction-aware, multi-generational trajectory measures (EDM), finding \(|\rho| \leq 0.005\) between reviewer scores and EDM and a percentile gap structured by catalyst type and by topic.
2 Related Work↩︎
2.0.0.1 Disruption measures.
The Consolidation/Destabilization (CD) index [10] flags a paper as disruptive when later citers ignore its references and has anchored arguments about a multi-decade decline in disruptiveness [7]. Critiques show CD to be bimodally degenerate on sparse networks, blind to multi-generational influence [12], and biased by citation inflation [11]. The Embedding Disruptiveness Measure (EDM) of [12] addresses these limitations via direction-aware random walks and outperforms CD on milestone-paper identification in Web of Science and APS. Content-side alternatives such as SPECTER and SciRepEval [13], [22] motivate the LLM-rater family.
2.0.0.2 Science of science in NLP and ML.
Most empirical work in the science of science [9], [14], [15] derives from journal corpora with multi-decade timescales and private peer review, often analyzed through Web of Science or OpenAlex [23]. The NLP and ML conference setting differs: arXiv-mediated diffusion compresses idea propagation to months, OpenReview makes per-paper reviewer scores public for every submission, and rejected papers often persist via preprint servers [6].
2.0.0.3 Peer review and recognition.
Status biases [16], [17] and novelty penalties [18] are well documented in journal peer review. At ML and NLP venues, the NeurIPS consistency experiment found a \(25.9\%\) rate of inconsistent accept/reject decisions across two independent committees reviewing the same \(166\) submissions [19]; an ICLR-specific analysis of the 2017–2020 window paired OpenReview scores with Semantic Scholar citation impact and reported only weak score–citation correlation across both accepted and rejected submissions [20].
3 Data↩︎
Our corpus is the ICLR submission record 2017–2025 from the berenslab/iclr-dataset [6], containing \(36{,}113\) papers across nine years with OpenReview identifiers, titles, abstracts, authors, acceptance decisions, and integer reviewer scores (1–10). Submissions grow from \(489\) (2017) to
\(11{,}663\) (2025); accept rates are stable at \(26\)–\(33\%\). Per-year counts are reported in Table 5 (Appendix 10). For each paper we derive per-paper review summaries (mean \(\bar{s}\), variance \(\sigma^2_s\), number of reviewers \(n_r\)); papers with no recorded scores are excluded from peer-review analyses.
3.0.0.1 Citation network.
We construct a directed citation graph \(G=(V,E)\) over the 36,113 ICLR papers. We match each paper to a Semantic Scholar (S2) record via title-based fuzzy matching (RapidFuzz token-set ratio \(\geq 0.85\), year tolerance \(\pm 2\)) and retrieve reference lists through the S2 Graph API, keeping only ICLR-internal edges. We use S2 rather than OpenAlex because S2 indexes arXiv preprints directly, giving more complete coverage of ML and NLP submissions. We match \(27{,}843\) papers (\(77.1\%\)); unmatched submissions are concentrated among rejected papers that were never reposted to arXiv.
4 Methods↩︎
4.1 Catalyst Taxonomy↩︎
We define a catalyst paper as one whose descendants measurably reshape the topic or citation structure of subsequent research. Catalyst status sits within the broader empirical tradition of identifying high-impact papers in citation networks [8], [14], [15]. As a further operational investigation of the disruptive paper concept [10], [12], we operationalize catalyst status as a multi-label family of five threshold-defined mechanism types, computed over the ICLR-internal citation graph and topic assignments from Section 4.3.
4.1.0.1 Topic Initiator (TI).
A new topic cluster appears, or an existing one grows at an accelerated rate, in the following 1–3 years; this parallels sub-field-birth events studied in [12], [14]. Let \(\text{share}(T, y)\) be the fraction of ICLR papers in year \(y\) assigned to topic \(T\), and define \[\begin{align} \bar{s}^{\text{pre}}_i &= \tfrac{1}{2}\!\sum_{y=y_i-2}^{y_i-1} \text{share}(T_i, y), \\ \bar{s}^{\text{post}}_i &= \tfrac{1}{3}\!\sum_{y=y_i+1}^{y_i+3} \text{share}(T_i, y). \end{align}\] Paper \(i\) is a TI if \(\bar{s}^{\text{post}}_i / \bar{s}^{\text{pre}}_i \geq 2.0\).
4.1.0.2 Topic Bridge (TB).
The paper is followed by a measurable increase in cross-topic citation flow between previously weakly connected clusters, analogous to brokerage across structural holes [24] and to the atypical-combination mechanism behind high-impact work [14]. Let \(F_i\) be the cross-topic citation flow attributed to paper \(i\)’s topic cluster in its publication year, and \(D_i\) the number of distinct topic clusters reached by \(i\)’s citation descendants within two years. Paper \(i\) is a TB if \(F_i\) falls in the top \(10\%\) of the cross-topic flow distribution and \(D_i \geq 2\).
4.1.0.3 Within-Topic Redirector (WR).
The topic label is preserved, but the embedding centroid of the topic’s subsequent papers shifts substantially. WR is the within-field analog of the CD-index notion of disruption [10], but uses direction-aware embeddings to avoid the sparse-network and citation-inflation biases of CD [11], [12]. Let \(\mathbf{c}(T, y)\) be the mean embedding of papers in topic \(T\) at year \(y\); the centroid shift induced by paper \(i\) is \(\|\mathbf{c}(T_i, y_i) - \mathbf{c}(T_i, y_i-1)\|\), \(z\)-scored within \(T_i\). Paper \(i\) is a WR if this \(z\)-score exceeds the cluster-conditional median.
4.1.0.4 Simultaneous Catalyst (SC).
The future-vector neighborhood clusters with contemporaneous papers, with no single paper claiming the breakthrough. SC operationalizes the multiple-discovery phenomenon documented since [25] and detected via citation embeddings by [12]; the full identification procedure and empirical results are in Section 6.2.
4.1.0.5 Recognition-Misaligned (RM).
High retrospective \(\Delta\) paired with weak, borderline, or contested submission-time review signals. RM captures a submission-stage analog of the sleeping-beauty phenomenon [26], consistent with novelty penalties in peer review [18] and the only weak score-to-citation correlation reported at ICLR [20]. Paper \(i\) is an RM if (i) \(\Delta_i\) is at or above the 90th percentile of the full-corpus EDM distribution (\(\Delta\geq 0.899\)); and (ii) its reviewer mean score \(\bar{s}_i\) is at or below the year-conditional acceptance boundary minus \(0.5\) points, or its reviewer score variance \(\sigma^2_{s,i}\) places it in the “controversial” category. In practice, \(83.7\%\) of RM papers were rejected at ICLR.
4.1.0.6 Why these five types.
A single disruptiveness scalar collapses qualitatively distinct mechanisms into one number; recent work has shown such scalars to be bimodally degenerate, citation-inflation biased, and blind to multi-generational structure [11], [12]. The science-of-science literature has correspondingly identified multiple distinct routes to high impact rather than a single one, including small-team disruption versus large-team development [8] and the combination of conventional with atypical references [14]. Our five-type taxonomy operationalizes this mechanism plurality: sub-field birth (TI), brokerage (TB), within-field reshaping (WR), simultaneous breakthroughs (SC), and review-signal misalignment (RM) each map to a separate literature above and apply as multi-label rather than mutually exclusive categories. The threshold-based definitions are also venue-portable, supporting comparisons with other ML and NLP corpora where existing review-impact analyses have so far been restricted to a single venue at a time [19], [20].
4.2 Measuring Disruptiveness↩︎
We compare four disruptiveness measures on the hypothesis that topology, graph embeddings, and LLMs access distinct information channels.
4.2.0.1 (M1) CD index.
The disruption index \(D_i = (n_f - n_b)/(n_f + n_b + n_k)\) of [10], where \(n_f, n_b, n_k\) are the standard citation neighborhood counts.
4.2.0.2 (M2) Generic graph embedding: node2vec.
Undirected node2vec [21] on \(G\) with the same hyperparameters as EDM (\(T{=}160\), \(R{=}80\), \(d{=}100\), \(c{=}5\)). The score \(\text{M2}_i\) is cosine distance between the mean reference and mean citer embeddings of paper \(i\).
4.2.0.3 (M3) Directional citation embedding: EDM.
Following [12], we learn a past vector \(\mathbf{p}_i\) and future vector \(\mathbf{f}_i\) for each paper \(i\) from direction-aware random walks trained with single-side skip-gram context. The score is \[\Delta_i = 1 - \frac{\mathbf{f}_i \cdot \mathbf{p}_i}{|\mathbf{f}_i|\,|\mathbf{p}_i|} \label{eq:edm}\tag{1}\] We use the canonical hyperparameters \(T{=}160\), \(R{=}80\), \(d{=}100\), \(c{=}5\), \(\kappa^{\text{in}}_u\) in-degree weighting. The training objective, full equations, and a 1-D parameter sweep showing ERS AUC is stable in \([0.72,0.76]\) across \(T \in \{80,160,240\}\) and \(d \in \{64,100,128\}\) are in Appendices 11 and 12.
4.2.0.4 (M4) LLM rater.
For each paper, we prompt gpt-4o-mini [27] with the paper’s title and abstract and request a single integer
disruption-potential score on a \(0\)–\(10\) scale, with no other text. Scoring is zero-shot (no fine-tuning) and deterministic (\(\tau{=}0\)); M4 covers the
full \(36{,}113\)-paper corpus. The rubric distinguishes disruption from paper quality, novelty, and citation count (full prompt in Appendix 13). M4 sees only paper content (title and
abstract); it never reads the citation graph or reviewer scores.
4.3 Topic Modeling and Validation Sets↩︎
4.3.0.1 Topics.
We embed each paper’s title [SEP] abstract via OpenAI text-embedding-3-large [28] at \(1{,}024\) dimensions, project to 50-D with UMAP [29], and cluster with HDBSCAN [30] (\(\text{min\_cluster\_size}{=}50\)). This yields 113 topic clusters (12,102 noise papers; \(33.5\%\)). Hyperparameters and the topic-share \(\text{share}(T,y)\) formula are in Appendix 11.
4.3.0.2 Validation sets.
We evaluate each measure against four signals. (1) External Recognition Set (ERS), the top \(2\%\) by ICLR-internal citation count (\(n{=}739\) positives), capturing structural
recognition by the field. (2) LLM-judge Annotation Set (LAS), a stratified random sample of \(50\) papers labeled by two independent runs of an LLM judge (claude-opus-4-6) over title and abstract (union of
positive labels: \(9\) positives, \(41\) negatives; run-to-run agreement \(\kappa{=}0.291\); Appendix 15). LAS measures
cross-model semantic-rubric agreement, not agreement with human expert judgment. (3) Citation velocity, the Spearman correlation between each measure and citations per year since publication. (4) Twenty-seven ICLR Best Paper winners (2021–2025) used as
qualitative case studies. We report ROC-AUC and odds ratios from Firth’s penalized logistic regression [31] per \(10\)-percentile increase. The citation-count baseline is excluded from ERS because it is definitionally circular. Details and stratification design are in Appendix 14.
5 RQ1: Measuring Catalyst Papers↩︎
![Figure 1: Disruptiveness distributions across 36{,}113 ICLR papers. (a) EDM is smooth and near-Gaussian (\bar{\Delta}{=}0.76, std 0.11, range [0.44,1.18]). (b) CD is bimodally degenerate, with scores concentrated near 0 and near 1. (c) EDM distributions are nearly identical for accepted and rejected papers.](/article/2607.05401/figures/fig1_distribution.png "fig:")
To compare measure coverage and distribution shape on the ICLR corpus, we apply CD, node2vec, EDM, and the LLM rater to all \(36{,}113\) papers and inspect the per-measure distributions (Fig. 1). EDM produces a smooth, near-Gaussian distribution and covers \(22{,}302\) papers (\(62\%\)); CD covers \(35\%\) and is bimodally degenerate (Fig. 1b); node2vec covers \(18\%\); the LLM rater (M4) covers the full corpus. Among the eight ICLR 2024–2025 Best Paper winners, only one receives a CD score while all receive EDM and LLM scores, and the temporal trend of \(\Delta\) is essentially flat across 2017–2025 (year-wise mean ranges from \(0.747\) in 2024 to \(0.823\) in 2017; year-wise std stays within \([0.101, 0.125]\)). The CD bimodality reflects the sparsity of the ICLR-internal citation network relative to the Web of Science and APS networks used in prior work [7], [10], [12], and the flat EDM trend does not reproduce the monotonic decline reported by [7] for broad science. Extended analysis and the yearly trend figure are in Appendix 16.
5.1 Validation Against Benchmark Sets↩︎
| Measure | LAS AUC | ERS AUC |
|---|---|---|
| M1: CD Index | 0.566 | 0.596 |
| M2: node2vec | 0.276 | 0.493 |
| M3: EDM | 0.496 | 0.827 |
| M4: LLM | 0.749 | 0.424 |
| Citations (baseline) | 0.526 | / |
| Measure | Set | OR | 95% CI | \(p\) |
|---|---|---|---|---|
| M3: EDM | ERS | 1.744 | [1.671, 1.821] | \(<0.001\) |
| M1: CD Index | ERS | 1.156 | [1.121, 1.192] | \(<0.001\) |
| M4: LLM | ERS | 0.901 | [0.876, 0.926] | \(<0.001\) |
| M2: node2vec | ERS | 0.991 | [0.956, 1.028] | \(0.63\) |
| M4: LLM | LAS | 1.414 | [1.041, 1.920] | \(0.027\) |
| M1: CD Index | LAS | 1.078 | [0.837, 1.390] | \(0.56\) |
| Citations | LAS | 1.029 | [0.806, 1.314] | \(0.82\) |
| M3: EDM | LAS | 0.996 | [0.761, 1.304] | \(0.98\) |
| M2: node2vec | LAS | 0.779 | [0.530, 1.145] | \(0.20\) |
We evaluate each disruptiveness measure on two validation signals, the External Recognition Set (ERS, top \(2\%\) by ICLR-internal citation count) and the LLM-judge Annotation Set (LAS), reporting ROC-AUC and
Firth-regression odds ratios (Tables 1, 2). EDM achieves ERS AUC \(0.827\) versus \(0.596\) for CD and \(0.493\) for node2vec, with each \(10\)-percentile increase in EDM multiplying the odds of top-cited membership by \(1.74\) (versus \(1.16\) for CD), while node2vec is statistically indistinguishable from random (\(p{=}0.63\)). M4 (LLM) shows the inverse pattern, leading on LAS (AUC \(0.749\),
OR \(1.41\), \(p{=}0.03\)) but performing below chance on ERS (\(0.424\)). The contrast between M2 and M3 isolates direction-aware walk training as the
salient methodological ingredient on the structural side; since LAS labels come from an independent LLM judge (claude-opus-4-6), M4’s LAS lead measures cross-model agreement on the same semantic rubric, not validation against expert judgment.
EDM and the LLM rater are near-orthogonal on both validation signals.
5.1.0.1 NLP-subset replication.
Restricting the analysis to NLP- and language-modeling topic clusters (\(11{,}255\) papers across \(55\) clusters covering language modeling, embeddings, and vision-language work) yields an EDM ERS AUC of \(0.860\), compared with \(0.827\) on the full corpus; CD AUC drops to \(0.597\) and node2vec to \(0.499\). The RQ1 and RQ3 conclusions therefore appear to hold on the NLP-focused subset (Appendix 16).
To probe complementarity beyond AUC, we compute citation velocity (the Spearman correlation between each measure and citations per year since publication) and examine the ICLR 2021–2025 Best Paper winners as case studies. Citation velocity is consistent with the ERS ranking: EDM \(\rho{=}{+}0.300\), CD \(\rho{=}{+}0.127\), node2vec \(\rho{=}{-}0.293\), LLM \(\rho{=}{+}0.016\) (ns). The case studies expose two complementary blind spots: EDM tends to under-rank canonical follow-ups (for example, Score-Based SDE at the \(26.4\)th percentile and Analytic-DPM at the \(8.4\)th), whose descendants remain close to their antecedents, while the LLM rater saturates at the top of its scale, assigning \(7/10\) (the \(83.8\)th percentile) to most Best Paper winners and \(6/10\) or below to the rest. Structural and semantic measures therefore appear to tap different signals, each with its own failure mode. Detailed case studies, correlation heatmaps, and scatter plots of divergent papers are in Appendix 16.
| Model pair | Spearman \(\rho\) | Quad.\(\kappa\) |
|---|---|---|
| gpt-4o-mini vs.gpt-4o | 0.71 | 0.48 |
| gpt-4o-mini vs.claude-sonnet-4-6 | 0.56 | 0.23 |
| gpt-4o-mini vs.llama-3.3 | 0.68 | 0.29 |
| gpt-4o-mini vs.qwen-2.5 | 0.55 | 0.34 |
| gpt-4o vs.claude-sonnet-4-6 | 0.63 | 0.52 |
| gpt-4o vs.llama-3.3 | 0.72 | 0.16 |
| gpt-4o vs.qwen-2.5 | 0.57 | 0.16 |
| claude-sonnet-4-6 vs.llama-3.3 | 0.56 | 0.07 |
| claude-sonnet-4-6 vs.qwen-2.5 | 0.46 | 0.07 |
| llama-3.3 vs.qwen-2.5 | 0.54 | 0.45 |
| Mean | 0.60 | 0.28 |
4pt
EDM is the strongest single signal (AUC \(0.83\) vs.\(0.60/0.49/0.42\) for CD/node2vec/LLM); its blind spots complement the LLM rater’s.
6 RQ2: Mechanisms of Trajectory Change↩︎
6.0.0.1 Topics and catalyst counts.
HDBSCAN over the \(50\)-dimensional UMAP of text embeddings yields \(113\) topic clusters covering \(66.5\%\) of papers (the largest \(10\) clusters table and full list are in Appendix 17). The four operational catalyst types are not mutually exclusive: TI \(=3{,}063\) (\(8.5\%\)), TB \(=3{,}539\) (\(9.8\%\)), WR \(=2{,}562\) (\(7.1\%\)), and RM \(=1{,}119\) (\(3.1\%\)), with a union of \(8{,}015\) papers (\(22.2\%\)). The co-occurrence structure itself is informative: \(26.4\%\) of TI papers are also WR, \(36.6\%\) of RM papers are also TB (reviewer calibration appears weakest on bridges), but only \(3.7\%\) of TI papers are RM. Operational thresholds and the full \(4{\times}4\) co-occurrence matrix are in Appendix 17.
6.1 Topic Dynamics Driven by Catalyst Papers↩︎
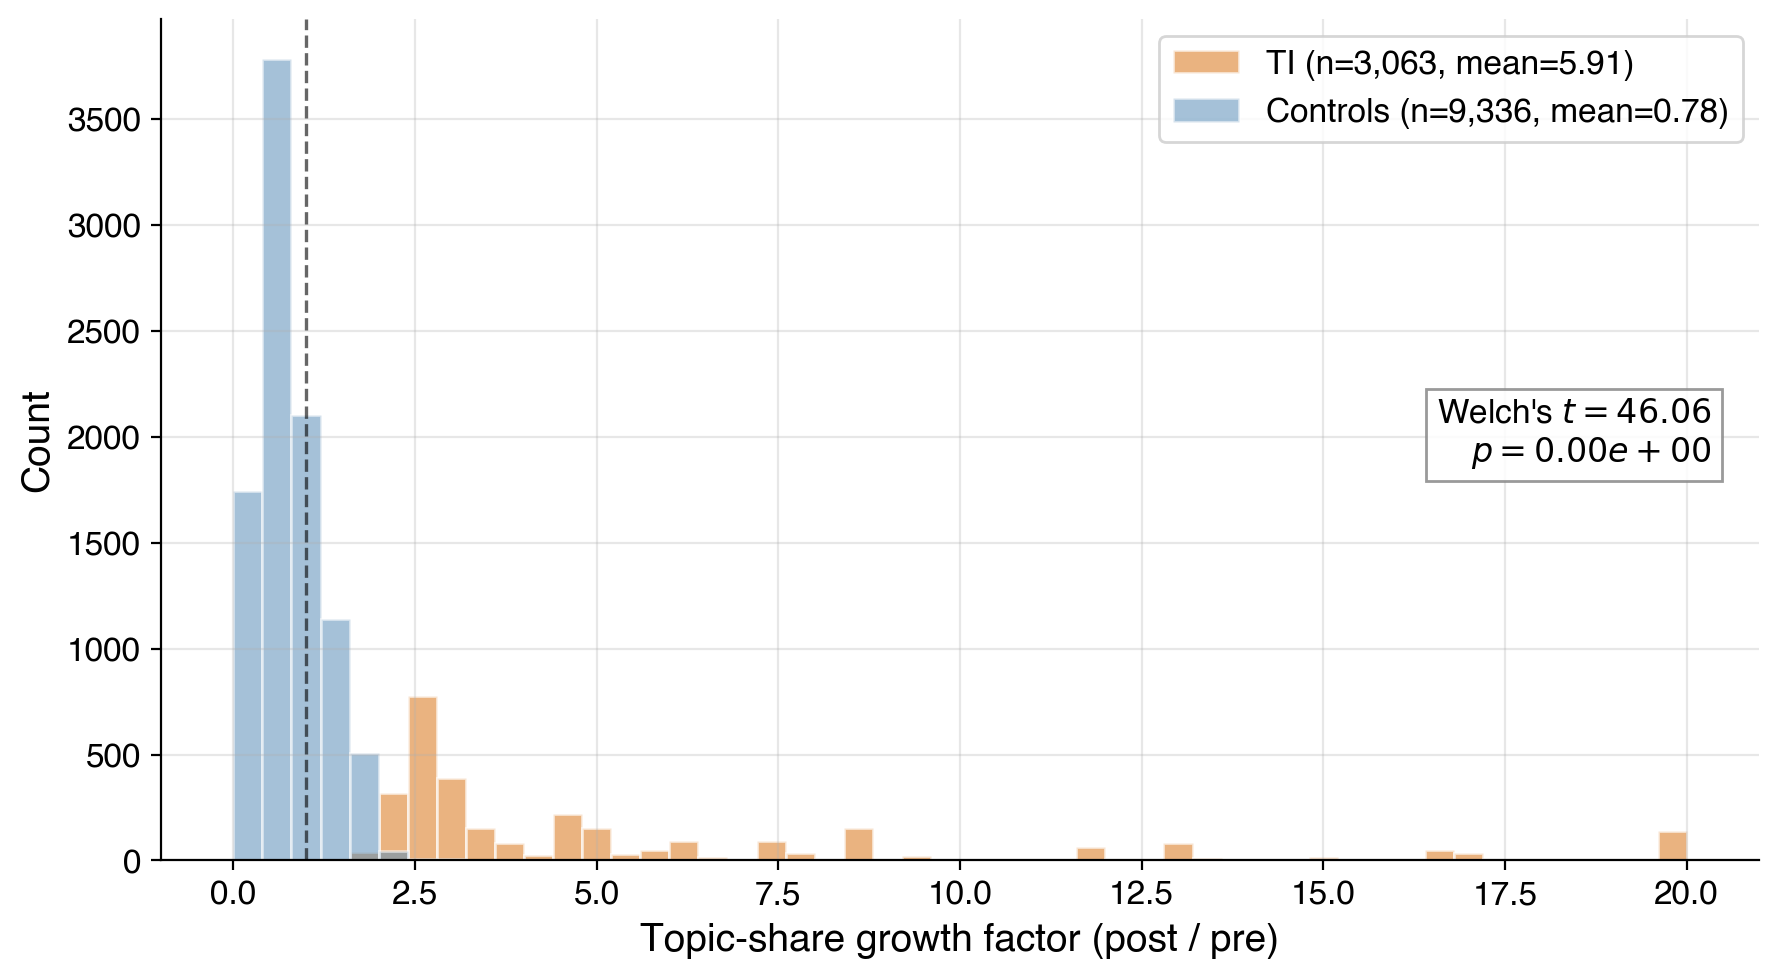
To estimate the topic-dynamic effect of TI papers we compare each TI paper’s topic-share trajectory to a year-matched control of up to 5 non-TI papers in different topic clusters (holding cohort effects constant); for TB papers we compute the change in cross-topic citation flow into their cluster over the \(\pm 2 / +3\)-year window. TI papers precede topic-share growth at \(7.55\times\) the rate of matched controls (Table 9; Welch \(t{=}46.06\), \(p{<}10^{-300}\)); for TB papers, the mean cross-topic citation flow into their cluster grows from \(242.3\) to \(848.5\) edges per year, an \(11.52\times\) mean multiplicative increase (median \(4.36\times\); IQR \([2.58, 9.34]\); \(n{=}3{,}228\)). Propensity matching on log-citation count, acceptance, and year (1-NN, caliper \(0.05\); \(n{=}3{,}063\) matched) reduces the TI ratio to \(6.31\times\) (Welch \(t = 44.0\), \(p < 10^{-300}\); Appendix 17); the \(16\%\) drop from \(7.55\times\) to \(6.31\times\) quantifies the citation-count confound, leaving a large and significant residual. In effect-size terms TB is the largest catalyst mechanism observed in the corpus, suggesting that bridging papers warrant at least as much attention as topic-initiating ones. The full TB flow table, distribution figure for TI versus controls, and cross-topic flow heatmap are in Appendix 17.
6.2 Simultaneous Discoveries and Cross-Domain Diffusion↩︎
To identify simultaneous catalysts, we follow [12] and select same-year, no-author-overlap pairs with future-vector cosine \(\geq 0.9\), then filter for descendant support (\(\geq 3\) ICLR-internal citations) and valid topic clusters; a citation-graph ground-truth check uses co-citation overlap \(\geq 0.20\) together with the absence of a direct edge. The \(483{,}809\)-pair raw pool collapses to \(162\) candidates after filtering, of which only \(4\) (\(2.5\%\)) are same-topic pairs; the ground-truth check confirms \(76.25\%\) precision at top-80 but reports only \(0.20\%\) prevalence in the raw pool. Simultaneous discoveries therefore appear substantially rarer in AI than in the physics setting of [12], consistent with arXiv preprint culture compressing parallel discoveries into sequential citation chains. Filtering funnel, threshold sensitivity, and the one confirmed same-topic pair are in Appendix 17.
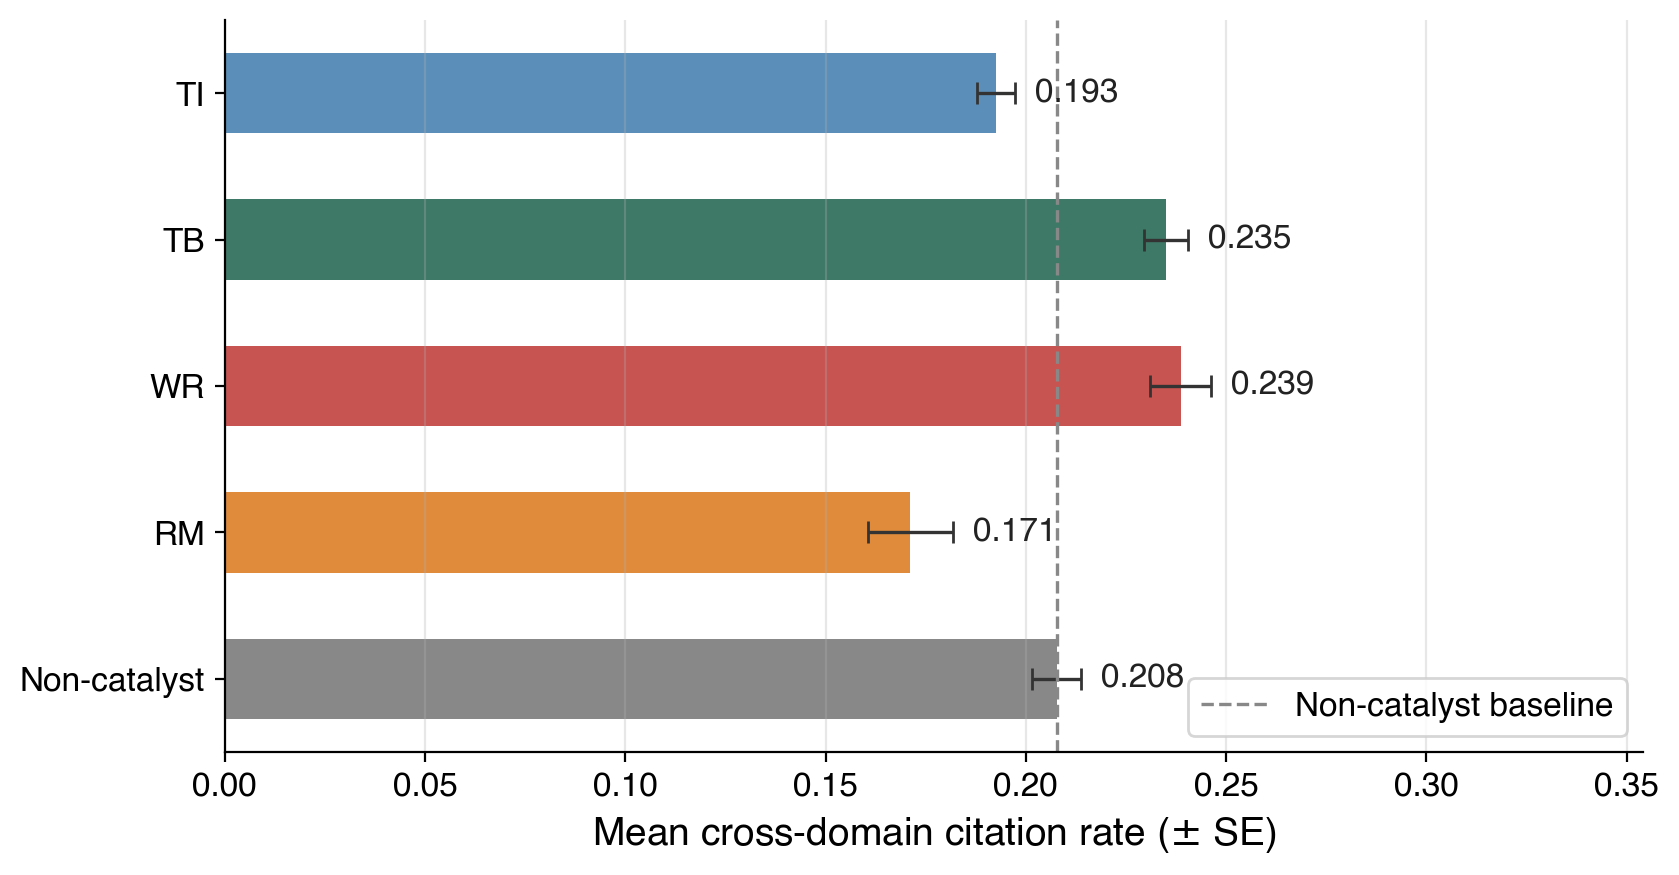
For cross-domain diffusion analysis, we retrieve \(792{,}018\) in-window citing works for \(7{,}332\) ICLR papers via the S2 Graph API and compute two metrics on the citing-paper side: a
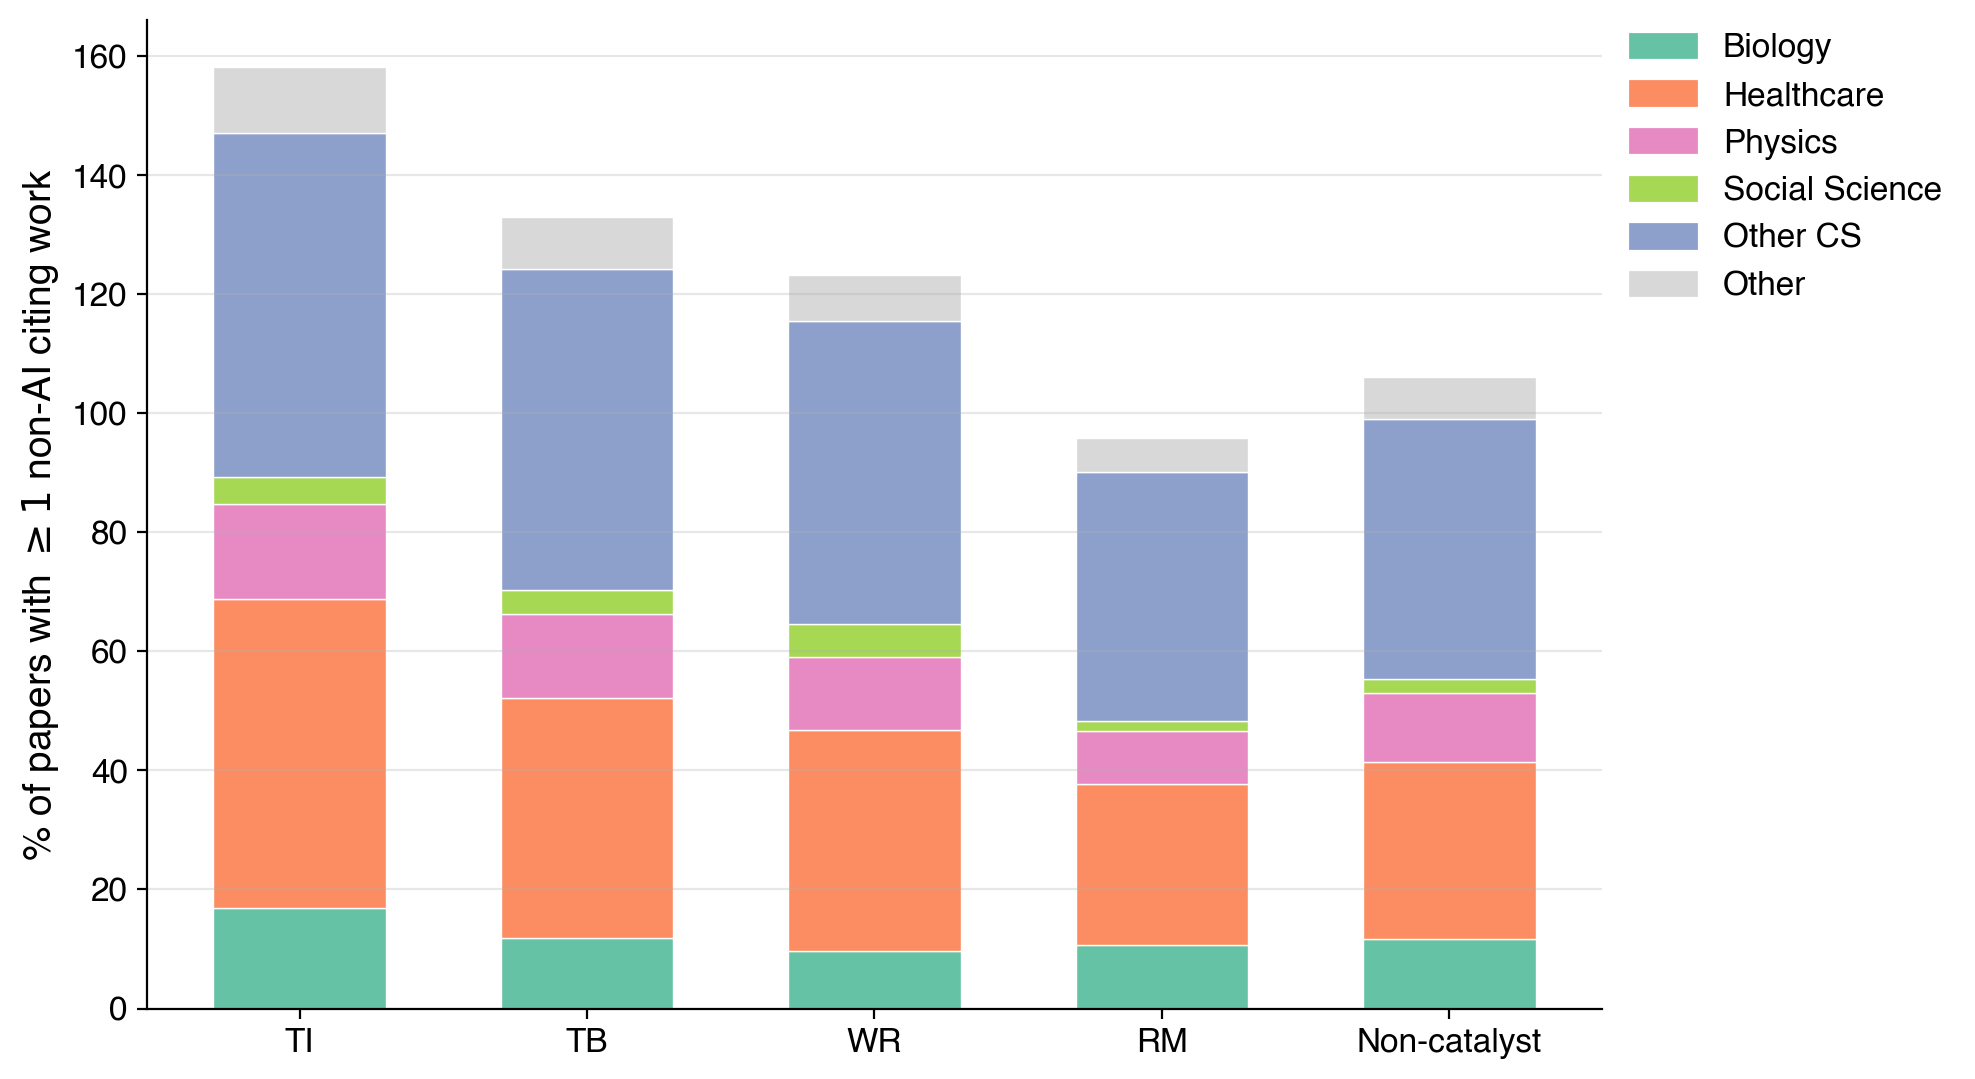
composition metric (the fraction of a paper’s citers that are non-AI) and a reach metric (the fraction of papers in a catalyst class with any non-AI citer). Composition places TB and WR above the non-catalyst baseline (Mann–Whitney \(p \leq 0.004\)), whereas reach places TI at the top of every non-AI domain (Biology \(17\%\), Healthcare \(52\%\), other CS \(58\%\)); RM papers are lowest on both metrics. The two metrics therefore tell different stories: TB and WR papers attract a higher share of citations from outside AI, while TI papers more uniformly succeed in
attracting any non-AI citers across diverse domains, and RM’s low performance on both is consistent with the under-recognition pattern reported in RQ3. The full methodology, figures, and limitations of the S2 fieldsOfStudy taxonomy
are in Appendix 17.
Topic bridges drive the largest catalyst effect (\(11.52\times\) cross-topic flow); topic initiators precede \(7.55\times\) sub-field growth; simultaneous discoveries are an order of magnitude rarer in AI than in physics.
7 RQ3: Peer Review and Recognition↩︎
7.1 Review Scores and Future Disruptiveness↩︎
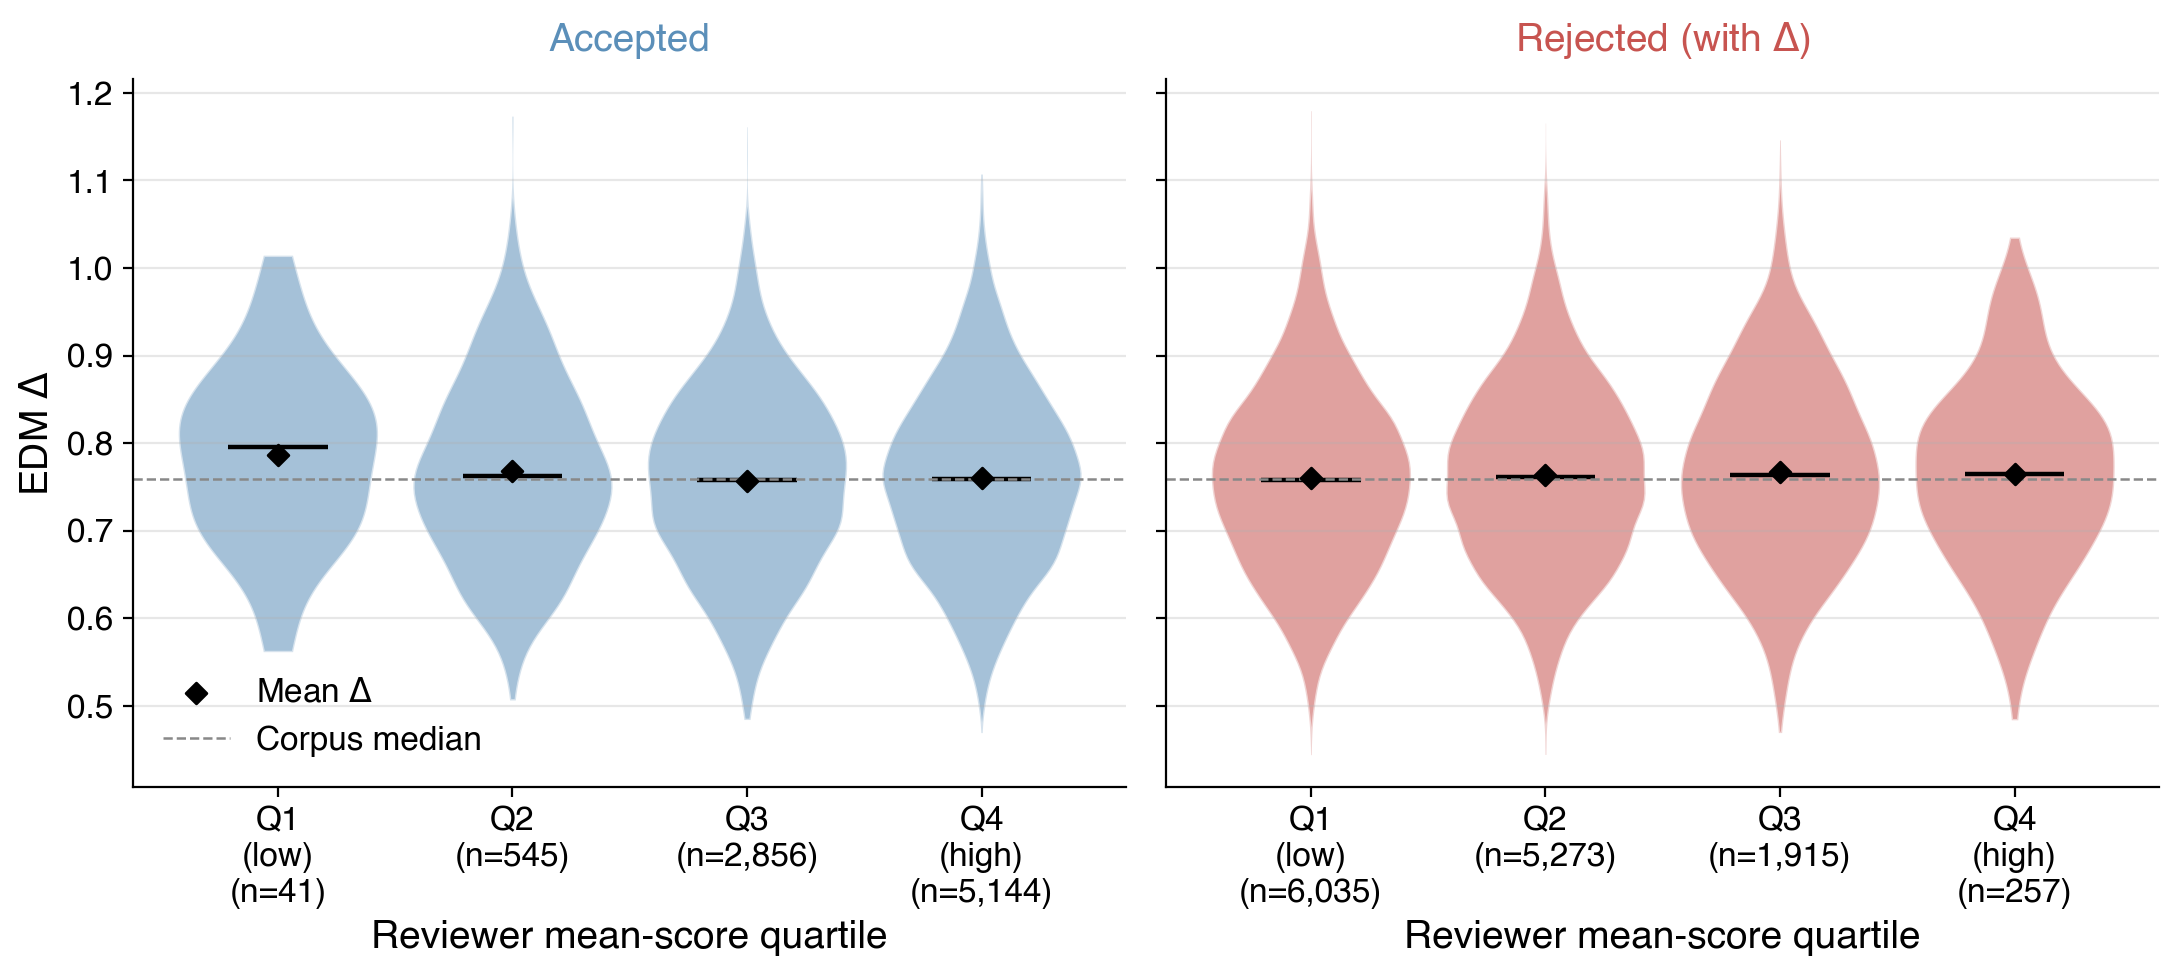
To test whether submission-time review signals predict future disruptiveness, we compute Spearman correlations between four review features (mean score \(\bar{s}\), variance \(\sigma^2_s\), range, and number of reviewers \(n_r\)) and EDM, fit Firth logistic regressions predicting top-decile \(\Delta\) membership (Table 4), and compare accepted versus rejected papers in the citation network via Mann–Whitney. The Spearman correlations lie within \(|\rho| \leq 0.005\); only the reviewer count reaches nominal significance (\(\rho = -0.045\), \(p{<}0.001\)), and it explains less than \(0.2\%\) of the variance. Firth odds ratios stay within \(2\%\) of \(1.0\), none significant at \(\alpha{=}0.05\). Accepted and rejected papers (\(n_{\text{acc}}{=}8{,}586\); \(n_{\text{rej}}{=}13{,}716\)) have indistinguishable mean EDM (\(0.7597\) vs.\(0.7624\); Mann–Whitney \(p{=}0.11\)), and rejected papers are slightly over-represented in the top-decile of EDM (\(10.3\%\) vs.\(9.5\%\)). At the corpus level, ICLR peer review therefore appears largely orthogonal to future disruptiveness as captured by EDM. The violin plot of EDM by score quartile and the reviewer-bin heatmap are in Appendix 18.
| Feature | \(\rho\) | \(p\) | OR | 95% CI | \(p_{\text{F}}\) |
|---|---|---|---|---|---|
| Mean score (\(\bar{s}\)) | \(-0.003\) | \(0.62\) | \(0.995\) | \([0.979, 1.010]\) | \(0.52\) |
| Score var.(\(\sigma^2_s\)) | \(-0.005\) | \(0.49\) | \(0.999\) | \([0.983, 1.015]\) | \(0.90\) |
| Score range | \(-0.003\) | \(0.69\) | \(1.000\) | \([0.984, 1.016]\) | \(0.97\) |
| # reviewers (\(n_r\)) | \(-0.045\) | \(<0.001\) | \(0.980\) | \([0.959, 1.002]\) | \(0.08\) |
7.2 Structured Miscalibration↩︎
We define the review gap for a paper as its EDM percentile minus its reviewer-score percentile, with a positive gap indicating that future disruption exceeded what the review score would have predicted, and compute the mean gap by catalyst type with \(t\)-tests against non-catalysts (Table 14). RM papers show a mean gap of \(+0.59\) (\(t = 85.75\), \(p<0.001\)), spanning more than half of the percentile range; TB papers show a mean gap of \(+0.15\) (\(t = 33.97\), \(p<0.001\)); TI papers are near zero (\(-0.095\); \(p=0.37\), ns); and WR papers show a small negative gap (\(-0.003\); \(p<0.001\)). Reviewers therefore appear well calibrated on within-topic work but systematically under-score cross-topic and recognition-misaligned contributions, which are the catalyst types most associated with redirecting research trajectories in this corpus. The full per-type table is in Appendix 18.
To assess what happens to ICLR-rejected papers, we track their reappearance on arXiv and other indexed venues; for those that do reappear we compare EDM distributions against accepted papers, separately examine borderline rejections (within \(0.5\) score points of the year’s median-accepted score) versus clear rejects via external citation counts, and look at the subset rejected at one cycle and re-accepted at a subsequent ICLR cycle. Of \(24{,}900\) rejected ICLR submissions, \(71.2\%\) never reappear on arXiv or any other indexed venue. The \(7{,}167\) that do reappear have mean \(\Delta\) statistically indistinguishable from accepted papers (Mann–Whitney \(p{=}0.11\)) and are slightly over-represented in the top-decile of \(\Delta\) (\(10.3\%\) vs.\(9.5\%\)), the top \(5\%\) (\(5.2\%\) vs.\(4.8\%\)), and the top \(1\%\) (\(1.1\%\) vs.\(0.8\%\)); borderline rejects accumulate substantially more external citations than clear rejects (median \(\log(1{+}\text{cit})\) \(2.30\) vs. \(1.79\), \(p{<}0.001\); robust to \(\delta \in \{0.25,0.50,0.75,1.00\}\)), and the \(280\) papers rejected at one ICLR cycle and later accepted at a subsequent ICLR cycle have median \(\Delta\) essentially identical to never-rejected papers (\(0.758\) vs.\(0.759\), \(p{=}0.61\)). The picture is therefore bimodal: most rejected submissions disappear from the scholarly record, but those that survive look statistically similar to accepted papers on EDM-based trajectory measures, with the borderline-reject subset only modestly under-credited in external citation counts. Full sensitivity tables and a four-panel rejected-papers figure are in Appendix 18.
7.3 Topic-Dependent Biases↩︎
To test for topic-level miscalibration, we compute the review gap within each topic cluster and rank clusters by their mean gap (Table 15, Appendix 18). The most over-valued clusters are Text-to-Video Generation (gap \(-0.265\)), Masked Image Modeling (\(-0.260\)), Vision Transformers (\(-0.249\)), State Space Sequence Modeling (\(-0.225\)), and Diffusion (\(-0.220\)); the most under-valued are Quantum ML (\(+0.193\)), Active Learning (\(+0.093\)), Safe RL (\(+0.090\)), and Federated Learning (\(+0.050\)). Reviewers in this corpus therefore tend to reward fashionable sub-fields beyond the future-disruption signal captured by EDM and to penalize niche or methodologically unusual areas; controlling for catalyst type does not eliminate the topic-gap signal, suggesting that topic bias and catalyst-type bias are largely independent dimensions of miscalibration. The visual summary of topic gaps is in Appendix 18.
Review signals are essentially orthogonal to long-run trajectory change at ICLR (\(|\rho|\leq 0.005\)); the residual miscalibration is structured by catalyst type and topic, not random reviewer noise.
8 Discussion and Limitations↩︎
Three properties of the ICLR record enable the present corpus-level comparison: public per-paper OpenReview scores, a preprint ecosystem in which \(28.8\%\) (\(7{,}167\) of \(24{,}900\)) of rejected submissions remain visible, and a nine-year window for multi-generational citation chains. The comparison is essentially null: reviewer signals do not track future EDM, and the residual miscalibration is structured by catalyst type and by topic rather than by reviewer noise. We do not interpret this as evidence that peer review has failed; a more cautious reading is that conference gatekeeping selects on rigor, immediate contribution, and fit, properties partially orthogonal to long-run trajectory change.
Several limitations bound the interpretation of these findings. The citation graph is restricted to ICLR-internal edges, so submissions rejected from ICLR and never re-indexed elsewhere are not observed; sparse citation coverage for the 2024–2025 cohorts narrows the EDM window for the most recent two years. Per-paper EDM ranks are sensitive to the walk-generation pipeline, though distribution-level conclusions are stable across hyperparameters and seeds (Appendix 12). The LLM-judge Annotation Set (LAS) is modest in size (\(n{=}50\), between-run \(\kappa = 0.291\) for the LLM judge), which widens the confidence intervals on the LLM rater’s LAS odds ratio; inter-rater agreement across five models from four vendors is reported on a stratified \(2{,}000\)-paper subsample (Appendix 13). Further limitations on the EDM canonical-follow-up blind spot, simultaneous-discovery validation, and citation-network coverage are detailed in Appendix 20.
9 Conclusion and Future Work↩︎
This work introduces an operational catalyst taxonomy and compares four disruptiveness measures across nine years of ICLR submissions, with corresponding reviewer signals linked to each paper. The directional citation embedding (EDM) shows the highest agreement with external structural recognition (ERS AUC \(0.83\)), while the LLM rater best matches an independent LLM-judge baseline (LAS AUC \(0.75\)); topic-initiator catalysts precede a \(7.55\times\) growth in topic share relative to year-matched controls, and topic-bridge catalysts precede an \(11.52\times\) growth in cross-topic citation flow.
These results suggest that catalyst signals at ICLR are at least partly separable from review-time signals, and that program-committee design may benefit from explicit consideration of trajectory-changing potential alongside the immediate contribution properties that reviewers currently optimize for.
Several directions extend this work. A multi-venue replication (NeurIPS, ACL, EMNLP, ICML) would test how much of the recognition gap is conference-specific. Scoring with additional current LLM snapshots would broaden the LLM-rater claim. Collecting human expert annotations on the disruption-label task would let LAS serve as a human-validated gold standard rather than a cross-model semantic-rubric baseline. Finally, a longitudinal re-evaluation that revisits each paper’s EDM trajectory would let us study the dynamics of catalyst recognition rather than only a static snapshot.
Ethics Statement↩︎
This work analyzes a publicly available scholarly dataset (berenslab/iclr-dataset) of ICLR submissions and OpenReview records; no private review identities are used, and all scores and decisions are already public on OpenReview at the time
of analysis. The dataset comprises publicly-posted submission metadata (titles, abstracts, author lists, reviewer scores, accept/reject decisions). Author names and affiliations appear in the source records but are not surfaced in our analyses, which
report results in aggregate or by paper ID, never by author. Reviewer scores are numeric integers (\(1\)–\(10\)); review-comment free-form text was not extracted or used. ICLR submission
titles and abstracts are author-curated and pre-screened by the venue, so we did not apply additional offensive-content filtering. The empirical findings on review miscalibration are descriptive and intended to inform program-committee design; they should
not be used to discount the work of individual reviewers, area chairs, or program chairs, whose decisions are made under realistic load constraints that we do not simulate. We caution against using a single disruption metric (EDM, LLM rater, or otherwise)
as a direct input to acceptance decisions: per-paper ranks are pipeline-sensitive (see Section 8), and the same structural bias toward established research vocabularies that the metrics themselves exhibit could be
amplified by such use. The LLM rater is prompted with title and abstract only and is not used to generate per-paper publishable judgments.
Acknowledgements↩︎
We thank the maintainers of the open-source datasets, models, and software libraries on which this study depends, including the berenslab/iclr-dataset of ICLR submissions and OpenReview metadata [6], the Semantic Scholar Graph API for citation data, the OpenAI text-embedding and gpt-4o-mini model families, the Anthropic Claude family, the open-weight
Llama-3.3 (Meta) and Qwen-2.5 (Alibaba) families, and the gensim, scikit-learn, NetworkX, UMAP, HDBSCAN, and matplotlib libraries. AI assistance was used only for grammar and style checks of the manuscript text; all analyses, code, and figures were
produced by the authors.
10 Citation Network Quality Analysis↩︎
10.0.0.1 ICLR submissions and acceptance.
Table 5 reports per-year ICLR submission counts and acceptance outcomes. Accept rates are stable at \(26\text{--}33\%\) across the decade, with \(2017\) as an outlier at \(40.5\%\) due to the much smaller submission pool.
| Year | Submissions | Accepted | Accept % |
|---|---|---|---|
| 2017 | 489 | 198 | 40.5 |
| 2018 | 1,012 | 336 | 33.2 |
| 2019 | 1,569 | 502 | 32.0 |
| 2020 | 2,593 | 687 | 26.5 |
| 2021 | 3,009 | 859 | 28.5 |
| 2022 | 3,422 | 1,094 | 32.0 |
| 2023 | 4,955 | 1,573 | 31.7 |
| 2024 | 7,401 | 2,261 | 30.5 |
| 2025 | 11,663 | 3,703 | 31.7 |
| Total | 36,113 | 11,213 | 31.0 |
10.0.0.2 Semantic Scholar match rates.
Table 6 reports the Semantic Scholar match rate by ICLR cohort year. Matching uses title-based fuzzy similarity (RapidFuzz token-set ratio \(\geq 0.85\)) with year tolerance \(\pm 2\). Early cohorts (2017–2020) are almost fully matched (\(>96\%\)); match rates decline for 2021–2025 as newer papers have less complete S2 indexing at retrieval time. Unmatched papers are concentrated among recent and rejected submissions that were never posted to arXiv.
| Year | ICLR papers | S2 matched | Match rate |
|---|---|---|---|
| 2017 | 489 | 483 | 98.8% |
| 2018 | 1,012 | 975 | 96.3% |
| 2019 | 1,569 | 1,553 | 99.0% |
| 2020 | 2,593 | 2,506 | 96.6% |
| 2021 | 3,009 | 2,396 | 79.6% |
| 2022 | 3,422 | 2,605 | 76.1% |
| 2023 | 4,955 | 3,692 | 74.5% |
| 2024 | 7,401 | 5,364 | 72.5% |
| 2025 | 11,663 | 8,269 | 70.9% |
| Total | 36,113 | 27,843 | 77.1% |
10.0.0.3 PDF-extraction fallback (ICLR 2017 pilot).
A PDF pipeline (pymupdf4llm + regex) was piloted on all 489 ICLR 2017 papers. PDF download success was 99%; however, extracted reference strings were unresolved (e.g., “Vaswani et al., 2017”) and would require an additional fuzzy-match step
to map to S2 records, defeating the purpose of a fallback. Given the 98.8% S2 match rate for 2017, the marginal benefit did not justify extending the pipeline to the full corpus.
11 Method Implementation Details↩︎
11.0.0.1 (M2) Generic Graph Embedding: node2vec details.
We train standard (undirected) node2vec [21] on the undirected version of \(G\) with walk length \(T = 160\), \(R = 80\) walks per node, embedding dimension \(d = 100\), and skip-gram context window \(c = 5\). For each paper \(i\) we compute \[\text{M2}_i = 1 - \frac{\bar{\mathbf{r}}_i \cdot \bar{\mathbf{c}}_i}{|\bar{\mathbf{r}}_i|\,|\bar{\mathbf{c}}_i|} \label{eq:n2v}\tag{2}\] where \(\bar{\mathbf{r}}_i\) is the mean embedding of \(i\)’s references and \(\bar{\mathbf{c}}_i\) is the mean embedding of \(i\)’s citers. The comparison between M2 and M3 isolates the contribution of direction-aware walk training: both pipelines share all hyperparameters and differ only in whether the random walks respect citation direction.
11.0.0.2 (M3) EDM training objective.
Following [12], the random-walk training objective with single-side (left-context-only) skip-gram is \[\begin{align} \mathcal{J} &\approx \sum_{u \in V} \sum_{v \in A_c(u)} \kappa_u^{\text{in}} \log \Pr(v \mid u) \\ \Pr(v \mid u) &= \frac{\exp(\mathbf{f}_v \cdot \mathbf{p}_u)}{\sum_{v' \neq u} \exp(\mathbf{f}_{v'} \cdot \mathbf{p}_u)} \end{align}\] where \(A_c(u)\) is the set of antecedent papers within \(c\) citation steps and \(\kappa_u^{\text{in}}\) is the in-degree weighting term that biases walks toward well-cited antecedents. The EDM score is the cosine distance between past and future vectors, \(\Delta_i = 1 - (\mathbf{f}_i \cdot \mathbf{p}_i)/(|\mathbf{f}_i|\,|\mathbf{p}_i|)\) (Eq. 1 in the main text).
11.0.0.3 (M4) LLM rater details.
We prompt gpt-4o-mini [27] to score each paper on a 0–10 integer disruption-potential scale given title and abstract.
The system prompt defines disruption as “ideas, methods, or findings that cause other researchers to abandon prior directions and build in a new direction” and explicitly distinguishes it from quality, novelty, and citation impact. Scoring is deterministic
(temperature \(=0\)) and runs in parallel with 25 workers. The full prompt is in Appendix 13. M4 captures a purely semantic notion of disruption grounded in paper content,
independent of its citation-graph position.
11.0.0.4 Topic modeling: details and topic-share formula.
We embed title [SEP] abstract (capped at \(6{,}000\) characters) with OpenAI text-embedding-3-large [28] at \(1{,}024\) dimensions for all \(36{,}113\) papers. Following the standard BERTopic-style recipe, we cluster in a reduced space rather than
on the raw high-dimensional embeddings: UMAP [29] projects to \(50\) dimensions (\(n_{\text{neighbors}} = 15\), \(\text{min\_dist} = 0\), cosine metric), then HDBSCAN [30] (\(\text{min\_cluster\_size} = 50\), Euclidean metric, EOM cluster selection) clusters that 50-D representation. A separate UMAP-2D projection (\(\text{min\_dist} = 0.1\)) is used for visualization only. Clustering on the 50-D UMAP rather than the \(1{,}024\)-D raw embeddings is substantially faster and produces comparable or better
cluster quality because UMAP explicitly preserves both local and global topology. For each topic cluster \(T\) and year \(y\), the topic share is \[\text{share}(T,
y) = \frac{|\{i : \text{topic}(i) = T, \text{year}(i) = y\}|}{|\{i : \text{year}(i) = y\}|}\] Topic-level citation flows are aggregated as cross-topic edge counts per year pair \((T_{\text{src}},
T_{\text{tgt}})\).
11.0.0.5 Validation evaluation.
For ERS and LAS we report ROC-AUC and odds ratios from Firth’s penalized logistic regression [31] with a \(10\)-percentile increase in the measure as the predictor unit. Firth penalization is essential here because both ERS and LAS have low positive rates that bias standard MLE.
12 EDM Parameter Sensitivity↩︎
We test EDM’s robustness to walk length \(T\) and embedding dimension \(d\) by running the pipeline with \(T \in \{80, 160, 240\}\) at \(d=100\) and \(d \in \{64, 100, 128\}\) at \(T=160\) (five configurations, 1D sweeps around the canonical \(T=160, d=100\)). For compute tractability we use \(R=20\) walks per node in the sweep versus \(R=80\) in the canonical run.
![Figure 2: EDM parameter sensitivity. (a) ERS AUC across 5 configurations is tightly clustered in [0.72, 0.76], within 6–9 points of the canonical R=80 run’s 0.827 (red dashed line). (b, c) Pairwise Spearman \rho and top-10% Jaccard overlap of each sensitivity config against the T=160,d=100, R=20 sensitivity baseline are substantially above random.](/article/2607.05401/figures/edm_parameter_sensitivity.png "fig:")
12.0.0.1 Validation quality is stable; exact ranks are not.
All five sensitivity configurations achieve ERS AUC in \([0.72, 0.76]\), within 6–9 points of the canonical run’s 0.827. The ability to identify externally-recognized papers is therefore robust to parameter choices. However, exact paper rankings vary nontrivially: Spearman \(\rho\) between alternative configs and the sensitivity baseline ranges from 0.47 to 0.59.
12.0.0.2 Training pipeline affects ranks more than hyperparameters.
A surprising finding is that the canonical (\(R=80\), sequential walks) and sensitivity (\(R=20\), parallel walks) pipelines produce weakly correlated individual rankings (Spearman \(\rho \in [-0.18, -0.10]\) across the five sensitivity configurations, mean \(-0.145\)), even at matched hyperparameters. This is because Word2Vec skip-gram training is sensitive to the order in
which sentences (walks) are presented: sequential generation produces ordered batches while parallel generation via imap_unordered randomizes them, and this difference accumulates over 5 training epochs into substantially different embeddings.
We therefore treat EDM scores as calibrated-within-pipeline but not guaranteed to reproduce exact ranks across pipeline choices. Distribution-level conclusions (top deciles, mean trends, validation AUC) are robust; individual paper ranks
carry pipeline noise on the order of \(\rho \in [0.47, 0.59]\). All main-text results use the canonical pipeline.
12.0.0.3 Multi-seed ensemble (rank-stability mitigation).
We trained EDM under \(K{=}3\) seeds (42, 7, 123) at the sensitivity-baseline configuration (\(R{=}20\), \(T{=}160\), \(d{=}100\), \(c{=}5\), single-process walk generation). Cross-seed pairwise Spearman \(\rho = 0.55 \pm 0.05\) (range \([0.52, 0.61]\); \(18{,}475\) papers with all-seed scores), and top-\(10\%\) Jaccard overlap \(= 0.27\) across seed pairs. Per-seed ERS AUC is \(0.59\text{--}0.61\) (lower than the canonical \(0.83\), as expected from \(R{=}20\) vs.\(R{=}80\)); the median-rank ensemble achieves AUC \(0.61\), modestly better than any single seed. The headline implication is that the cross-pipeline near-zero-\(\rho\) result above is specifically a pipeline-noise effect, not a seed-noise effect: same-pipeline cross-seed stability is moderate, and a small-\(K\) ensemble further attenuates per-paper rank variance.
13 LLM Rater (M4): Prompt and Robustness Considerations↩︎
13.0.0.1 Model.
gpt-4o-mini, accessed via the OpenAI Chat Completions API. Deterministic decoding (\(\tau=0\)), parallelism: 25 workers. Total inference: \(36{,}113\) short calls.
13.0.0.2 System prompt (verbatim).
You are a scientific reviewer evaluating the disruption potential of a research paper based only on its title and abstract.
Disruption is defined as: “ideas, methods, or findings that cause other researchers to abandon prior directions and build in a new direction.” A paper that consolidates an existing line of work (e.g., an improved benchmark, a careful empirical study) is not disruptive.
Disruption is distinct from:
Quality. A paper can be excellent but consolidating.
Novelty. A novel contribution may still extend an existing line.
Citation count. A widely-cited paper may be consolidating; a lightly-cited paper may still be disruptive.
Return a single integer from 0 (clearly consolidating) to 10 (paradigm-shifting), with no additional text.
13.0.0.3 User prompt.
Title: {title}‘
nAbstract: {abstract}
13.0.0.4 Robustness considerations.
The score depends on choice of LLM and on phrasing of the rubric. We measure LLM-of-choice sensitivity directly via the cross-vendor agreement study below; we did not run a multi-prompt ablation. Our findings about EDM–LLM complementarity rely only on the LLM score being any reasonable semantic signal, not on its absolute calibration; this is the safer interpretation supported by the data.
13.0.0.5 Inter-LLM agreement (vendor robustness).
We re-scored a \(2{,}000\)-paper stratified sample (year-group \(\times\) decision \(\times\) EDM tercile) with four additional LLMs using the identical
rubric: gpt-4o (OpenAI), claude-sonnet-4-6 (Anthropic), llama-3.3-70b-instruct (Meta, via OpenRouter), and qwen-2.5-72b-instruct (Alibaba, via OpenRouter). All five models returned valid scores at \(99.0\%\)–\(100\%\) rates. Across the resulting \(10\) pairwise comparisons, mean Spearman \(\rho = 0.60\) (range \([0.46, 0.72]\)) and mean quadratic Cohen’s \(\kappa = 0.28\) (Table 3). This supports the M4 claim: the LLM signal is rubric-bound, not gpt-4o-mini-specific,
and stable across four vendors (OpenAI, Anthropic, Meta, Alibaba).
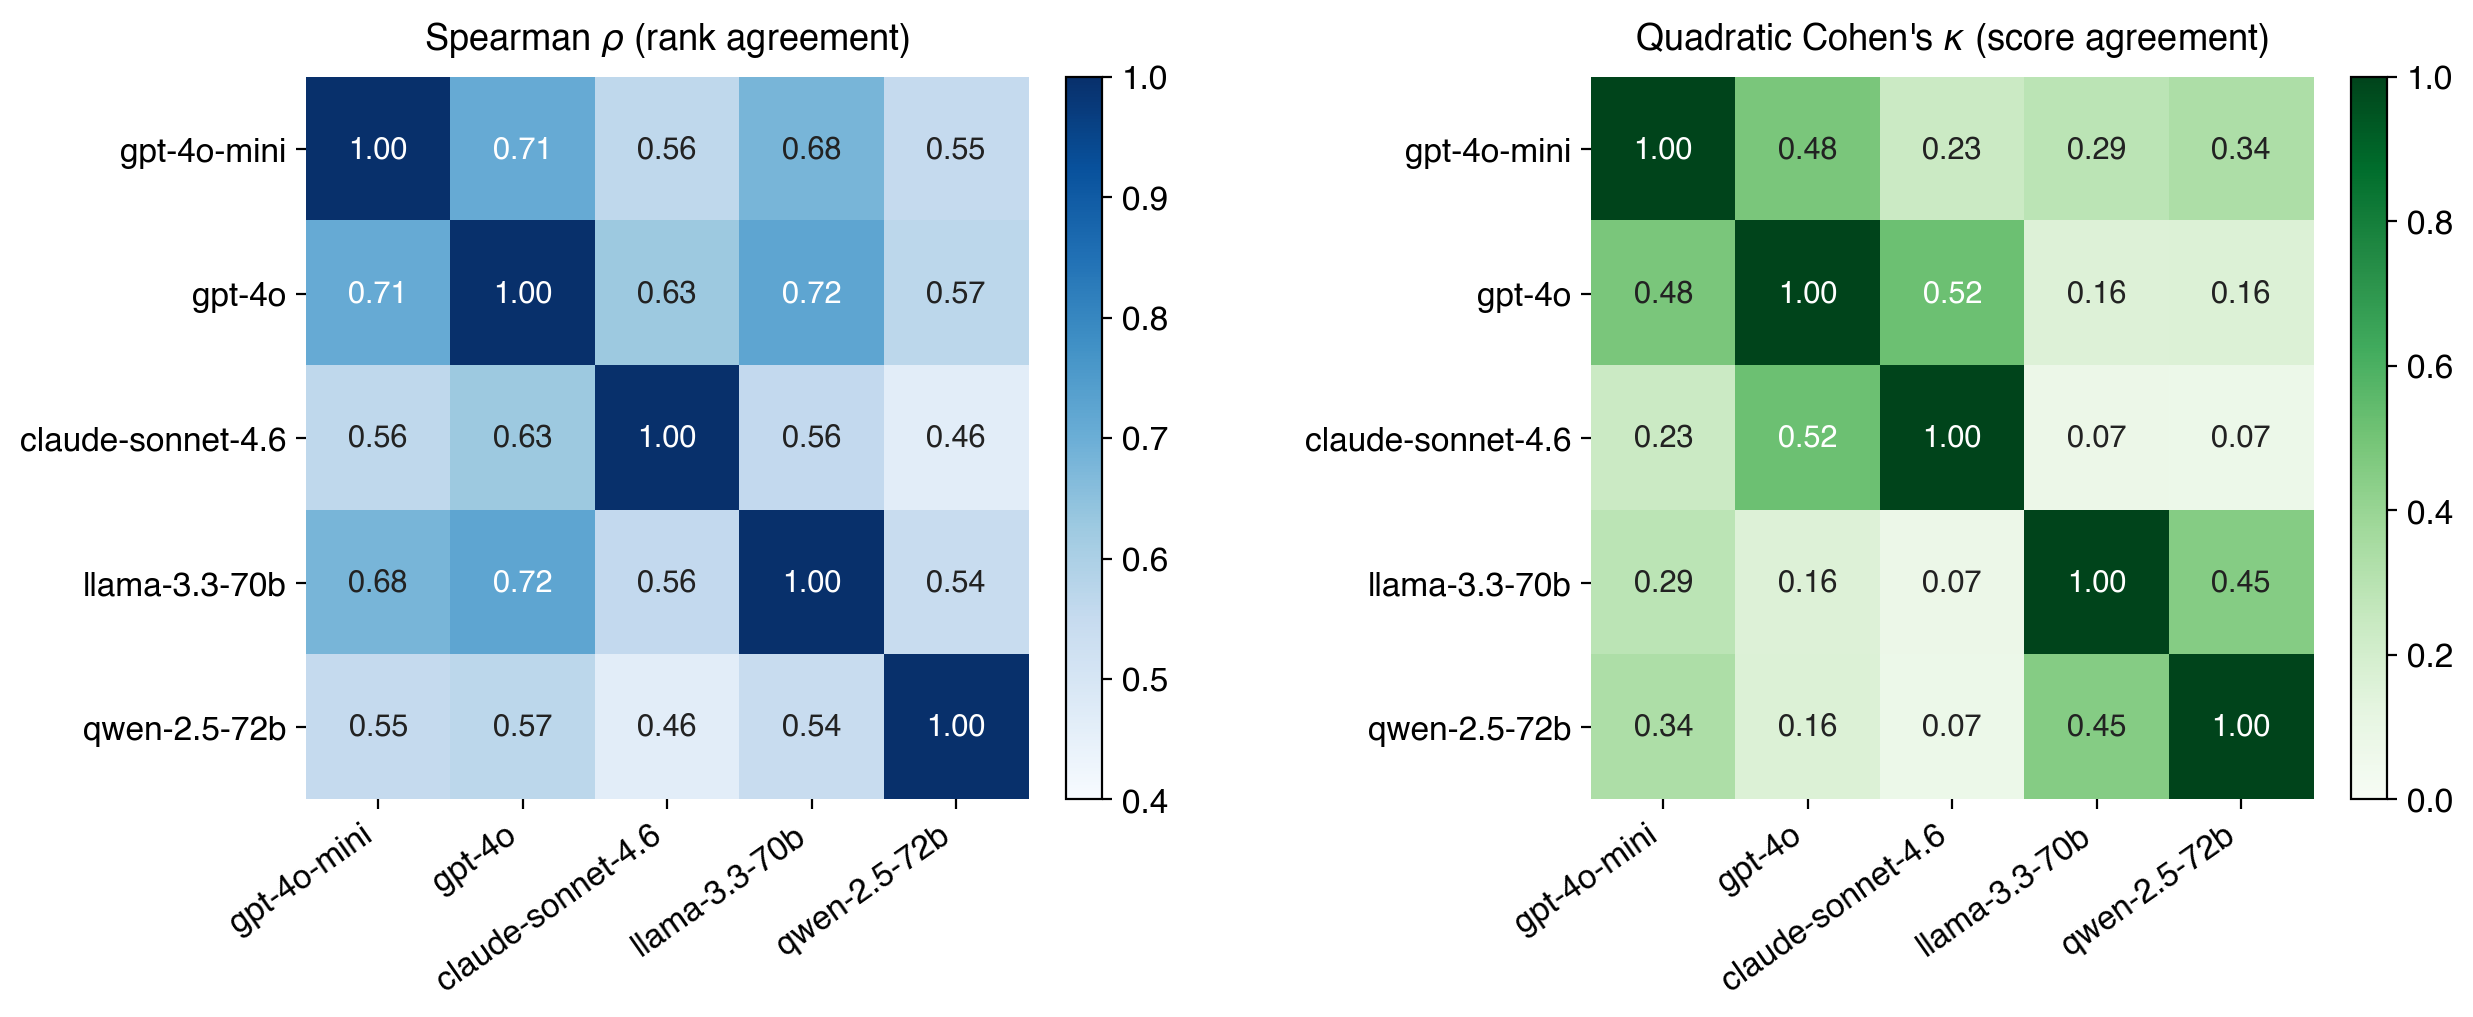
13.0.0.6 Note on Claude snapshot.
An earlier attempt used the retired claude-3-5-sonnet-20241022 snapshot which returns \(404\) Not Found on current Anthropic accounts; all calls failed silently in the wrapper and yielded \(0\) valid scores across \(2{,}000\) papers. A small diagnostic pass with single-call probes isolated the cause and confirmed that claude-sonnet-4-6 returns clean rubric-format
responses without prefilling or special parsing. All results in this section use that snapshot.
13.0.0.7 Scoring distribution.
The full-corpus distribution of M4 scores is bimodal at \(5\) and \(7\), with \(7/10\) corresponding to the \(83.8\)th percentile and \(8/10\) to the \(99.6\)th. Among the \(27\) ICLR Best Paper winners (2021–2025), GPT-4o-mini assigns \(7/10\) to most papers; only “Score-Based Generative Modeling through SDEs” (2021) receives \(8/10\). This saturation is discussed in Appendix 16.
14 Validation Set Details↩︎
External Recognition Set (ERS)↩︎
The ERS consists of all ICLR papers in the top \(2\%\) by ICLR-internal citation count (citations received from other papers in the 36,113-paper corpus). The 98th-percentile threshold is \(33\) inbound citations; \(739\) papers meet this criterion (\(739 / 36{,}113 = 2.05\%\), slightly above \(2\%\) due to ties at the boundary). The threshold adapts to the empirical distribution rather than a fixed count; the ICLR-internal citation network is sparse (\(12{,}831\) papers have at least one citer), and a fixed count would produce too few positives for reliable AUC estimation.
Papers without any ICLR-internal citations receive a count of zero and are not ERS positives. The citation count baseline is excluded from ERS evaluation because ERS is defined by citation count (making any AUC for that baseline trivially circular).
LLM-judge Annotation Set (LAS)↩︎
The LAS is a stratified random sample of \(50\) papers labeled by two independent runs of an LLM judge (claude-opus-4-6, Anthropic) over each paper’s title and abstract. Stratification was by: (i)
year-group (early: 2017–2018; mid: 2019–2021; late: 2022–2024); (ii) acceptance status (26 accepted, 24 rejected); and (iii) CD-score tercile (low/mid/high) to avoid over-sampling high-CD papers. This design ensures the sample is
representative of the corpus across time, status, and CD distribution.
Each run independently emitted a binary disruption label (1 = disruptive, 0 = consolidating) and a confidence rating (1–3). Run 1 labeled 7 papers disruptive (14%) and Run 2 labeled 4 (8%). Under union aggregation (either run says disruptive),
the LAS contains \(\mathbf{9}\) positive and \(\mathbf{41}\) negative labels. Under intersection aggregation (both agree), only \(2\) papers are positive,
which is too few for reliable AUC estimation. Cohen’s \(\kappa = 0.291\) (86% raw agreement) measures run-to-run stochastic consistency of the LLM judge, not human inter-rater reliability; the standard Landis–Koch
interpretive scale therefore does not apply. The LAS provides a cross-model semantic-rubric baseline (judge claude-opus-4-6 vs.M4 rater gpt-4o-mini), not a human-validated gold standard; we discuss the implications in Section 8.
ICLR Best Paper Case Studies↩︎
The best-paper set consists of 27 Outstanding Paper Award winners from ICLR 2021–2025 with per-year distribution 8/7/4/5/3 (2021/2022/2023/2024/2025), matched by OpenReview forum ID from the official ICLR website and human-verified. These papers are used only for qualitative interpretation and coverage comparisons (Appendix 16), not for AUC or regression evaluation.
15 LAS Annotation Protocol (LLM Judge)↩︎
The LAS labels come from an LLM judge (claude-opus-4-6, Anthropic) prompted with the rubric below, run twice independently over the same \(50\)-paper sample. The rubric was originally drafted to instruct
human annotators in an earlier design iteration; the wording and field schema were preserved when the protocol moved to the LLM judge.
15.0.0.1 Task.
For each paper, the judge reads the title and abstract and assigns a disruption label based on whether the paper primarily disrupts or consolidates existing research directions:
Disruptive (1): The paper introduces ideas, methods, or findings that cause subsequent researchers to move away from prior work and build in a new direction. Citing papers tend to cite this paper instead of its references.
Consolidating (0): The paper extends, refines, or synthesizes existing work without fundamentally redirecting the field. Citing papers tend to cite this paper alongside its references.
15.0.0.2 Key distinctions.
The prompt explicitly states that (a) disruption is not the same as quality, since a paper can be excellent but consolidating (for example, a thorough benchmark); (b) disruption is not the same as novelty, since a novel contribution may consolidate if it extends an existing line; and (c) disruption is not the same as citation count, since a highly cited paper may be consolidating and a lightly cited paper may be disruptive.
15.0.0.3 Output fields.
Each output row records three items per paper: a disruption label (\(0\) or \(1\)), a confidence rating (\(1=\) low, \(2=\) medium, \(3=\) high), and optional free-text notes for borderline cases.
15.0.0.4 Provided context.
Each prompt included the paper’s CD disruption index, ICLR-internal citation count, and acceptance status, marked as for reference only with an explicit instruction not to copy the CD score. The judge had access only to title, abstract, and these reference fields; it did not retrieve the full paper.
15.0.0.5 Run-to-run aggregation.
No adjudication round was conducted. The two runs were aggregated by union (positive if either run labeled the paper disruptive) for LAS evaluation. Cohen’s \(\kappa = 0.291\) between the two runs is a measure of run-to-run stochastic consistency of the judge under the same rubric, not human inter-rater reliability; it primarily reflects ambiguity in the rubric plus stochasticity in the judge’s outputs.
15.0.0.6 Calibration examples in the prompt.
The rubric provided four canonical calibration examples: “Attention Is All You Need” (disruptive, confidence 3, introduced Transformers replacing RNN and CNN seq2seq models); “BERT” (disruptive, 3, shifted NLP toward pre-train and fine-tune); “A Survey of Deep Learning for NMT” (consolidating, 3, synthesizes existing work); and “Improved Regularization with Cutout” (consolidating, 2, incremental data-augmentation extension).
16 RQ1 Extended Analyses↩︎
16.0.0.1 Temporal trend of EDM.
Mean and median \(\Delta\) at ICLR fluctuate modestly around \(0.76\) across \(2017\text{--}2025\) without the monotonic decline reported by [7] for broad science (Fig. 4). Possible interpretations: (i) the 9-year ICLR window is too short to detect decadal change; (ii) AI’s rapid iteration introduces both consolidating benchmark work and disruptive paradigm shifts in comparable proportions; (iii) ICLR’s growth in submissions (489 in 2017 to \(11{,}663\) in 2025) dilutes the signal from individual disruptive papers.
![Figure 4: Temporal trend of EDM across ICLR 2017–2025. (a) Mean and median \Delta are stable over the decade. (b) The year-wise violin plot shows that disruptiveness distributions shift modestly but do not exhibit the monotonic decline reported for Web-of-Science-indexed journal science [7].](/article/2607.05401/figures/fig2_yearly_trend.png "fig:")
16.0.0.2 Pairwise scatter and correlation.
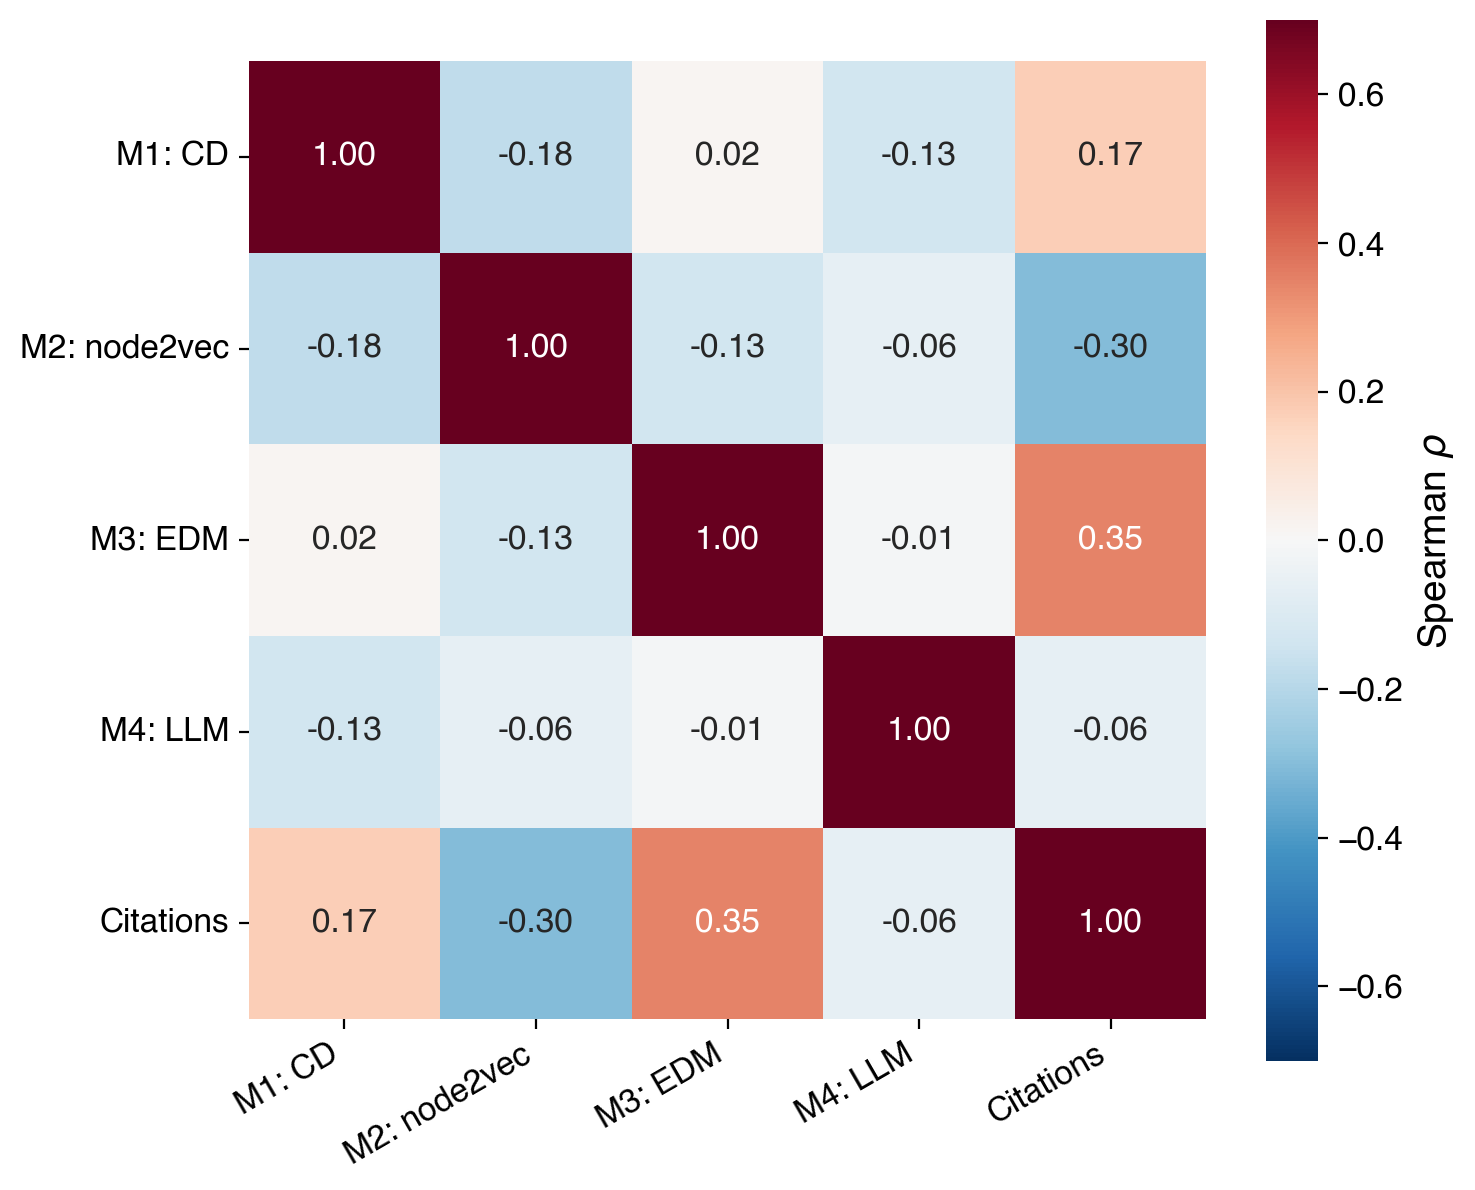
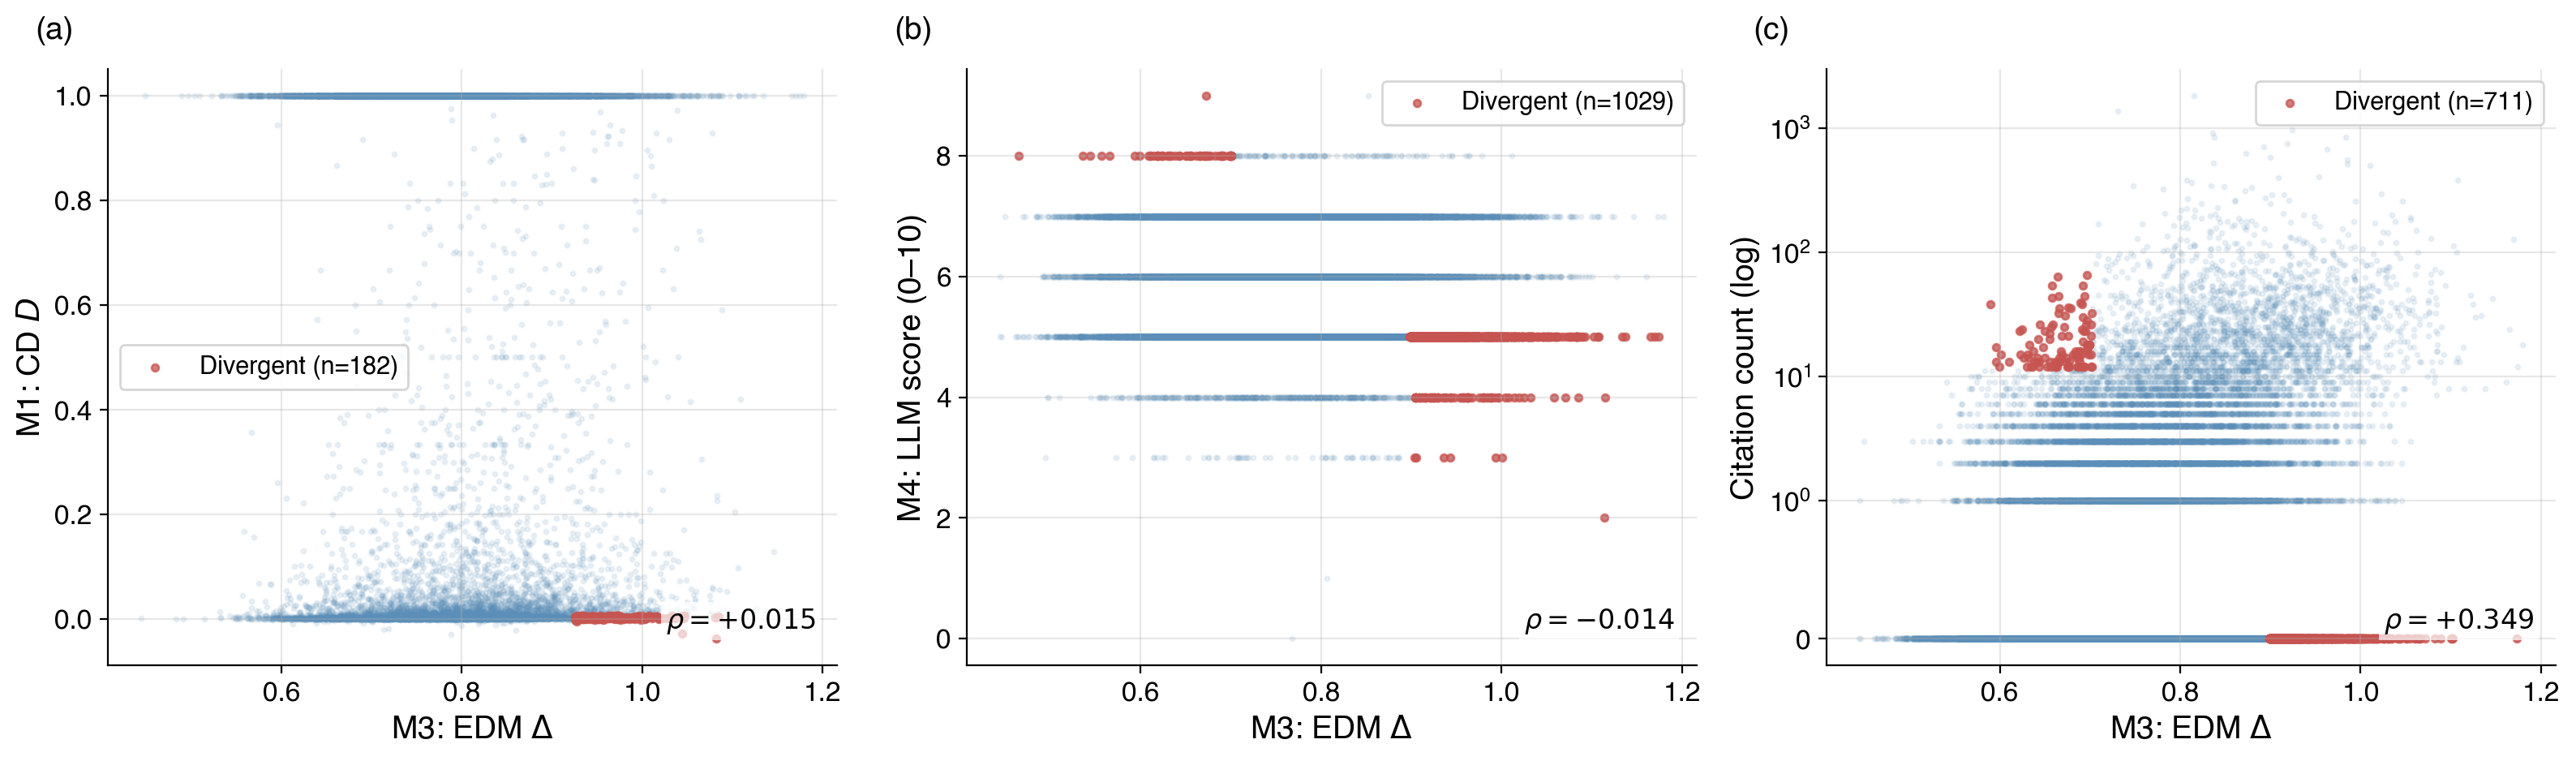
On the \(27\) ICLR Best Paper winners (2021–2025), we compute per-measure coverage to test how each disruptiveness measure handles recent, partly-cited work. M1 (CD) covers \(14/27\), M2 (node2vec) covers \(12/27\), M3 (EDM) covers \(24/27\), and M4 (LLM) covers \(27/27\); seven of the \(8\) ICLR 2024–2025 winners fail both M1 and M2 because the citation window is too narrow, while EDM produces a score because its random walks pick these papers up through other contexts. The coverage gap is a practical limitation of citation-based disruption measures for recent work and a concrete argument for pairing them with embedding-based or content-based measures in fast-moving fields.
As a temporally-normalized check on the ERS ranking, we compute the Spearman correlation between each measure and citations per year since publication. EDM yields \(\rho = +0.300\) (\(p < 0.001\)), CD \(\rho = +0.127\) (\(p < 0.001\)), node2vec \(\rho = -0.293\) (\(p < 0.001\)), and LLM \(\rho = +0.016\) (\(p = 0.074\), ns). EDM and CD are correctly signed; node2vec is inversely correlated with impact velocity, confirming that it does not measure disruption in any useful sense; LLM shows no significant association with citation velocity, consistent with its independence from citation-graph signals. The ranking EDM \(\gg\) CD \(\gg\) node2vec is therefore consistent across both ERS (static) and citation velocity (time-normalized), reducing the risk that the ERS result is an artifact of how ERS is defined.
To identify EDM’s failure modes on field-shaping work, we examine the per-paper EDM percentiles of the Best Paper winners. Several clearly field-shaping papers receive low EDM scores: Score-Based Generative Modeling through SDEs (2021, EDM \(26.4\)th percentile), Analytic-DPM (2022, \(8.4\)th), Generalization in Diffusion (2024, \(2.0\)th), and Learning Mesh-Based Simulation (2021, \(17.1\)th). These papers extended existing research lines (score-based SDEs built on NCSN; Analytic-DPM refined DDPM) without introducing a structurally new vocabulary, so when future citers remain close to the paper’s own antecedents the past and future vectors stay similar by construction. We accordingly recommend pairing EDM with a semantic measure (M4) that can flag conceptually important follow-ups graph structure alone would miss.
To probe the LLM rater’s ceiling, we examine the scores assigned by GPT-4o-mini to the \(27\) ICLR Best Paper Award winners (2021–2025). The model assigns \(7/10\) to most papers (corresponding to the \(83.8\)th full-corpus percentile); only Score-Based Generative Modeling through SDEs (2021) receives \(8/10\) (\(99.6\)th percentile), and no winner receives \(9/10\) or \(10/10\). The LLM rater therefore reliably distinguishes disruptive papers from consolidating ones but saturates within the top tier and cannot differentiate among the most exceptional contributions; this ceiling effect is complementary to EDM’s blind spot, since EDM under-ranks canonical follow-ups whereas the LLM cannot rank among papers it correctly identifies as outstanding.
17 RQ2 Supplementary Analyses↩︎
17.0.0.1 Topic clustering parameters.
We use OpenAI text-embedding-3-large with dimensions\(=1024\). For HDBSCAN we cluster on a 50-dim UMAP projection (\(n_{\text{neighbors}}=15\), \(\text{min\_dist}=0\), cosine) and require \(\text{min\_cluster\_size}=50\). This produces \(113\) topics and leaves \(12{,}102\)
papers (\(33.5\%\)) as noise. The ten largest topics cover over \(50\%\) of clustered papers (Table 7); the remaining \(103\)
topics cover niche areas (quantum ML, symbolic regression, causal effect estimation, etc.).
| Topic | Size | Label (top keywords) |
|---|---|---|
| 33 | 1,844 | Neural Network Optimization |
| 72 | 1,072 | Diffusion-based Image Generation |
| 17 | 1,000 | Adversarial Robustness Techniques |
| 2 | 853 | Molecular Design and Generation |
| 81 | 822 | Multimodal Vision-Language Integration |
| 6 | 798 | Federated Learning Optimization |
| 62 | 704 | Graph Neural Networks |
| 14 | 611 | Physics-Informed Neural Networks |
| 3 | 573 | Continual Learning Strategies |
| 16 | 572 | Explainable AI Techniques |
17.0.0.2 Catalyst type counts and co-occurrence.
TB=\(3{,}539\) (\(9.8\%\)), TI=\(3{,}063\) (\(8.5\%\)), WR=\(2{,}562\) (\(7.1\%\)), RM=\(1{,}119\) (\(3.1\%\)); union \(=8{,}015\) (\(22.2\%\)). Figure 7 shows the full co-occurrence matrix.

17.0.0.3 Operational thresholds.
Each catalyst label is produced by a thresholded operational criterion applied to the EDM and topic artifacts (Table 8).
| Type | Threshold |
|---|---|
| TI | Topic-share growth \(\geq 2.0\times\) baseline |
| TB | Top \(10\%\) cross-topic flow and \(\geq 2\) descendant topics |
| WR | Centroid-shift \(z\)-score above cluster-conditional median |
| RM | EDM \(\geq\) 90th pct and borderline/contested review |
17.0.0.4 TI: year-matched control growth.
| Group | \(n\) | Mean growth | Median |
|---|---|---|---|
| TI papers | 3,063 | 5.91 | 3.23 |
| Year-matched controls | 9,336 | 0.78 | 0.66 |
| Ratio of means | — | \(7.55\times\) | — |
4pt
17.0.0.5 TB: cross-topic citation flow.
| Metric | Value |
|---|---|
| TB papers with valid pre+post windows | 3,228 |
| Mean pre-window flow (edges/yr) | 242.3 |
| Mean post-window flow (edges/yr) | 848.5 |
| Mean growth factor | \(11.52\times\) |
| Median growth factor | \(4.36\times\) |
| 25–75th percentile of growth | \([2.58, 9.34]\) |
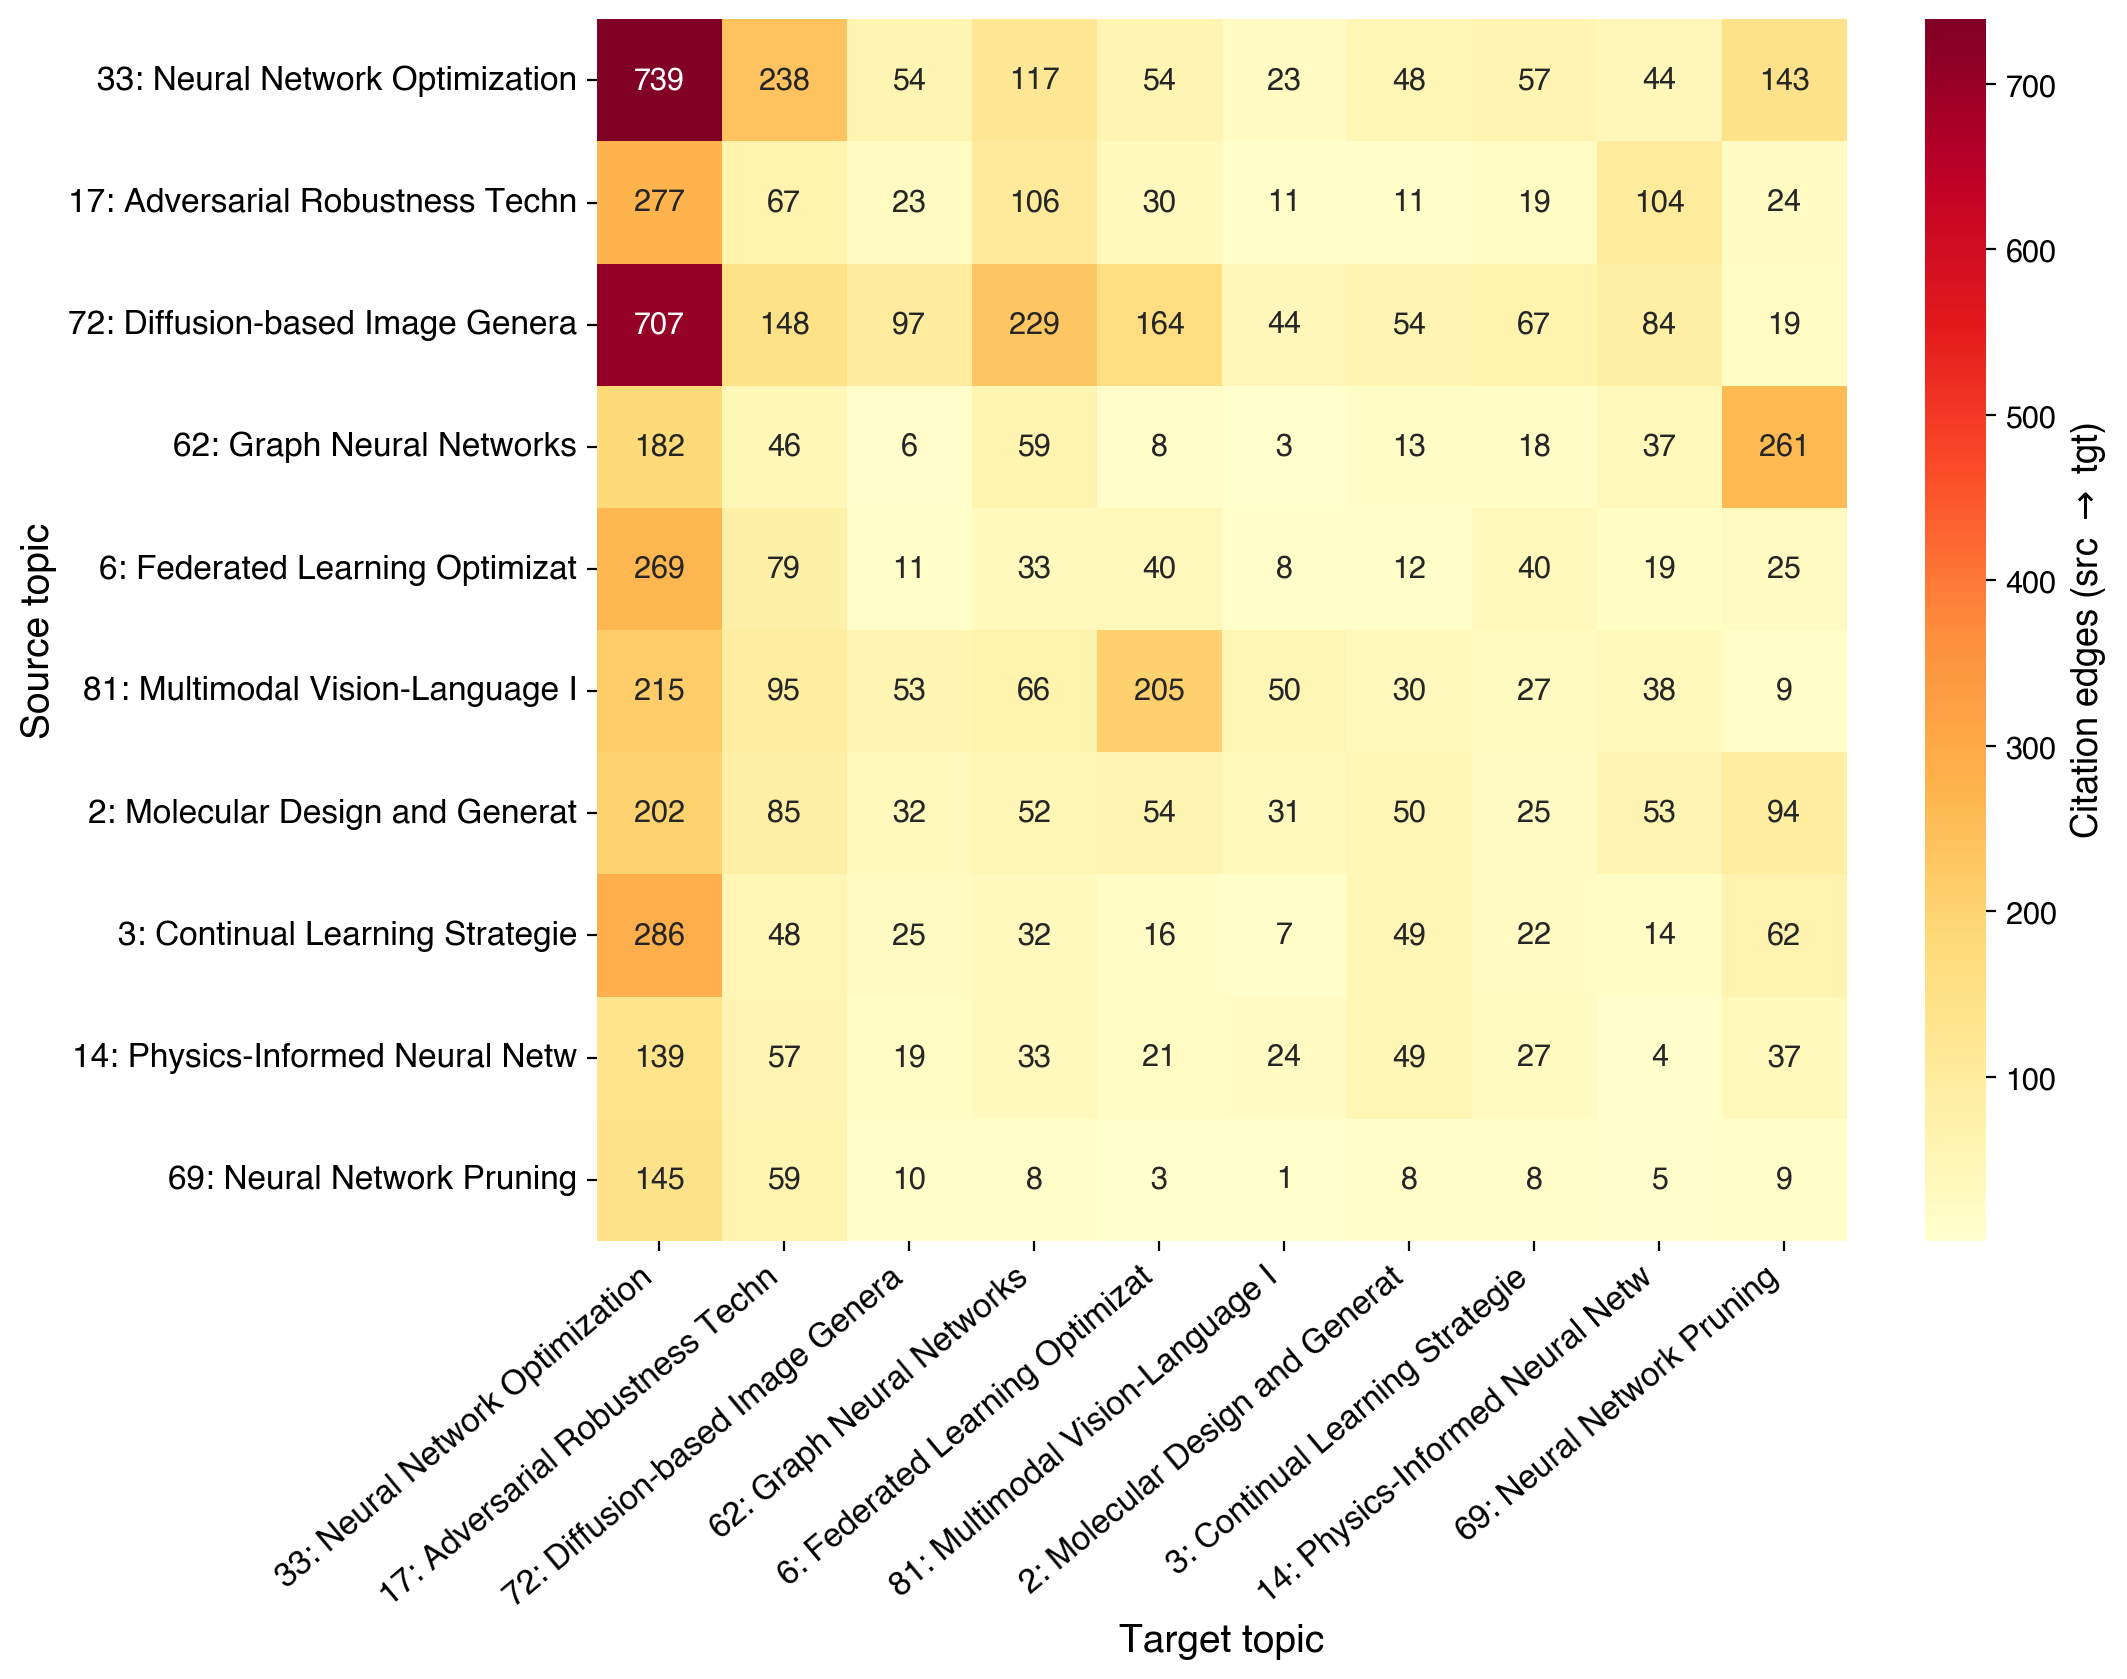
17.0.0.6 Cross-topic flow records.
We aggregate ICLR-internal citation edges by (source topic, target topic, year pair) into \(15{,}556\) flow records. TB papers are those whose publication is followed within 2 years by an increase in inbound cross-topic flow to or from their own topic cluster exceeding a per-pair baseline.
17.0.0.7 Simultaneous-discovery candidate funnel.
Following [12], we identify candidate pairs as papers published in the same year whose future vectors have cosine \(\geq 0.9\) and no author overlap. The raw threshold produces \(483{,}809\) candidates from the \(22{,}302\) papers with valid future vectors. Inspection reveals many top-similarity pairs are artifacts of sparse citation neighborhoods (the two highest-cosine pairs at \(0.999\) similarity pair topically unrelated papers, e.g., “Multi-Vector Embedding on Networks with Taxonomies” with “Dynamic Least-Squares Regression”, 2022). We apply three filters (Table 11); the steep drop from \(482{,}850\) to \(334\) at the citation-count filter shows that the cosine threshold alone is dominated by under-determined pairs.
| Stage | Remaining pairs |
|---|---|
| Raw candidates (cosine \(\geq 0.9\)) | 483,809 |
| After no author overlap | 482,850 |
| After both have \(\geq 3\) internal citations | 334 |
| After both in valid topic cluster | 162 |
17.0.0.8 Citation-based validation of simultaneous discovery.
We operationalize simultaneous discovery via two citation-graph criteria: independence (no edge \(A \to B\) or \(B \to A\)) and shared descendants (co-citation rate \(|\mathrm{citers}(A) \cap \mathrm{citers}(B)| / \min(|\mathrm{citers}(A)|, |\mathrm{citers}(B)|) \geq 0.20\)).
| Scope | Pass | Rate | 95% CI |
|---|---|---|---|
| Top-80 (cosine-ranked) | \(61/80\) | \(76.25\%\) | [65.4, 85.1]% |
| Filtered top-162 | \(115/162\) | \(71.0\%\) | [63.4, 77.8]% |
| Full 483,809 pool | \(975\) | \(0.20\%\) | [0.19, 0.21]% |
| Direct-edge rate | \(562\) | \(0.12\%\) | — |
3pt
17.0.0.9 Threshold sensitivity.
At the top-80, citation-based precision is \(91.25\%\) under independence alone (\(73/80\)), \(85.0\%\) at co-citation rate \(\geq 0.10\), \(76.25\%\) at \(\geq 0.20\), \(62.5\%\) at \(\geq 0.30\), and \(46.25\%\) at \(\geq 0.50\). Precision is robust to threshold choice across this range. We report \(\geq 0.20\) as the primary number (at least one-fifth co-cited) without forcing a hard constraint the pool cannot support.
17.0.0.10 Within-top ranking is not well-calibrated.
Within the top-80, Spearman \(\rho\)(EDM cosine, co-citation rate) \(= +0.119\) (\(p = 0.29\)). The filter “cosine \(\geq 0.9\)” is effective but finer cosine ranking within the top region does not predict descendant structure. Precision is driven by the threshold, not the ordering.
17.0.0.11 Confirmed same-topic pair.
The single same-topic pair in the top-\(80\), a 2023 robotics-manipulation pair (“Toward Learning Geometric Eigen-Lengths Crucial for Robotic Fitting Tasks” and “A Massively Parallel Benchmark for Safe Dexterous Manipulation”), passes all thresholds up to \(\geq 0.30\) and is the first ICLR simultaneous-discovery pair confirmed by our protocol.
17.0.0.12 Interpretation.
Three non-exclusive explanations for why AI’s simultaneous-discovery rate is lower than the physics setting of [12]: (i) arXiv preprint culture circulates ideas well before ICLR deadlines, so parallel discovery in a journal-based field becomes sequential citation in AI; (ii) ICLR’s 9-year window contains 3–5 generations of research topics, so any simultaneous idea has time to resolve into a citation hierarchy before both papers reach a conference; (iii) papers often look similar because they target the same benchmark, which reflects convergence on a predecessor rather than independent discovery.
17.0.0.13 Cross-domain diffusion methodology.
We retrieved citing works via the Semantic Scholar Graph API for all \(6{,}797\) catalyst papers with S2 identifiers plus a stratified \(2{,}000\)-paper non-catalyst control (seed 42).
For each cited paper we kept only citing works within three years of its ICLR appearance (up to \(1{,}000\) per paper) and classified each as AI-core or non-AI via S2’s fieldsOfStudy tags. Of the \(8{,}797\) target papers, \(7{,}332\) (\(83.3\%\)) yielded \(\geq 1\) saved citing work and \(1{,}463\) (\(16.6\%\)) returned zero in-window citations on a confirmed retry at \(1\) req/s single-flight; these are treated as real zeros. The collection
yielded \(792{,}018\) (cited, citing) pairs across \(140{,}073\) unique non-ICLR citers; \(20.6\%\) of all citing works fall outside AI-core.
17.0.0.14 Composition vs.reach.
Two complementary cross-domain metrics tell contrasting stories (Figures 10 and 11). The mean composition (fraction of each paper’s citing set that is non-AI) ranks TB and WR above the non-catalyst baseline, with TI and RM below (two-sided Mann–Whitney \(p \leq 0.004\) for all four types). The reach metric (fraction of papers with \(\geq 1\) non-AI citing work) puts TI at the top of every non-AI domain: \(52\%\) Healthcare, \(17\%\) Biology, \(58\%\) Other-CS, exceeding every other group including non-catalysts. TI papers accumulate large total citation volumes that are AI-dominated in fraction but large enough in absolute numbers to reach many external fields, while TB and WR papers accumulate smaller footprints in which non-AI citations make up a larger share.
17.0.0.15 Two-scale picture.
TB and WR are high-intensity, narrow catalysts: proportionally more cross-domain, consistent with TB connecting topic clusters and WR generalizing methods adjacent fields pick up. TI are low-intensity, wide: absolute non-AI footprint dominates every domain, but AI citation pull makes the proportional signal small. RM are lowest on both metrics, reinforcing the under-recognition story from RQ3.
17.0.0.16 Data limitations.
(i) The \(10\)-page S2 pagination cap truncates citing-work lists at \(1{,}000\) per paper; for the \(5.8\%\) of papers that hit the cap, the saved sample
is biased toward later years of the three-year window (S2 returns citations newest-first). (ii) The non-AI label follows S2’s coarse fieldsOfStudy taxonomy: papers in interdisciplinary venues tagged primarily Computer Science are classified as
AI-core even when their topical focus is not. Both limitations push against our findings (they suppress, not inflate, the measured cross-domain signal), so reported effects are conservative.
17.0.0.17 TB threshold sensitivity.
We swept the TB flow-threshold percentile \(\in \{5\%, 10\%, 15\%, 20\%\}\) and descendant-topic floor \(\in \{2, 3, 5\}\) (\(12\) configurations). Mean post/pre flow growth ratio ranges \(14.5\times\)–\(17.2\times\); all \(12\) configurations exceed \(5\times\) (Table 13). The TB effect-size claim is therefore robust to threshold choice within a \(2\times\)–\(4\times\) window centered on the main-text canonical (\(10\%\), \(\geq 2\)).
| flow % | desc.floor | mean growth | median growth |
|---|---|---|---|
| 5 | 2 | 16.6 | 5.7 |
| 5 | 3 | 16.7 | 5.7 |
| 5 | 5 | 17.1 | 5.7 |
| 10 | 2 | 16.3 | 5.7 |
| 10 | 3 | 16.5 | 5.7 |
| 10 | 5 | 17.2 | 5.7 |
| 15 | 2 | 15.5 | 5.4 |
| 15 | 3 | 15.9 | 5.6 |
| 15 | 5 | 16.8 | 5.7 |
| 20 | 2 | 14.5 | 5.4 |
| 20 | 3 | 15.0 | 5.4 |
| 20 | 5 | 16.3 | 5.7 |
17.0.0.18 Propensity-matched TI controls.
To address the concern that TI papers might simply be more cited, we re-ran the topic-share-growth analysis using \(1\)-NN propensity-matched controls on \(\log(1{+}\text{citation count})\), acceptance, and year (caliper \(0.05\) in propensity space; logistic-regression propensity model with balanced class weighting). All \(3{,}063\) TI papers matched within caliper. The matched-control mean topic-share growth ratio is \(6.31\times\) (TI mean \(5.88\), control mean \(0.93\); Welch \(t = 44.0\), \(p < 10^{-300}\); Mann–Whitney \(p < 10^{-300}\)). The \(16\%\) drop from the year-matched-only \(7.55\times\) to the propensity-matched \(6.31\times\) quantifies how much of the original effect is explained by citation-count and acceptance differences; the residual effect remains large and highly significant.
17.0.0.19 TI threshold sensitivity.
A separate TI threshold sweep over growth ratios \(\in [1.25, 3.0]\) under a simplified within-year control definition yields TI/control ratios of \(2.92\times\) to \(3.24\times\), lower than the main-text \(7.55\times\). This reflects a methodological difference: the main-text TI analysis uses year-matched, different-topic controls constructed in the main analysis pipeline, whereas the simplified sweep uses year-matched, any-topic-with-non-TI-growth controls (a wider pool that includes within-topic non-TI papers whose topic shares were already growing for unrelated reasons). The qualitative finding that TI papers precede topic-share growth at a multiplicative rate above \(1\) holds in both formulations; the \(7.55\times\) figure depends specifically on the different-topic control design.
18 RQ3 Supplementary Analyses↩︎
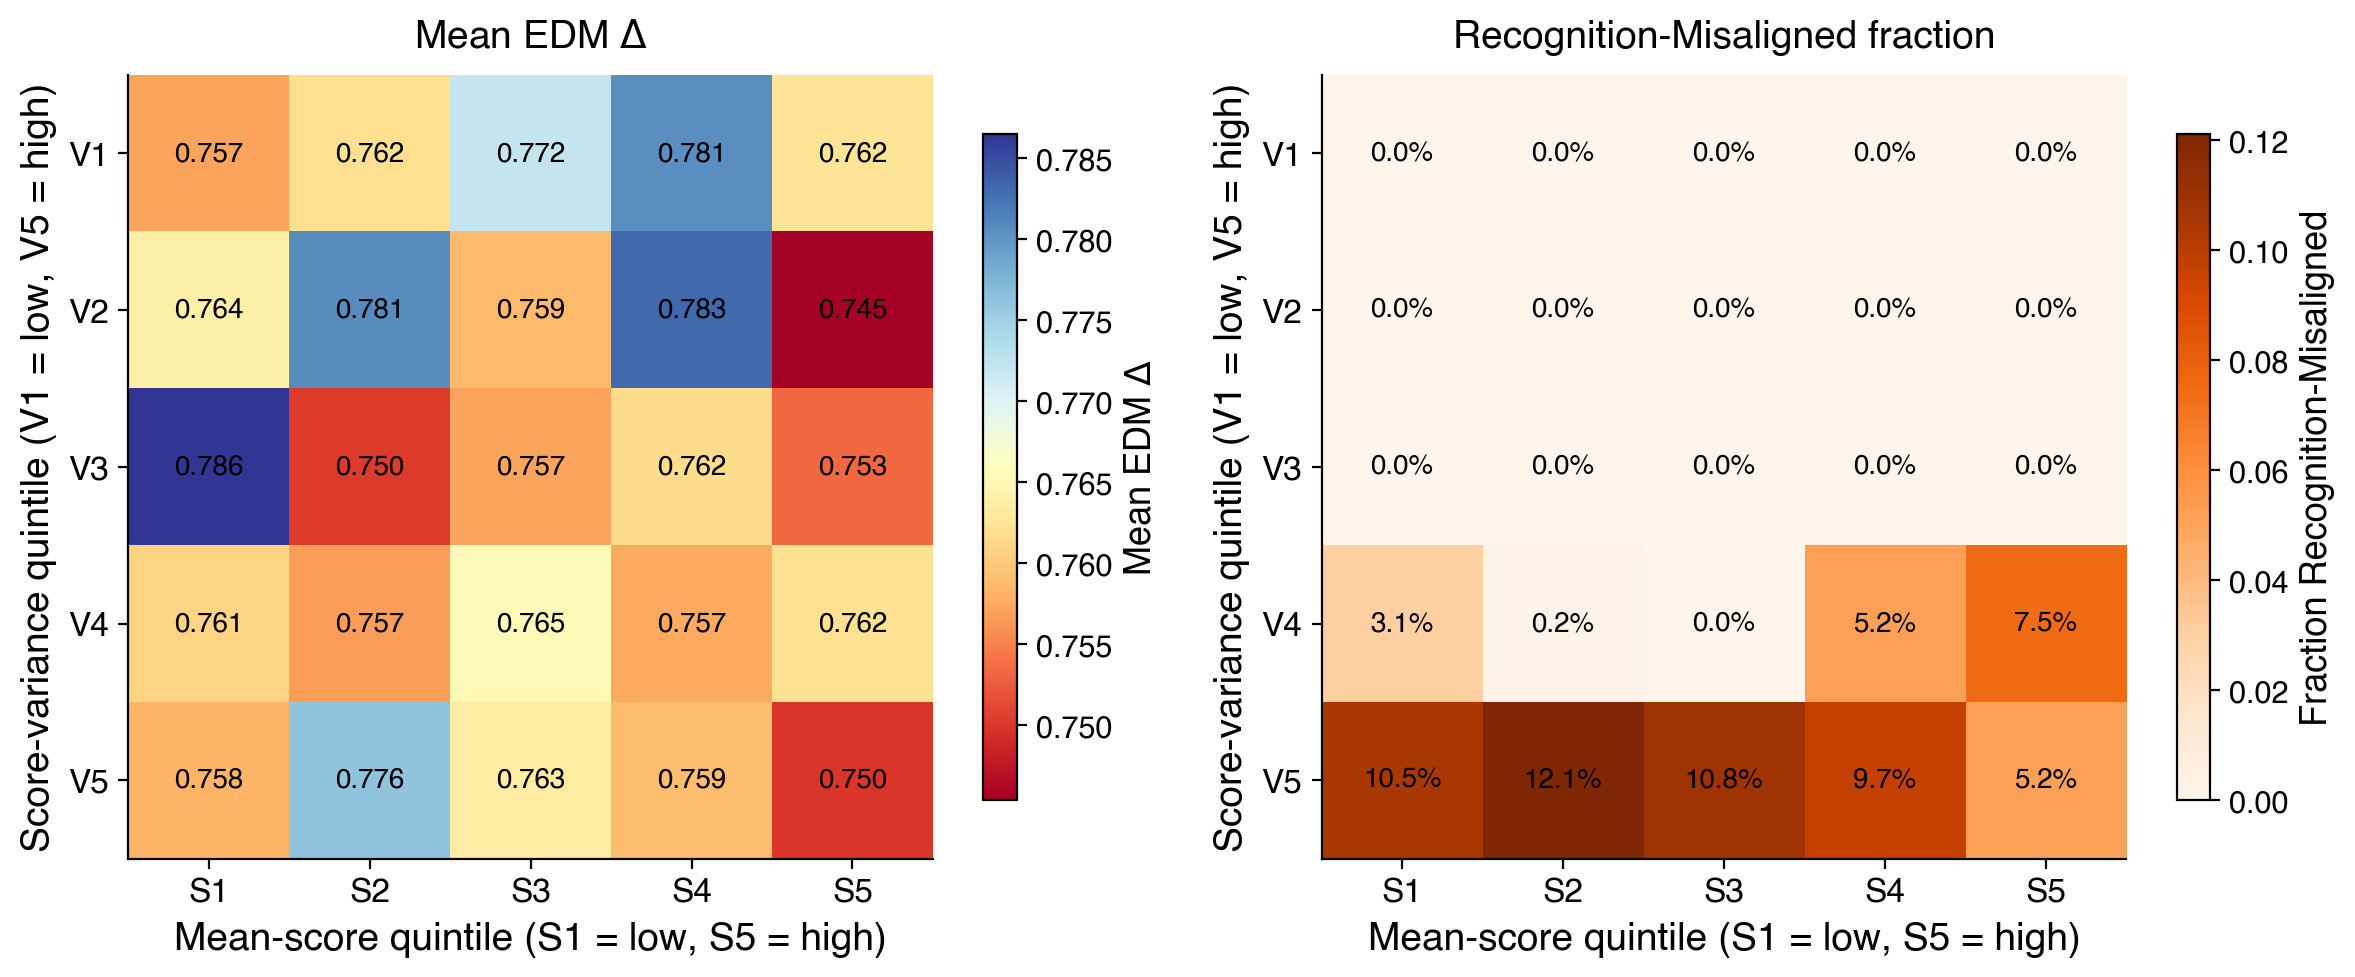
| Type | \(n\) | Gap | \(t\) | \(p\) |
|---|---|---|---|---|
| Non-catalyst | 15,723 | \(-0.103\) | — | — |
| TI (Topic Initiator) | 2,129 | \(-0.095\) | 0.89 | \(0.37\) |
| TB (Topic Bridge) | 3,386 | \(+0.145\) | 33.97 | \(<0.001\) |
| WR (Within-topic Red.) | 1,708 | \(-0.003\) | 9.16 | \(<0.001\) |
| RM (Recog.-Misaligned) | 1,119 | \(+0.590\) | 85.75 | \(<0.001\) |
| Over-valued (trendy) | Under-valued (niche) | ||||
| Topic | Gap | \(n\) | Topic | Gap | \(n\) |
| Text-to-Video Gen. | \(-0.265\) | 123 | Quantum ML | \(+0.193\) | 35 |
| Masked Image Modeling | \(-0.260\) | 44 | Active Learning | \(+0.093\) | 66 |
| Vision Transformers | \(-0.249\) | 106 | Safe RL | \(+0.090\) | 59 |
| Optimal Transport | \(-0.241\) | 94 | Text Embeddings | \(+0.073\) | 86 |
| State Space Seq.Mod. | \(-0.225\) | 51 | Recommendation Sys. | \(+0.073\) | 64 |
| Diffusion Image Gen. | \(-0.220\) | 687 | Efficient Sampling | \(+0.070\) | 45 |
| 3D Gen.w/Diffusion | \(-0.218\) | 79 | Meta-/Few-Shot Learn. | \(+0.066\) | 209 |
| Energy-Based Gen.Mod. | \(-0.216\) | 44 | Continual Learning | \(+0.058\) | 348 |
| Gen.Flow Matching | \(-0.216\) | 107 | Cross-ling.Align. | \(+0.052\) | 68 |
| Backprop.Alternatives | \(-0.207\) | 50 | Federated Learning | \(+0.050\) | 477 |


| \(\delta\) | \(n_{\text{bord.}}\) | \(n_{\text{clear}}\) | Bord.med. | Clear med. | Diff | \(p\) |
|---|---|---|---|---|---|---|
| \(0.25\) | \(179\) | \(6{,}988\) | \(2.485\) | \(1.792\) | \(+0.693\) | \(<0.001\) |
| \(0.50\) | \(441\) | \(6{,}726\) | \(2.303\) | \(1.792\) | \(+0.511\) | \(<0.001\) |
| \(0.75\) | \(800\) | \(6{,}367\) | \(2.398\) | \(1.792\) | \(+0.606\) | \(<0.001\) |
| \(1.00\) | \(1{,}457\) | \(5{,}710\) | \(2.398\) | \(1.609\) | \(+0.788\) | \(<0.001\) |
| Cutoff | \(\EDM\) thr. | Acc.(%) | Rej.(%) | Diff | Dir. |
|---|---|---|---|---|---|
| Top-10% | \(0.899\) | \(9.5\) | \(10.3\) | \(+0.83\) pp | \(✔\) |
| Top-5% | \(0.941\) | \(4.8\) | \(5.2\) | \(+0.41\) pp | \(✔\) |
| Top-1% | \(1.015\) | \(0.8\) | \(1.1\) | \(+0.25\) pp | \(✔\) |
19 Discussion: ICLR Setting and Program-Committee Implications↩︎
19.0.0.1 ICLR as a laboratory.
Three features of ICLR are essential for science-of-science work and unavailable in journal-based corpora. First, the OpenReview platform provides numeric reviewer scores and acceptance decisions for every submission, enabling direct measurement of reviewer calibration against long-run trajectory change, an analysis that is not feasible in journal-based science where review is private. Second, the dense arXiv preprint culture gives rejected papers a mechanism to remain in the scholarly record, producing the rare opportunity to measure false-negative rates on a well-defined sample (\(n=24{,}900\) rejections), of which \(71\%\) disappear, providing a baseline for how much potential disruption the ML and NLP community does not directly observe. Third, the compressed timescales mean that within a nine-year window, citation chains long enough to estimate EDM have already formed for papers published in 2017, which allows disruption to be studied near-prospectively rather than only retrospectively.
19.0.0.2 Peer review and recovery.
The disruption-blindness of ICLR review persists even through repeated review cycles: among the \(280\) papers rejected at ICLR and later accepted at a subsequent ICLR cycle, median \(\Delta\) is \(0.758\) vs. \(0.759\) for never-rejected papers (\(p{=}0.61\)); the field’s own re-evaluation does not filter on disruptiveness either. The rejected-paper analysis adds a sobering baseline: \(71\%\) of rejected papers disappear from the scholarly record entirely, so the recoverable false-negative population is far smaller than the raw rejection count implies. Borderline rejections (\(\log(1{+}\text{cit})\) median \(2.30\) vs.\(1.79\) for clear rejects) represent a tractable intervention target for program-committee design.
19.0.0.3 Actionable interventions for program committees.
The structured nature of the miscalibration suggests concrete interventions: (i) weight dissenting reviews more heavily for submissions that bridge multiple topic clusters (the catalyst type with the largest review-time miscalibration after RM); (ii) apply topic-specific score adjustments to correct for documented over-valuation of trendy areas (diffusion, ViT, SSMs) and under-valuation of niche areas (quantum ML, federated learning, safe RL); (iii) flag borderline-rejected papers for arXiv-cohort follow-up to identify high-impact false negatives. All three interventions are testable in OpenReview-instrumented future cycles.
20 Per-Measure Limitations and Robustness Analysis↩︎
The body-text Discussion and Limitations section summarizes the main limitations of the present analysis. This appendix records detailed bounds on each measure and validation step.
20.0.0.1 Citation network coverage.
The citation graph is restricted to ICLR-internal edges, constructed from Semantic Scholar reference lists with a \(77.1\%\) match rate against the ICLR corpus. Submissions rejected at ICLR and never reposted to arXiv or another indexed venue are not observed. Cross-disciplinary catalyst papers that enter ICLR from outside the ICLR community are not represented by the within-network measures (M1, M2, M3) and rely on M4 alone.
20.0.0.2 Coverage and recency.
M1 (CD) and M2 (node2vec) require ICLR-internal citers and produce undefined scores for papers without any in-corpus citers. This restricts their coverage to \(35\%\) and \(18\%\) of the corpus respectively, and they fail on most 2024–2025 ICLR Best Paper Award winners. M3 (EDM) covers \(62\%\) and M4 (LLM) covers the full corpus. For early-impact detection, only M3 and M4 are usable in practice.
20.0.0.3 EDM rank instability.
The validation AUC of M3 EDM is stable across walk-length \(T \in \{80, 160, 240\}\) and embedding dimension \(d \in \{64, 100, 128\}\) (ERS-AUC in \([0.72, 0.76]\); Appendix 12). Per-paper rank stability decomposes into two regimes. Cross-pipeline (sequential vs.parallel walk generation at matched hyperparameters) yields rankings statistically indistinguishable from independent, because Word2Vec skip-gram training is sensitive to the order in which walks are presented. Cross-seed within-pipeline (three seeds at the App-C sensitivity configuration) yields Spearman \(\rho = 0.55 \pm 0.05\) with top-decile Jaccard \(0.27\); a median-rank three-seed ensemble preserves the validation AUC. Distribution-level conclusions are therefore robust, but per-paper EDM ranks should not be interpreted across pipelines without an ensemble.
20.0.0.4 EDM canonical-follow-up blind spot.
By construction, EDM penalizes papers whose intellectual descendants stay close to the paper’s own antecedents. This downweights canonical follow-ups, including Score-Based Generative Modeling through SDEs and Analytic-DPM, which sit in the bottom quartile of EDM despite being widely recognized as field-shaping. The companion LLM rater M4 captures this class through content rather than citation topology, and we recommend reporting both measures jointly in any downstream use.
20.0.0.5 LAS statistical power.
The LLM-judge Annotation Set (LAS) contains \(50\) papers labeled by two independent runs of an LLM judge (claude-opus-4-6; run-to-run \(\kappa = 0.291\)). Union aggregation
yields \(9\) positive labels; intersection aggregation yields \(2\), which is insufficient for stable ROC-AUC estimation. The M4 LLM odds ratio of \(1.41\)
(\(p = 0.03\)) is therefore reported with wide confidence intervals. A larger validation pool with additional independent LLM judges, and ideally a human-annotated gold standard, is the most consequential extension for the
semantic-rubric agreement comparison.
20.0.0.6 LLM rater single-model dependence.
Full-corpus M4 scoring uses a single model (gpt-4o-mini). Inter-LLM agreement on a stratified \(2{,}000\)-paper subsample across five models from four vendors (gpt-4o-mini, gpt-4o,
claude-sonnet-4-6, llama-3.3-70b, qwen-2.5-72b) yields mean pairwise Spearman \(\rho = 0.60\) (Appendix 13, Table 3). A multi-prompt ablation and a systematic study of cross-vendor scoring bias are left to future work.
20.0.0.7 Simultaneous-discovery validation.
The citation-graph criterion for simultaneous discovery requires both candidate papers to have a non-trivial descendant-citer base. Sparse-citer pairs cannot be reliably evaluated by this protocol, so the reported precision applies to the densely-cited subset of candidates rather than to the raw cosine-ranked pool.