Rating the Pitch, Not the Product: User Evaluations of LLMs Reflect Expectations More Than Performance
July 06, 2026
Abstract
Imagine two users interact with the same LLM. One has been told it is the cutting-edge flagship model; the other, an older, weaker model. They walk away with markedly different ratings of its usefulness and intelligence, yet they used the same model. In a controlled study, 162 participants each used one of six LLMs from two families across three collaborative tasks, after first viewing a landing page that matched, overstated, or understated their model’s true capability. This pre-interaction framing shifted user opinions and interaction behavior while task performance did not. Oversold users rated the model more favorably and used more directive prompting, while Undersold users wrote longer, more collaborative prompts. The quality of what users and the model produced together depended only on the model’s true capability, not on what users were told. Participants’ change in model impressions after use, measured across two impression measures, was not predicted by task performance (\(\beta = -0.01\) and \(0.11\), both n.s.), but by whether the model met users’ expectations (\(\beta = 0.47\) and \(0.50\), both \(p < .001\)) and how confident they felt working with it (\(\beta = 0.47\) and \(0.36\), both \(p < .001\)). After interaction, users are still rating the pitch, not the product: user-elicited LLM evaluations, including the preference data driving public leaderboards, measure expectation management at least as much as the model itself.
1 Introduction↩︎
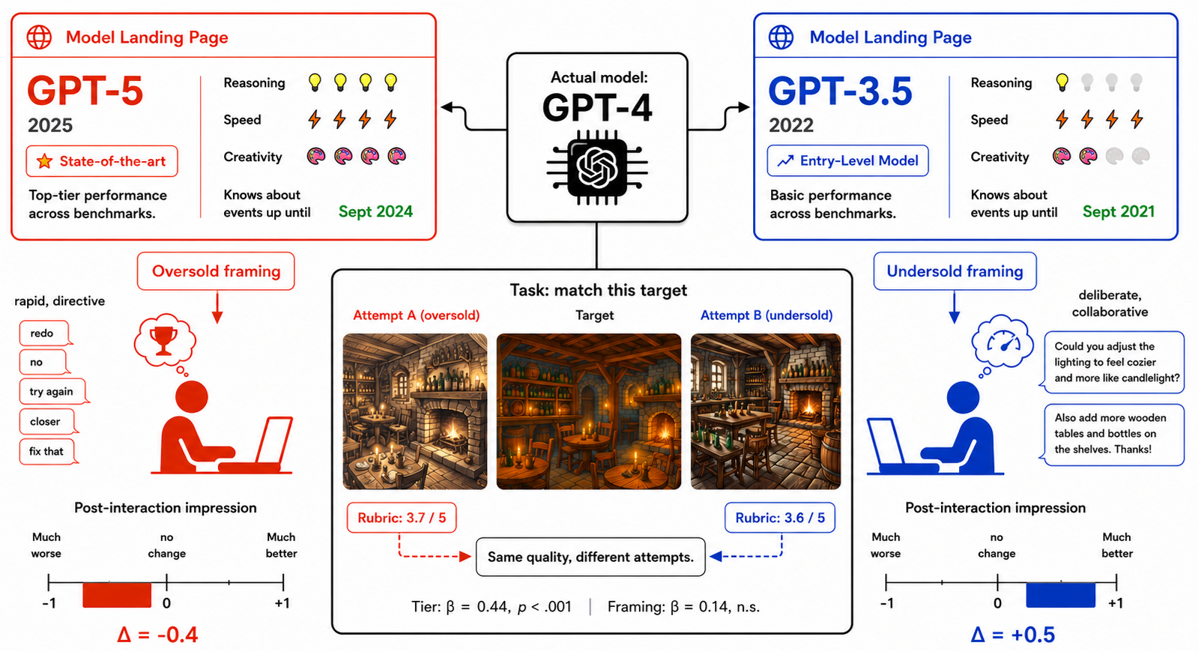
Most users meet an LLM before they actually meet it. They might have seen a benchmark score, a launch post, a leaderboard ranking [1], or heard a colleague’s recommendation. These pre-interaction signals may have lasting consequences for how users evaluate, adopt, and trust the systems they go on to use. Do initial expectations fade once users accumulate experience with the model, or do they persist? Do they only affect users’ impressions, or also how users interact with it and the quality of what they produce together? And when impressions do change after use, what drives that change: the quality of what the model produced, or something else about the experience?
Pre-interaction expectations are well-known drivers of technology evaluation, adoption, and abandonment [2], [3], and post-interaction impressions shape satisfaction often independently of objective performance [4], [5]. As LLMs become embedded in workflows where mismatched expectations can drive misuse or misplaced trust [6], how expectations evolve into impressions through use is consequential.
Work in human-AI interaction has begun to ask these questions. The framing of an AI system (the description users encounter before use) has been shown to shift judgments of trustworthiness [7], performance during collaboration [8], and sense of ownership over the resulting artifacts [9]. None, however, have followed users across iterative LLM use to ask whether these effects persist, generalize to behavior and output, or what sustains them. For LLMs, where users engage in multi-turn collaboration and capability is signaled through public benchmarks [10], marketing, and word of mouth, these questions matter for individual users and the preference-based evaluation pipelines that aggregate their judgments.
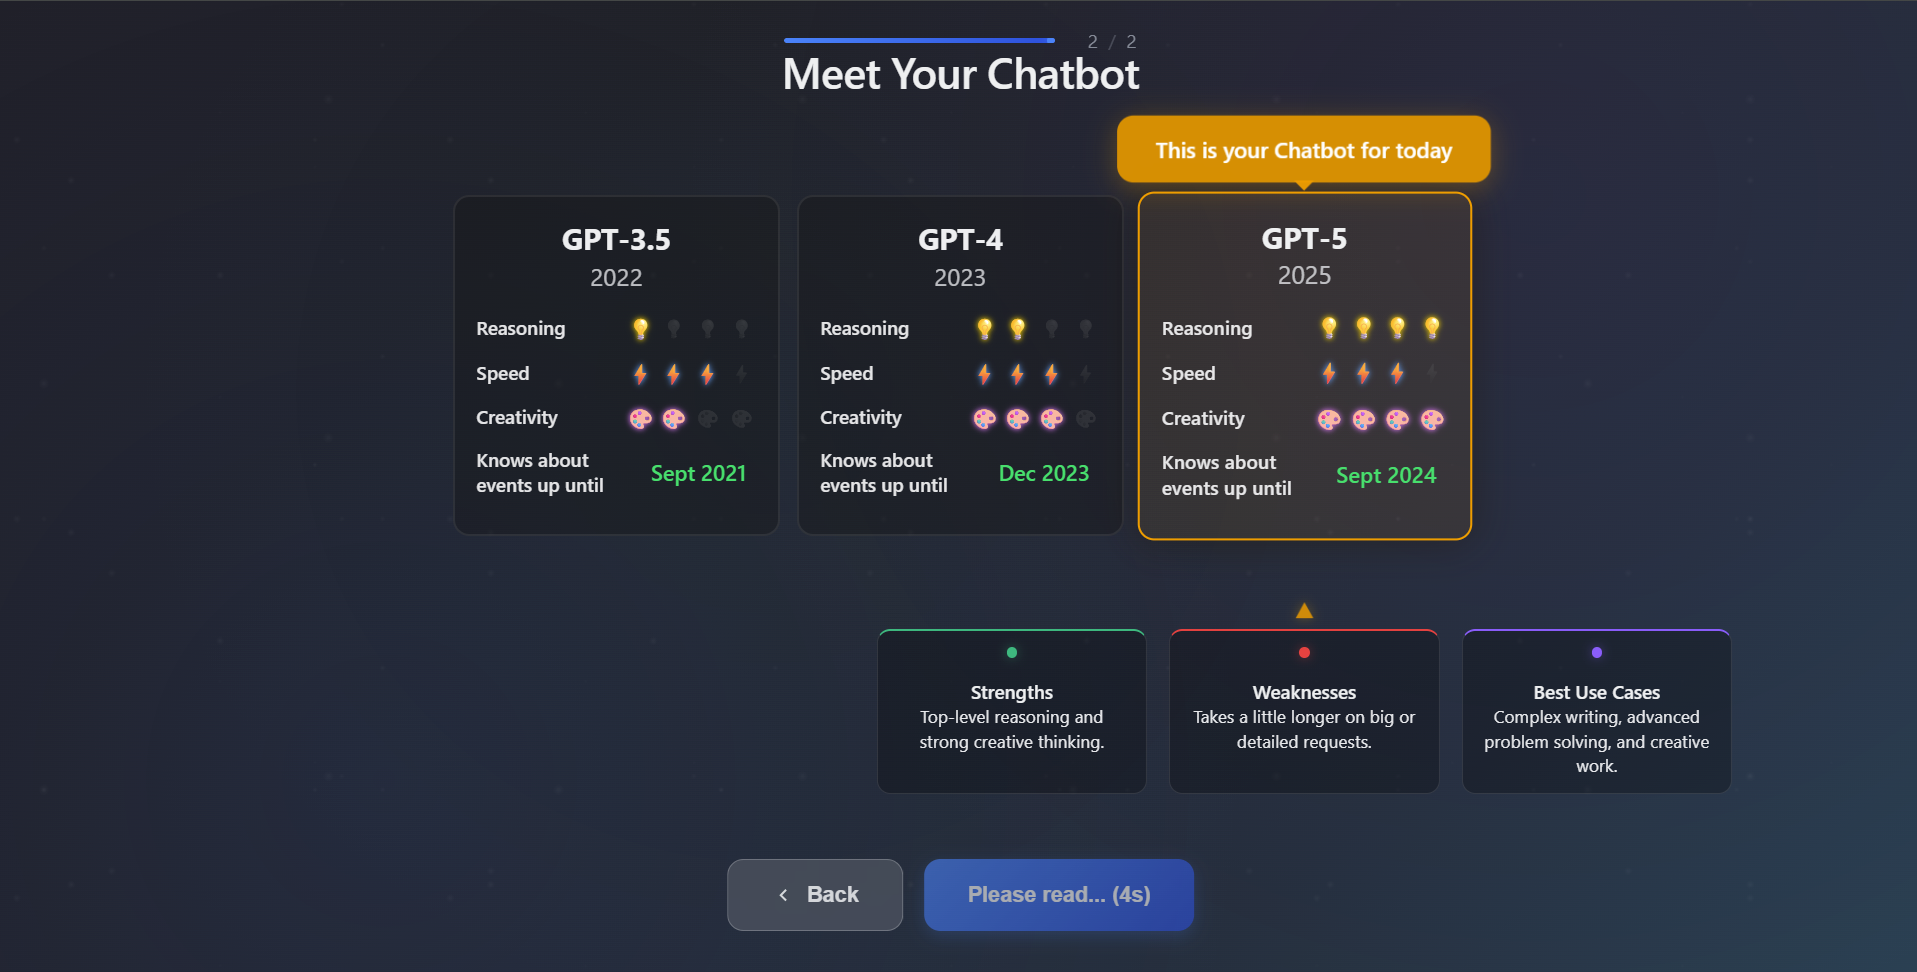
We ran a controlled between-subjects study with 162 participants, each randomly assigned to one of three framing conditions (Oversold, Matched, and Undersold) and to one of six LLMs from two model families (GPT & Claude). Before completing any work, each saw a landing page introducing a model from their assigned family, which did not always match the model actually serving them in the backend (Appendix Figure 10): Matched saw their true model, Oversold saw a higher-tier model (e.g., they were using GPT-3.5 but were shown GPT-5), and Undersold saw a lower-tier model (e.g., they were using GPT-5 but were shown GPT-3.5). All completed three collaborative tasks (image generation, outreach message writing, and acronym building). We measured user impressions of the model before and after the session, task-specific confidence before and after each task, interaction behavior from conversation logs, and the output quality. Figure [fig:overview] summarizes the design and central results.
The manipulation worked as intended: before interaction, Oversold participants rated the model’s expected usefulness and intelligence more highly than Undersold ones. After use, both groups updated toward reality (Undersold upward, Oversold downward), but the impression gap did not fully close. Framing also reshaped how users interacted, though not what they produced; what predicted impression change was whether the model met their expectations and how their confidence shifted, not the output itself. We establish three findings:
Pre-interaction framing of an LLM persistently shapes user impressions. Users in the Oversold condition rated models more favorably before use and less favorably after; the reverse held for those in the Undersold condition (§3.1).
Framing changes how users collaborate with the model, but not the quality of what they produce together. Under different framings, the same model produced different interaction behavior: Oversold users prompted more directively, Undersold users more collaboratively, with the divergence largest on the acronym task. Task performance did not vary with framing (§3.2, §3.3).
Impression change is driven by experience, not output. What predicts how users’ impressions of an LLM shift after using it is not their task performance with it, but whether the model met their expectations and how their task-specific confidence (i.e., their self-efficacy) changed (§3.4).
We situate these findings against prior work on framing effects, subjective versus objective AI evaluation, and human interaction behavior in §4.
The implications are broad. Users’ impressions of a model are partly set before any prompt is sent. For organizations deploying AI tools, how a tool is introduced may matter as much as the tool itself. For developers and benchmark designers, expectation-setting signals (benchmarks, marketing, interfaces) appear to drive user impressions more than capability differences users detect during use, particularly for open-ended tasks.
2 Methodology↩︎
To test whether pre-interaction framing of an LLM’s capability persists into use, and what drives impressions if it does, we crossed three framing levels (Oversold, Matched, Undersold) with three capability tiers (Bottom, Middle, Top) across two model families: GPT [11]–[13] and Claude [14]–[16]. 162 participants completed three collaborative tasks of varying objectivity; we measured impressions before and after, behavior during, and the quality of the final output.
2.1 Capability Framing↩︎
Each participant was introduced to their assigned model through a landing page before any interaction began (Appendix Figure 10). The page displayed the model’s name, release year, knowledge cutoff, and three capability scores (reasoning, speed, and creativity) on a 1–4 scale, alongside a comparison against other models in its family. The reasoning and creativity scores were derived from the model’s percentile rank on LMArena’s Hard Prompts and Creative Writing leaderboards, respectively1, at the time of the study; the speed score was derived from the latency metric from each provider’s model overview page.2 The capability tier shown was determined by the framing condition and did not always correspond to the model actually served by the backend.
Each family had three models at capability tiers ordered by public benchmark rankings at the time of data collection [1]. Table 1 lists the six source models and the shown names within each family, where every source model was paired with every shown tier, yielding nine source-by-shown combinations per family and 18 across the full design. Nine participants were assigned to each combination, for \(N{=}162\), balanced at 54 per framing condition, 81 per family, and 27 per source model. These numbers were determined by a pilot of 18 participants (one per source-by-shown cell) and a Monte Carlo power analysis targeting 80% power at \(\alpha = 0.05\). We also analyzed a framing extent metric (source tier minus shown tier, range \(-2\) to \(+2\)) to test for dose-response effects.
| Tier | Source model | Shown name |
|---|---|---|
| GPT family | ||
| Bottom | gpt-3.5-turbo-0125 | GPT-3.5 |
| Middle | gpt-4-0125-preview | GPT-4 |
| Top | gpt-5-2025-08-07 | GPT-5 |
| Bottom | claude-3-haiku-20240307 | Claude 3 |
| Middle | claude-3-5-haiku-20241022 | Claude 3.5 |
| Top | claude-sonnet-4-20250514 | Claude 4 |
2.2 Tasks↩︎
Participants completed three tasks in the same order: image generation, outreach message writing, and acronym building.
2.2.0.1 Image generation.
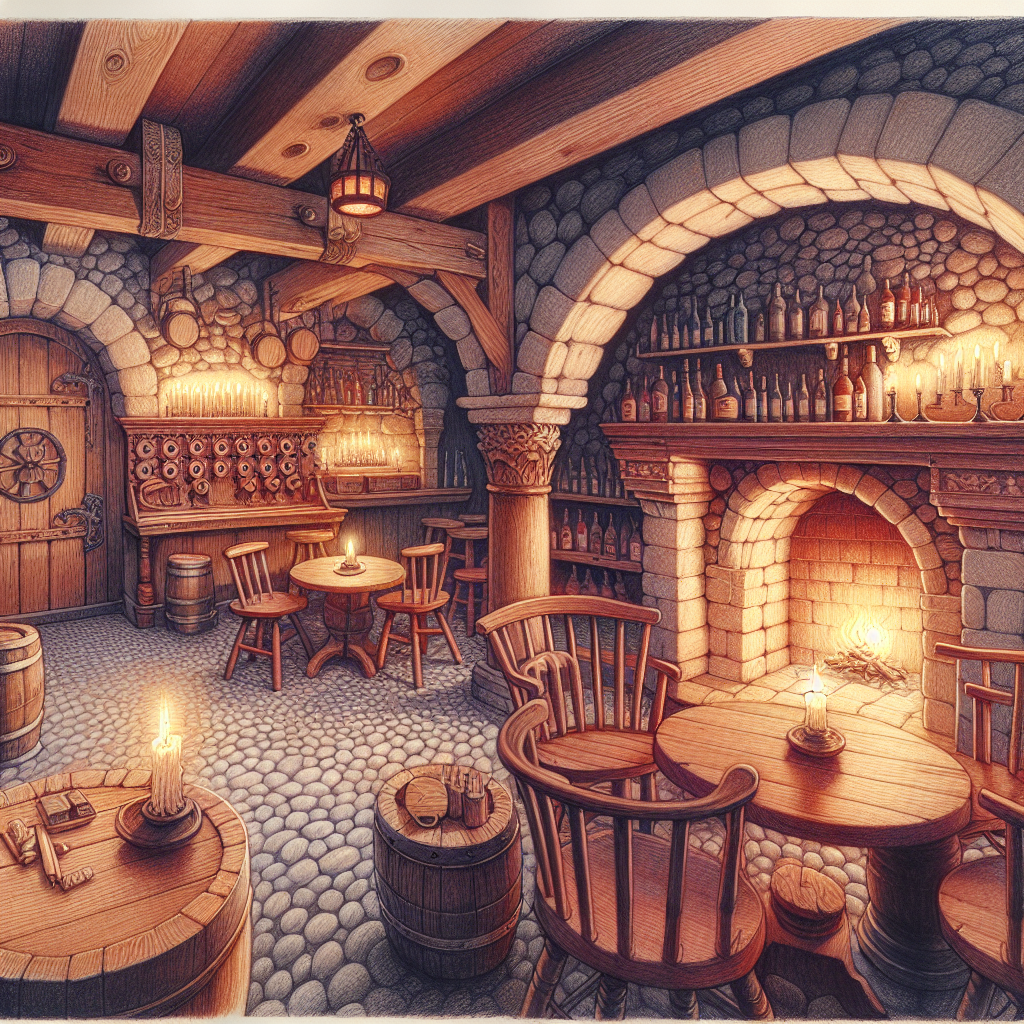
Participants worked with the model to generate an image resembling the target image as closely as possible (Appendix Figure 14).
2.2.0.2 Outreach message writing.
The task was to draft a persuasive outreach message for a sales role application (Appendix Table 7). The message had to fulfill several requirements: (a) reference the job description, (b) be signed “J. Doe”, (c) be addressed to “Dr. Rogers”, and (d) read as if written by a human rather than an AI tool.
2.2.0.3 Acronym building.
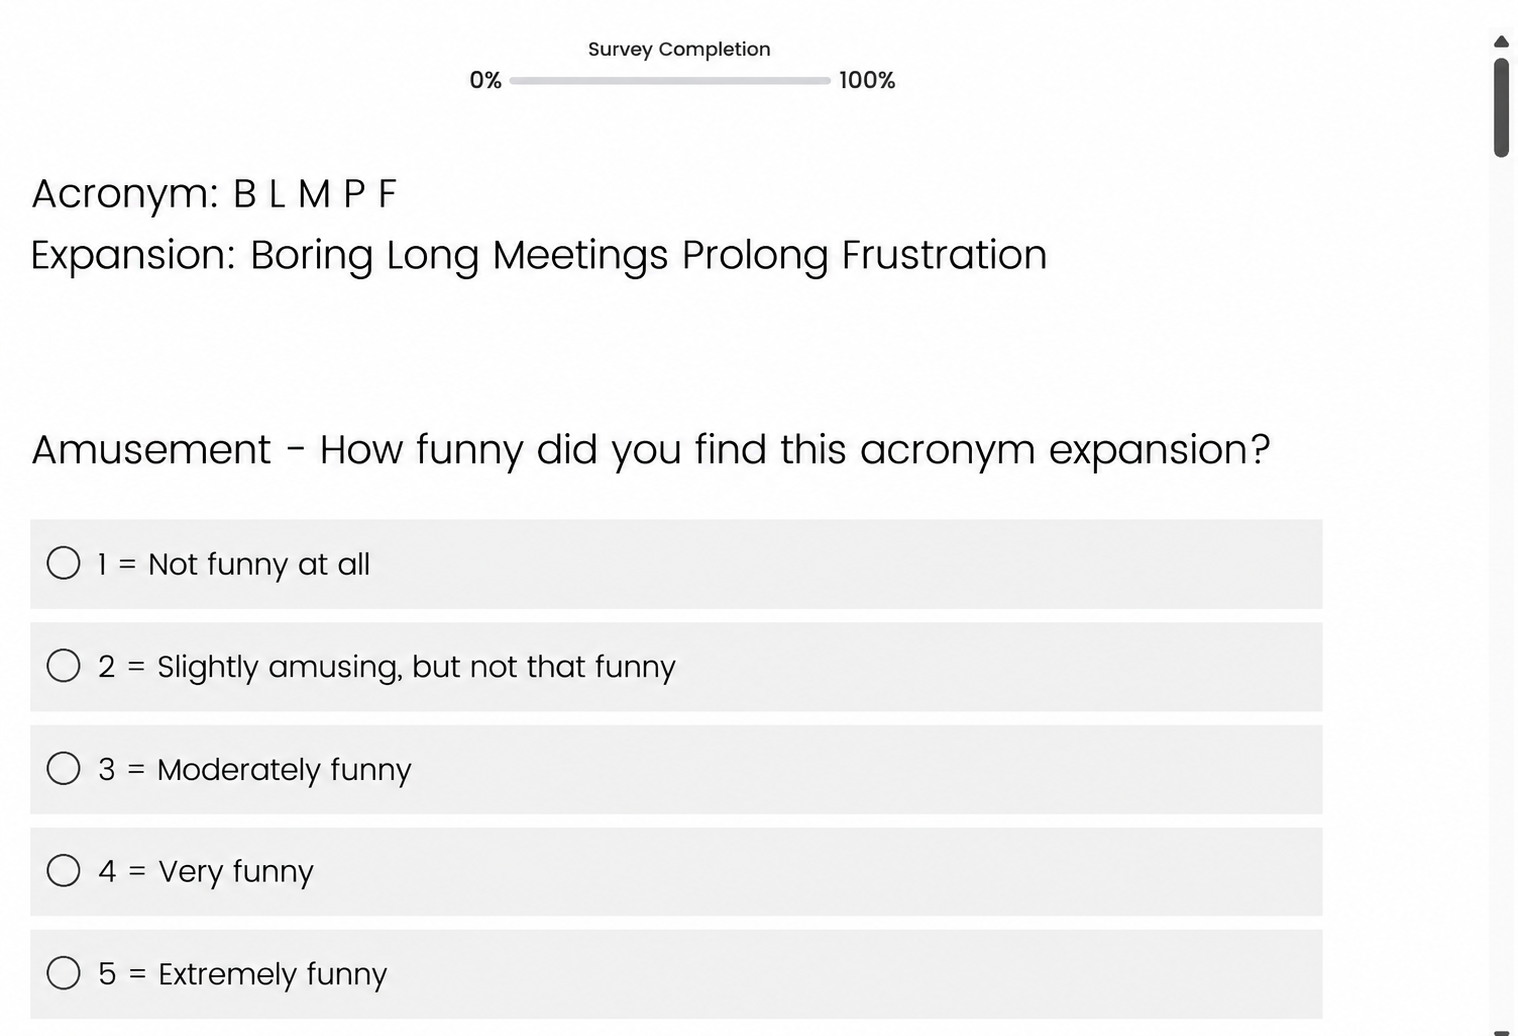
The goal was to generate humorous acronyms from three letter sets: (a) B L M P F, (b) C R T W, and (c) Y O L D. With no objectively correct answer or specific requirements to fulfill, quality depended entirely on the participant’s creative direction in collaboration with the model.
All tasks required sustained, iterative collaboration with the model rather than single-turn prompting. The tasks were chosen to reflect varying levels of objectivity: the first has a fixed external target, the second is anchored to a written brief, and the third is fully open-ended and subjective. This spread allows us to observe whether framing effects vary with how much the user’s own creative input shapes what counts as a good output. Participants were told each task required at least five minutes of interaction and the highest-scoring submission per task would earn a $10 bonus.
2.3 Measures↩︎
2.3.0.1 Impressions.
The Unified Theory of Acceptance and Use of Technology (UTAUT) Performance Expectancy and Effort Expectancy subscales [17] capture usefulness and ease of use (Appendix Table 4); the Godspeed Perceived Intelligence subscale [18] captures perceived intelligence (Appendix Table 6). Both were administered before the study (future tense) and after (past tense).
2.3.0.2 Self-efficacy.
Self-efficacy refers to a person’s belief in their ability to perform a task [19]. We adapted the New General Self-Efficacy scale into eight task-specific items, completed before and after each task, to capture how participants’ self-efficacy in working with the model changed across the study (Appendix Table 5).
2.3.0.3 Expectations met.
After each task, participants rated if the model fell short, met, or exceeded their expectations for that task on a three-point scale.
2.3.0.4 Behavior.
From each participant’s task conversation logs, we extracted 17 behavioral metrics, covering message counts and lengths, keystroke and backspace counts, edit events, session and idle time, and time between messages (full list in Appendix Table 11). Each user message was classified as collaborative or directive by claude-haiku-4-5, using a prompt grounded in searle_1976?’s illocutionary taxonomy and [20]’s work on collaborative engagement (prompt and method in Appendix 6.4).
2.3.0.5 Output quality.
Each final task submission was scored by GPT-5 against a task-specific rubric on a 1–5 scale across four dimensions, averaged over three scoring runs (Rubric in Appendix Table 8; full prompt and method in Appendix 6.5). Overall performance was the equal-weighted mean across all tasks. Human raters validated the judge on a subset of submissions, where its correlation to humans across tasks was similar to humans’ correlation to each other (Appendix 6.6).
Examples of high- and low-scoring submissions for image generation are shown in Figures 12 and 13, for outreach messages in Table 9, and for acronyms in Table 10, of Appendix 6.3.
2.4 Participants and Procedure↩︎
2.4.0.1 Recruitment.
We recruited 162 US-based workers through Prolific, all of whom were fluent in English, had a 98–100% approval rate, and had completed more than 100 prior studies. Assignment to the 18 source-by-shown cells was managed by an SQL database that atomically reserved an open cell for each incoming participant, preventing race conditions and maintaining the balanced design across the full data collection period. All study procedures were approved by the authors’ institutional research ethics board prior to data collection, and all participants provided informed consent before beginning the study.
2.4.0.2 Procedure.
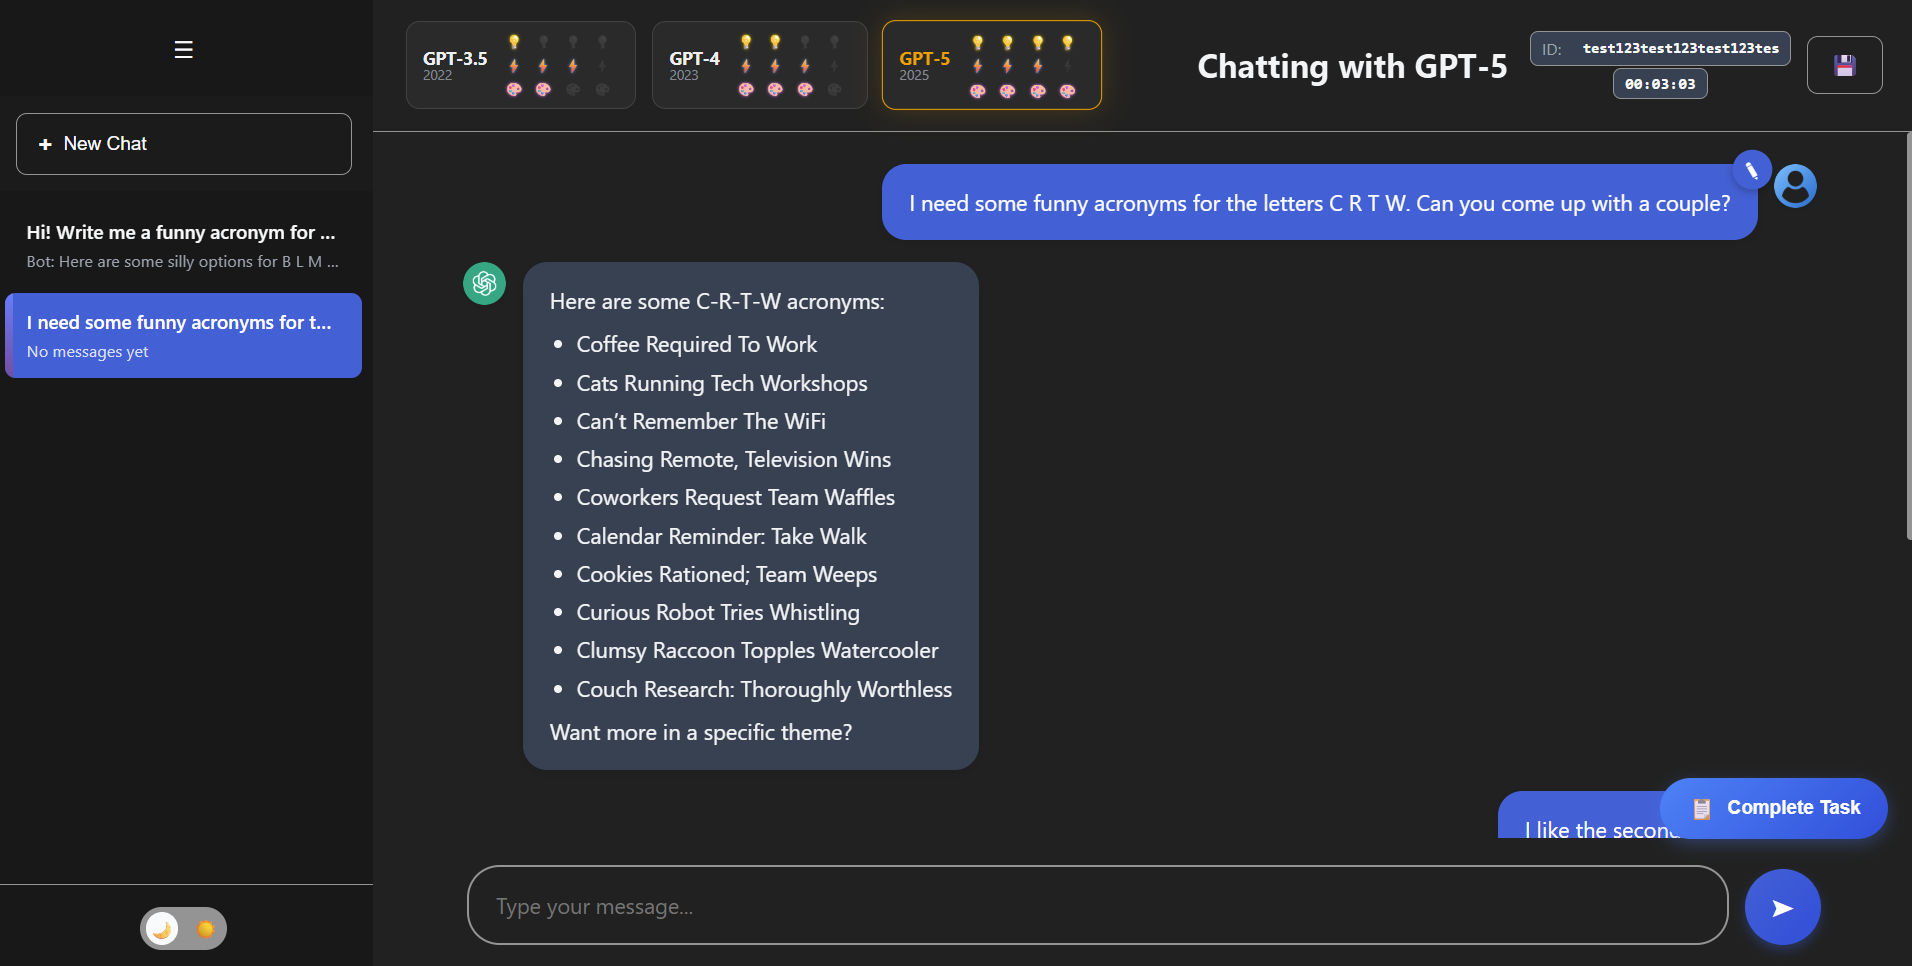
The study was administered across Prolific, Tally, and a custom web-based chat interface powered by the source LLM (Appendix Figure 11). After consent and pre-study UTAUT and Godspeed surveys, participants viewed the landing page (manipulation) and passed a 3-item manipulation check. They then completed the three tasks in sequence, each bracketed by the self-efficacy scale, and rated whether the model met their expectations after each. Post-study UTAUT and Godspeed surveys closed the session.
2.4.0.3 Data integrity.
To detect automated or low-effort participation, we implemented layered checks. Each task page contained a honeypot button invisible to human users but detectable by browser automation agents, hidden DOM elements with task-specific seeded keywords later searched in conversation logs, and browser-environment checks flagging known indicators of automation. The pre- and post-study surveys and the outreach task survey included three embedded attention check items (Appendix 6.1). All submissions were manually reviewed after data collection for engagement quality and task adherence; those that did not sufficiently engage with the model, did not adhere to task instructions, or showed clear signs of AI usage were removed and replaced through new recruitment.
2.5 Analysis↩︎
2.5.0.1 Codings and outcomes.
Analyses were conducted in R. Framing was coded \(\{-1, 0, +1\}\) (Under/Matched/Over) and model tier \(\{-1, 0, +1\}\) (Bottom/Middle/Top); framing extent was used as an integer covariate (\(-2\) to \(+2\)). Impression scores are mean item ratings for the UTAUT and Godspeed respectively; impression change scores are post- minus pre-scales averages (i.e., \(UTAUT_{post} - UTAUT_{pre}\) and \(Godspeed_{post} - Godspeed_{pre}\)). Self-efficacy change is computed per task (\(SE_{post} - SE_{pre}\)) and averaged across the three tasks. Overall performance is the equal-weighted mean of the three task-level judge scores.
| Measure | Condition | Mean | SD |
|---|---|---|---|
| Pre-UTAUT | Oversold | 4.21 | 0.65 |
| Matched | 4.05 | 0.73 | |
| Undersold | 3.96 | 0.54 | |
| Oversold | 5.46 | 1.05 | |
| Matched | 5.33 | 1.04 | |
| Undersold | 4.79 | 0.97 |
2.5.0.2 Statistical tests.
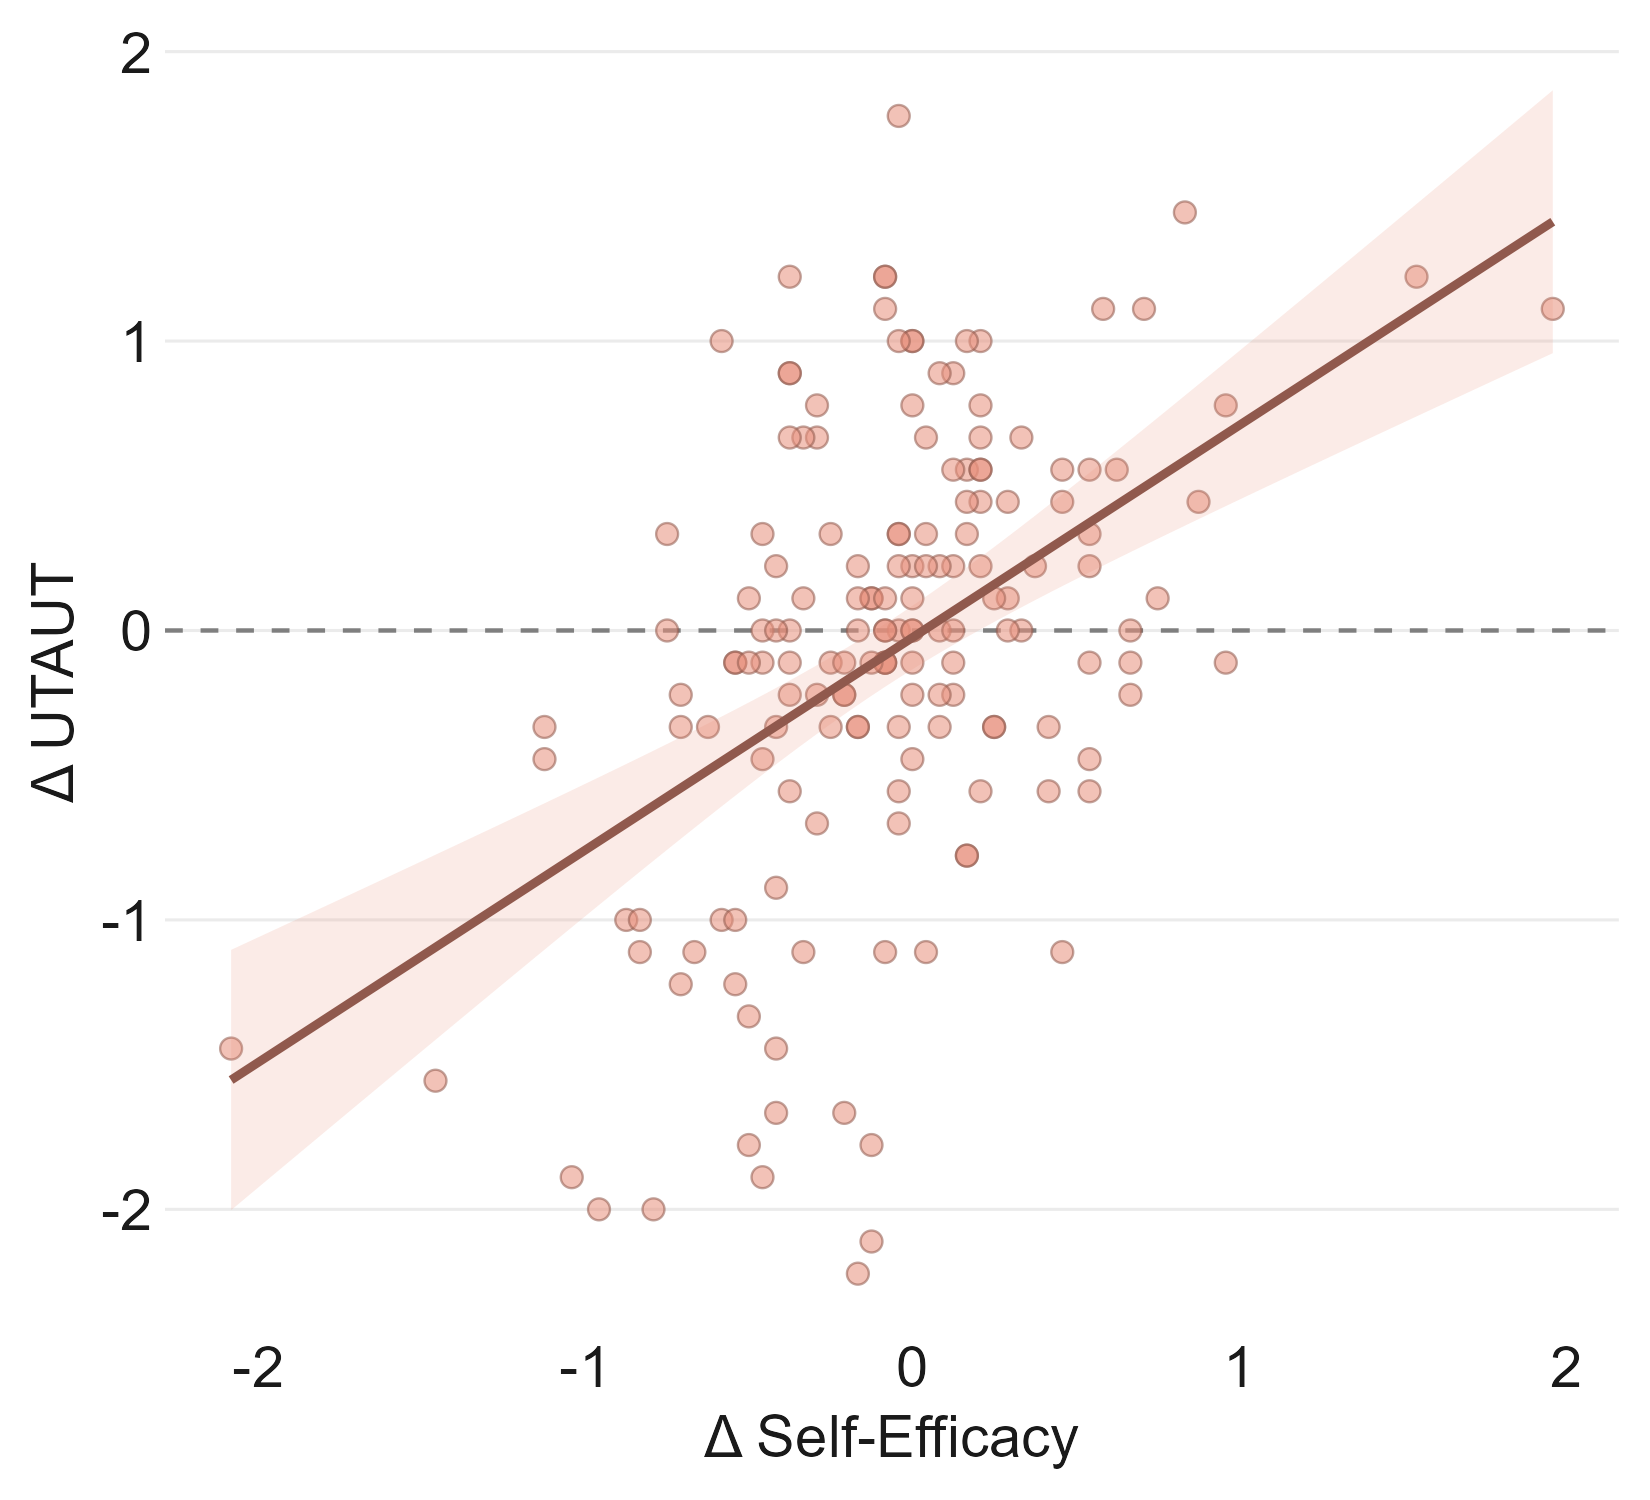
We used independent-samples \(t\)-tests with Cohen’s \(d\) for pre-study impression contrasts (§3.1). Bar-chart figures show group means with \(95\%\) CIs. OLS regression was used for the framing-extent dose-response model (§3.1, Figure 3, jointly with source tier) and the performance regression on framing and model tier (§3.3). For §3.4, we ran six bivariate OLS regressions of each impression-change outcome on three predictors: task performance, self-efficacy change, and expectations met.
2.5.0.3 Multiple comparisons.
All \(p\)-values are reported uncorrected. Our safeguard against false positives is built into the design: each effect of theoretical interest is tested independently on two impression measures (UTAUT and Godspeed) that draw from different validated instruments, and in §3.4 against two independent experiential predictors (self-efficacy change and expectations met). All central effects in §3.1 and §3.4 replicate across both impression outcomes and, where applicable, both predictors, providing design-level robustness rather than relying on \(\alpha\)-adjustment.
3 Results↩︎
3.1 Framing of an LLM persistently shapes user impressions↩︎
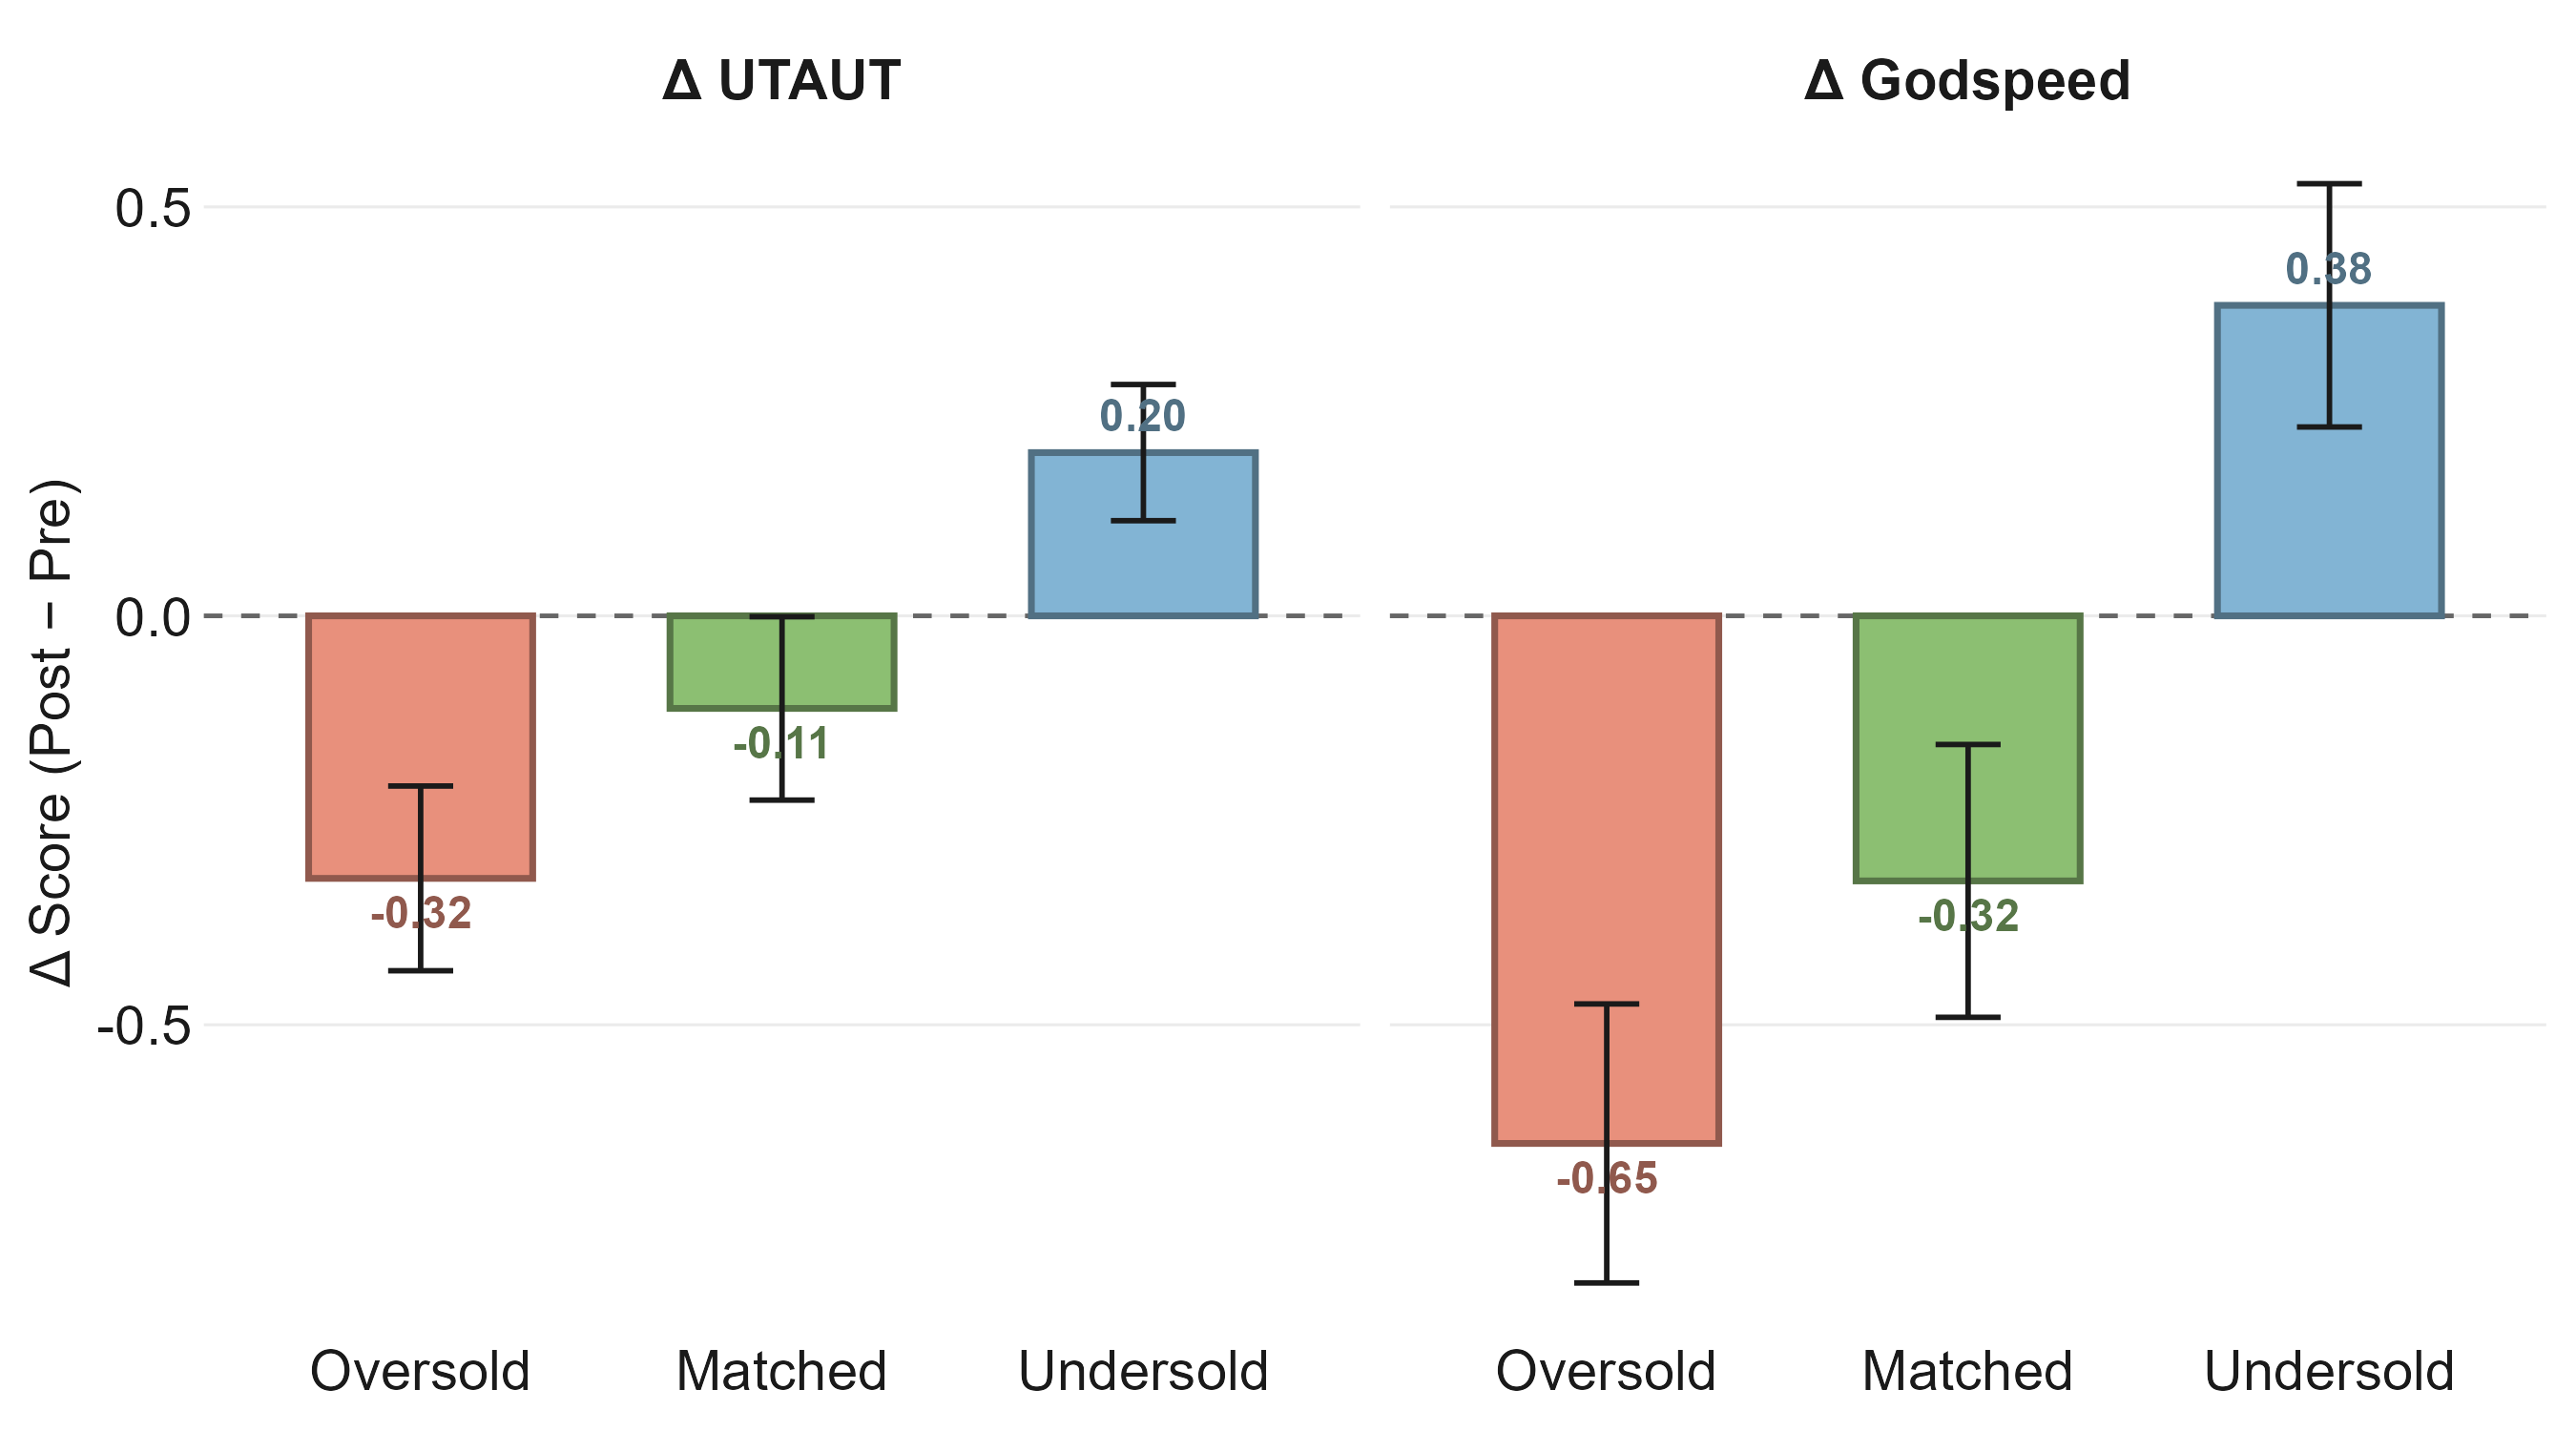
Before interaction, framing produced a clear ranking of impressions. Oversold participants entered with the highest ratings (UTAUT \(M{=}4.21\), Godspeed \(M{=}5.46\)) and Undersold the lowest (\(M{=}3.96\) and \(M{=}4.79\)), with Matched in between (Table 2). The contrast between Oversold and Undersold was significant on both pre-UTAUT (\(p{=}0.029\), \(d{=}0.43\)) and pre-Godspeed (\(p{=}0.0009\), \(d{=}0.66\)) (pairwise contrasts in Appendix Table 12). The effect was larger on Godspeed than on UTAUT, indicating that perceived intelligence is more sensitive to framing than expected performance or effort.
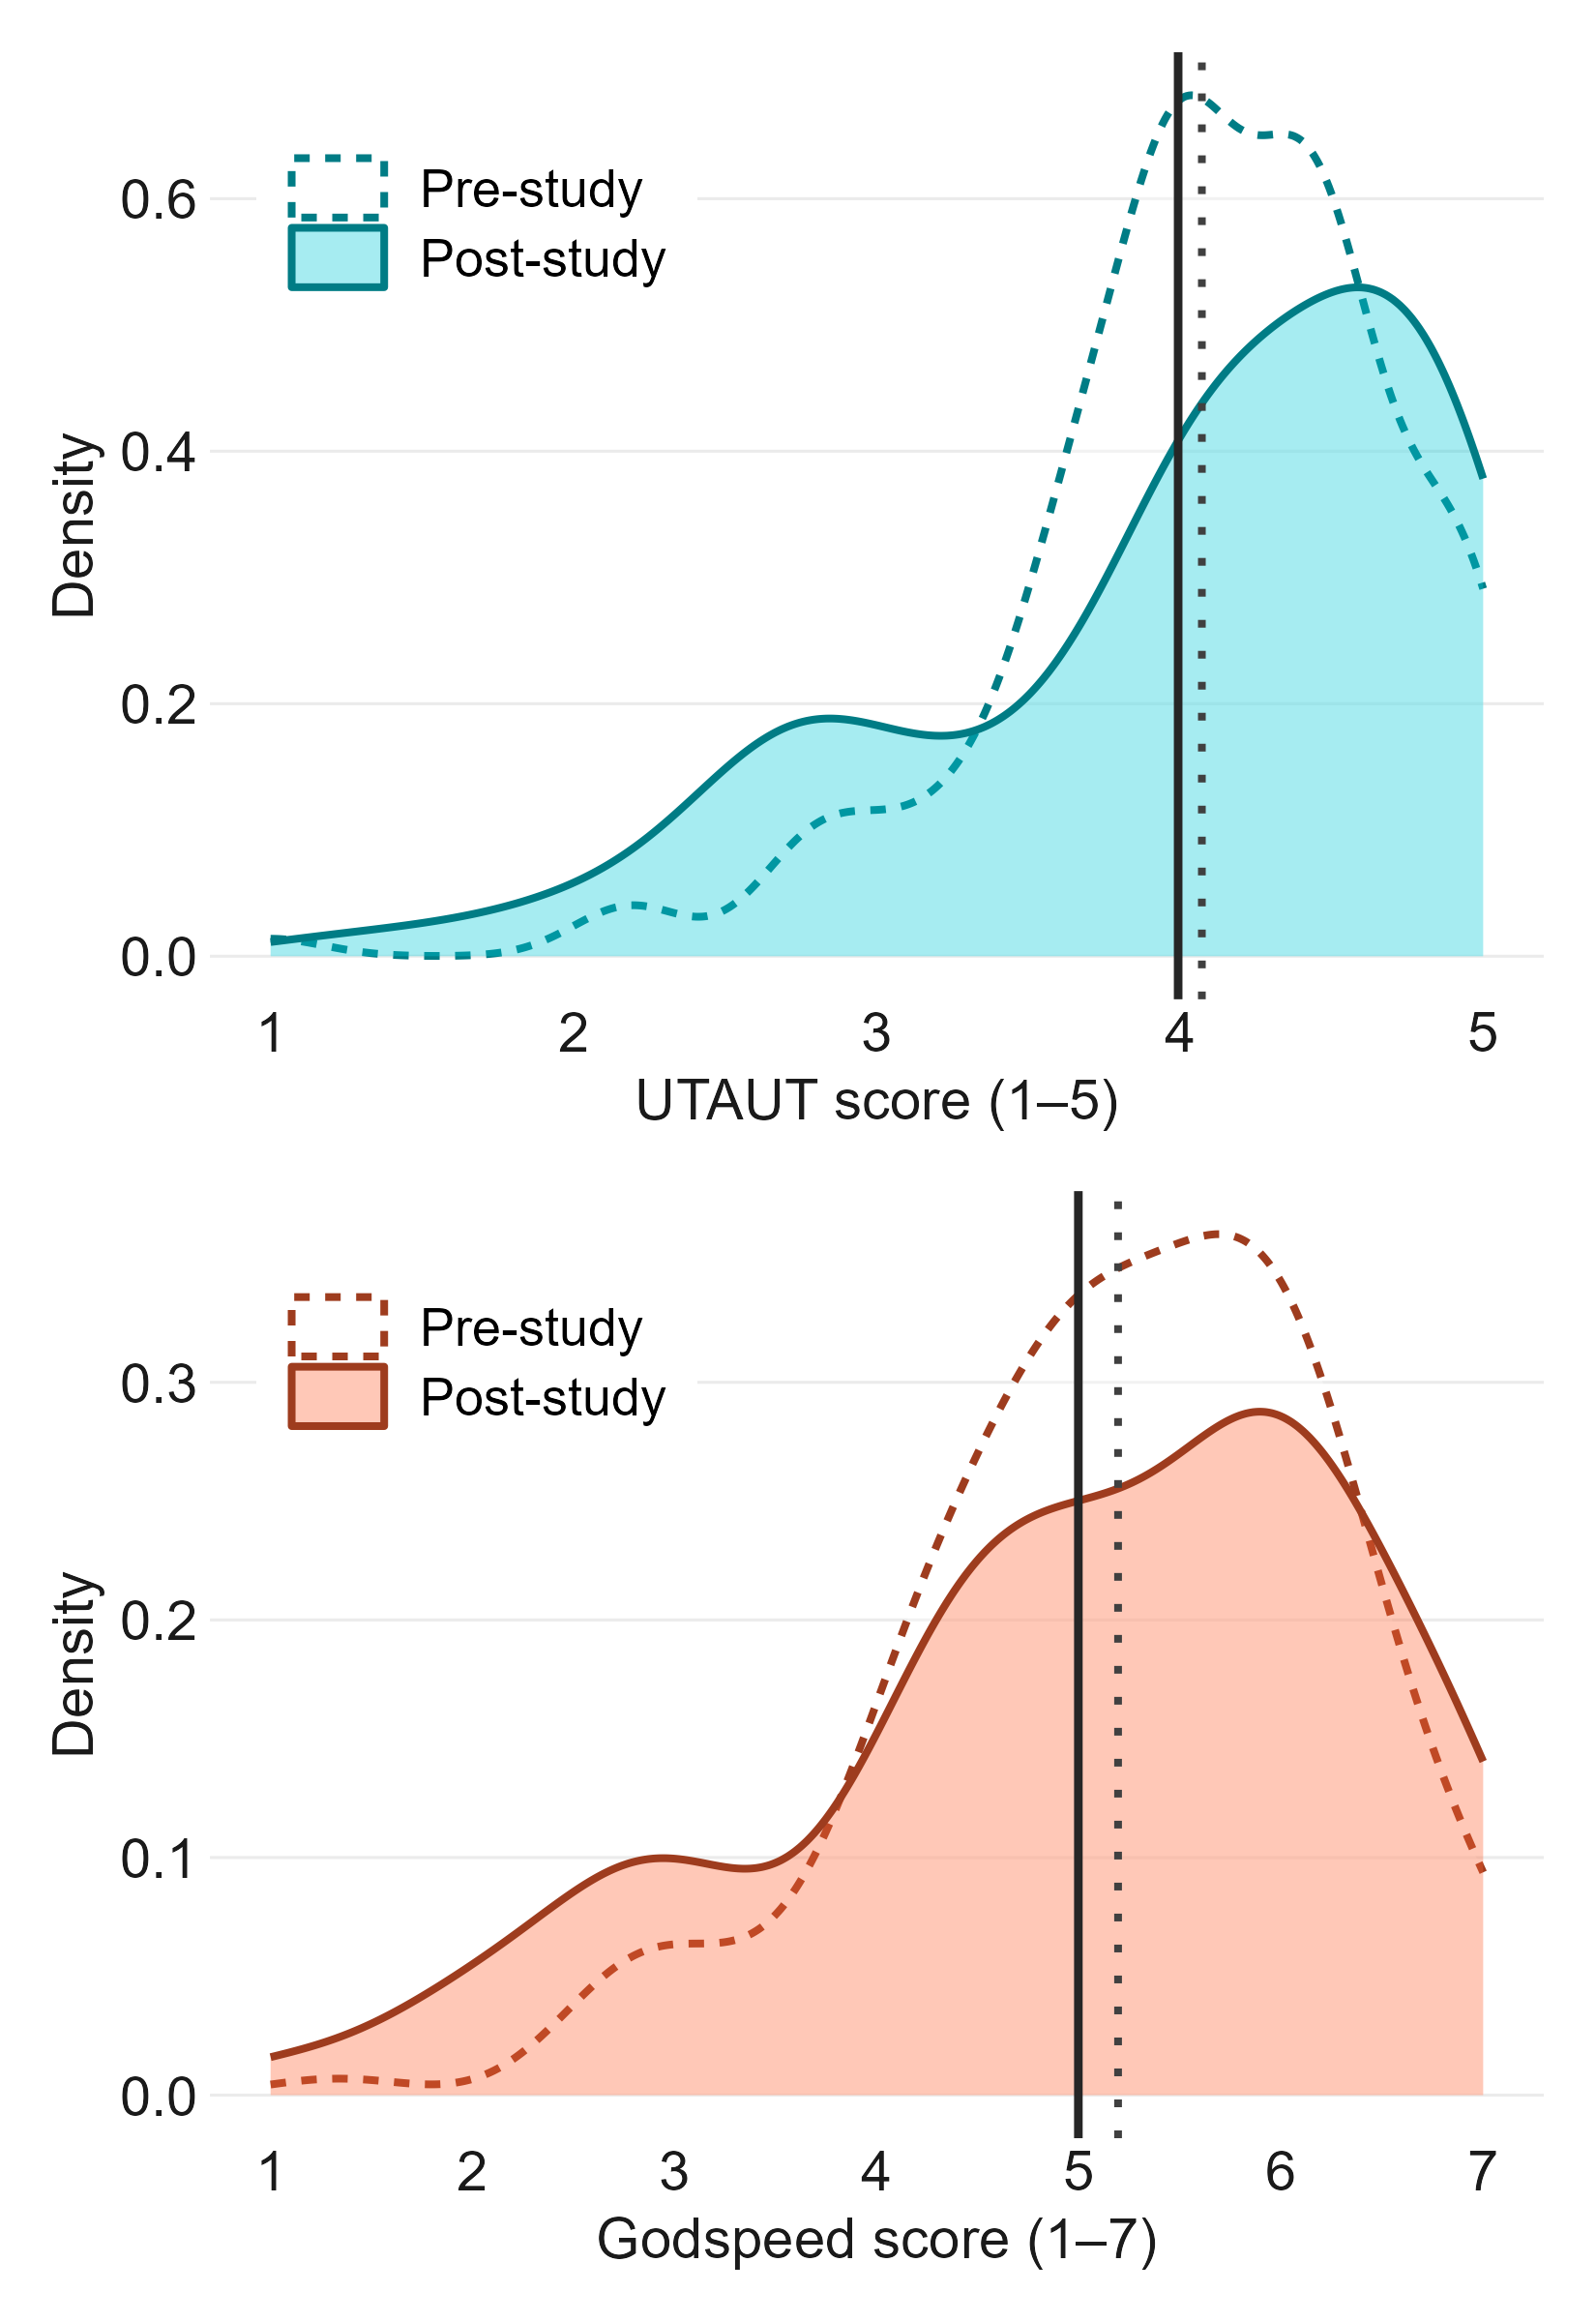
After interacting with the models, participants’ ratings shifted according to the models’ performance, but remained differentiated across conditions (Figure 2). Undersold participants updated upward, Oversold updated downward, and Matched drifted slightly downward, suggesting that even an accurately described model can mildly underwhelm. The pattern held for both scales (pre- and post-study distributions in Appendix Figure 18).
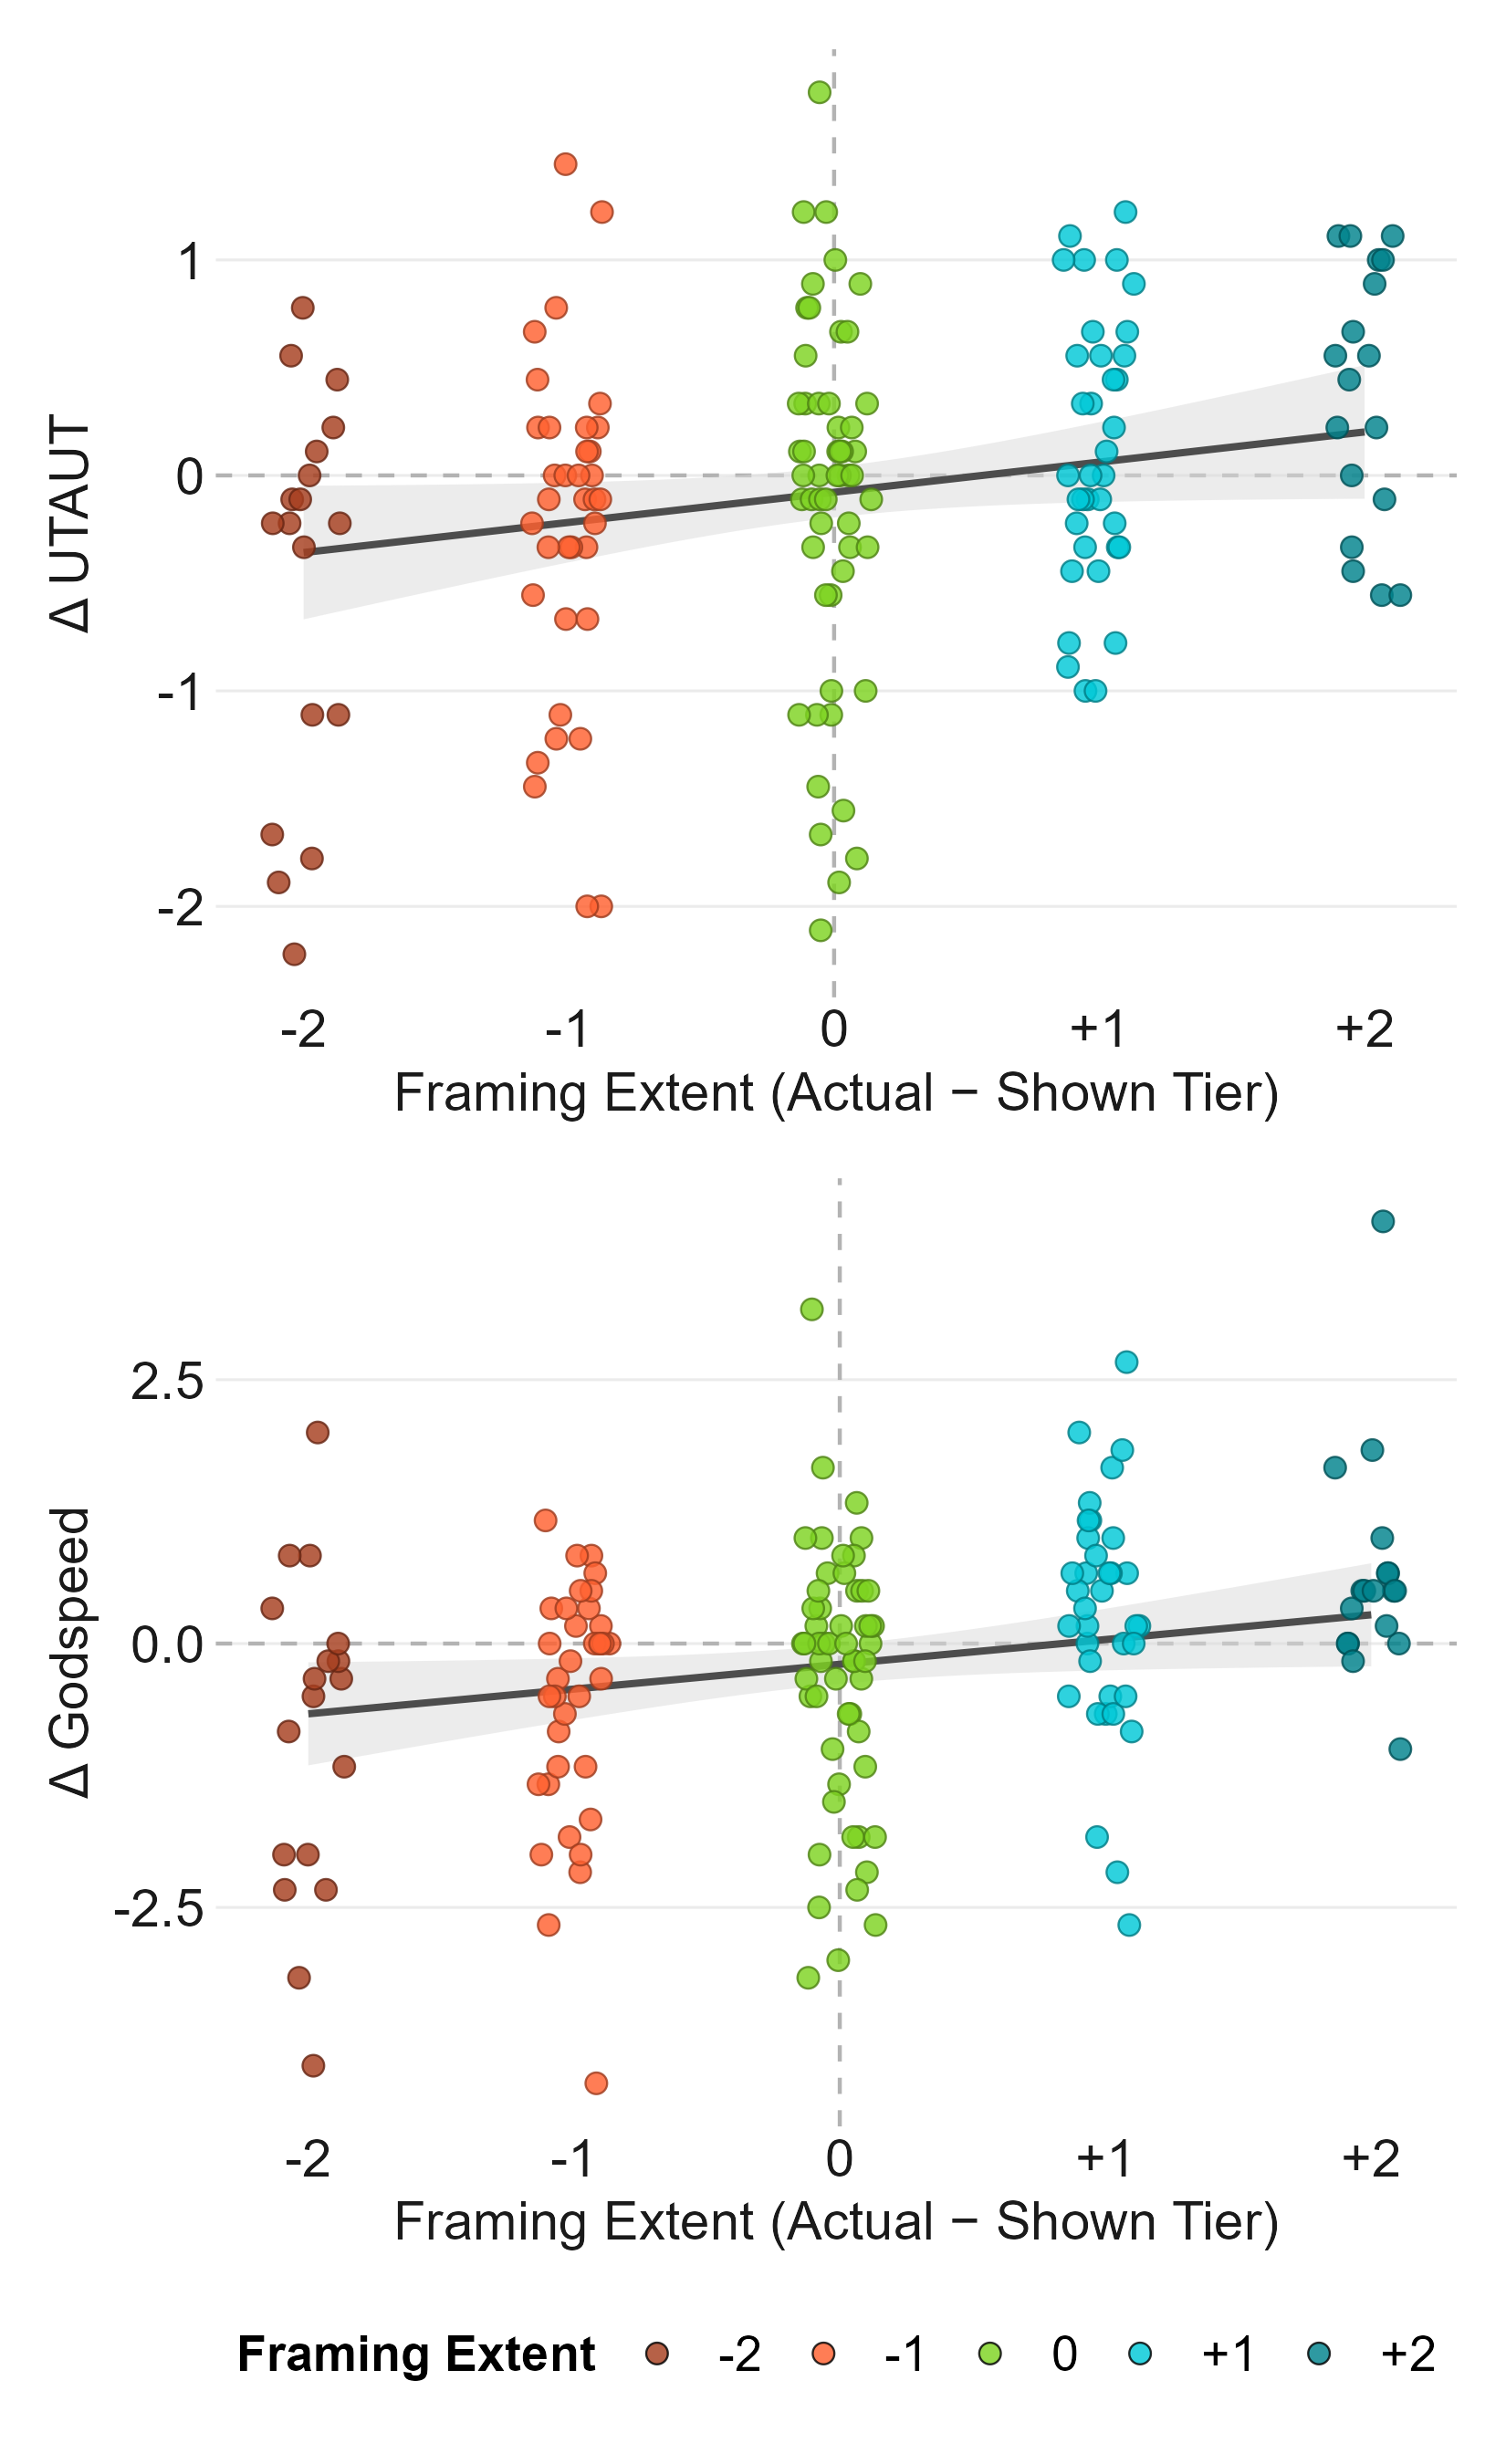
Impression change followed a dose-response relationship with framing extent: controlling for source tier, both \(\Delta_{\mathrm{UTAUT}}\) and \(\Delta_{\mathrm{Godspeed}}\) rose monotonically (Figure 3). The more undersold the framing, the larger the upward update; the more oversold, the larger the downward update.
3.2 Framing changes interaction behavior↩︎
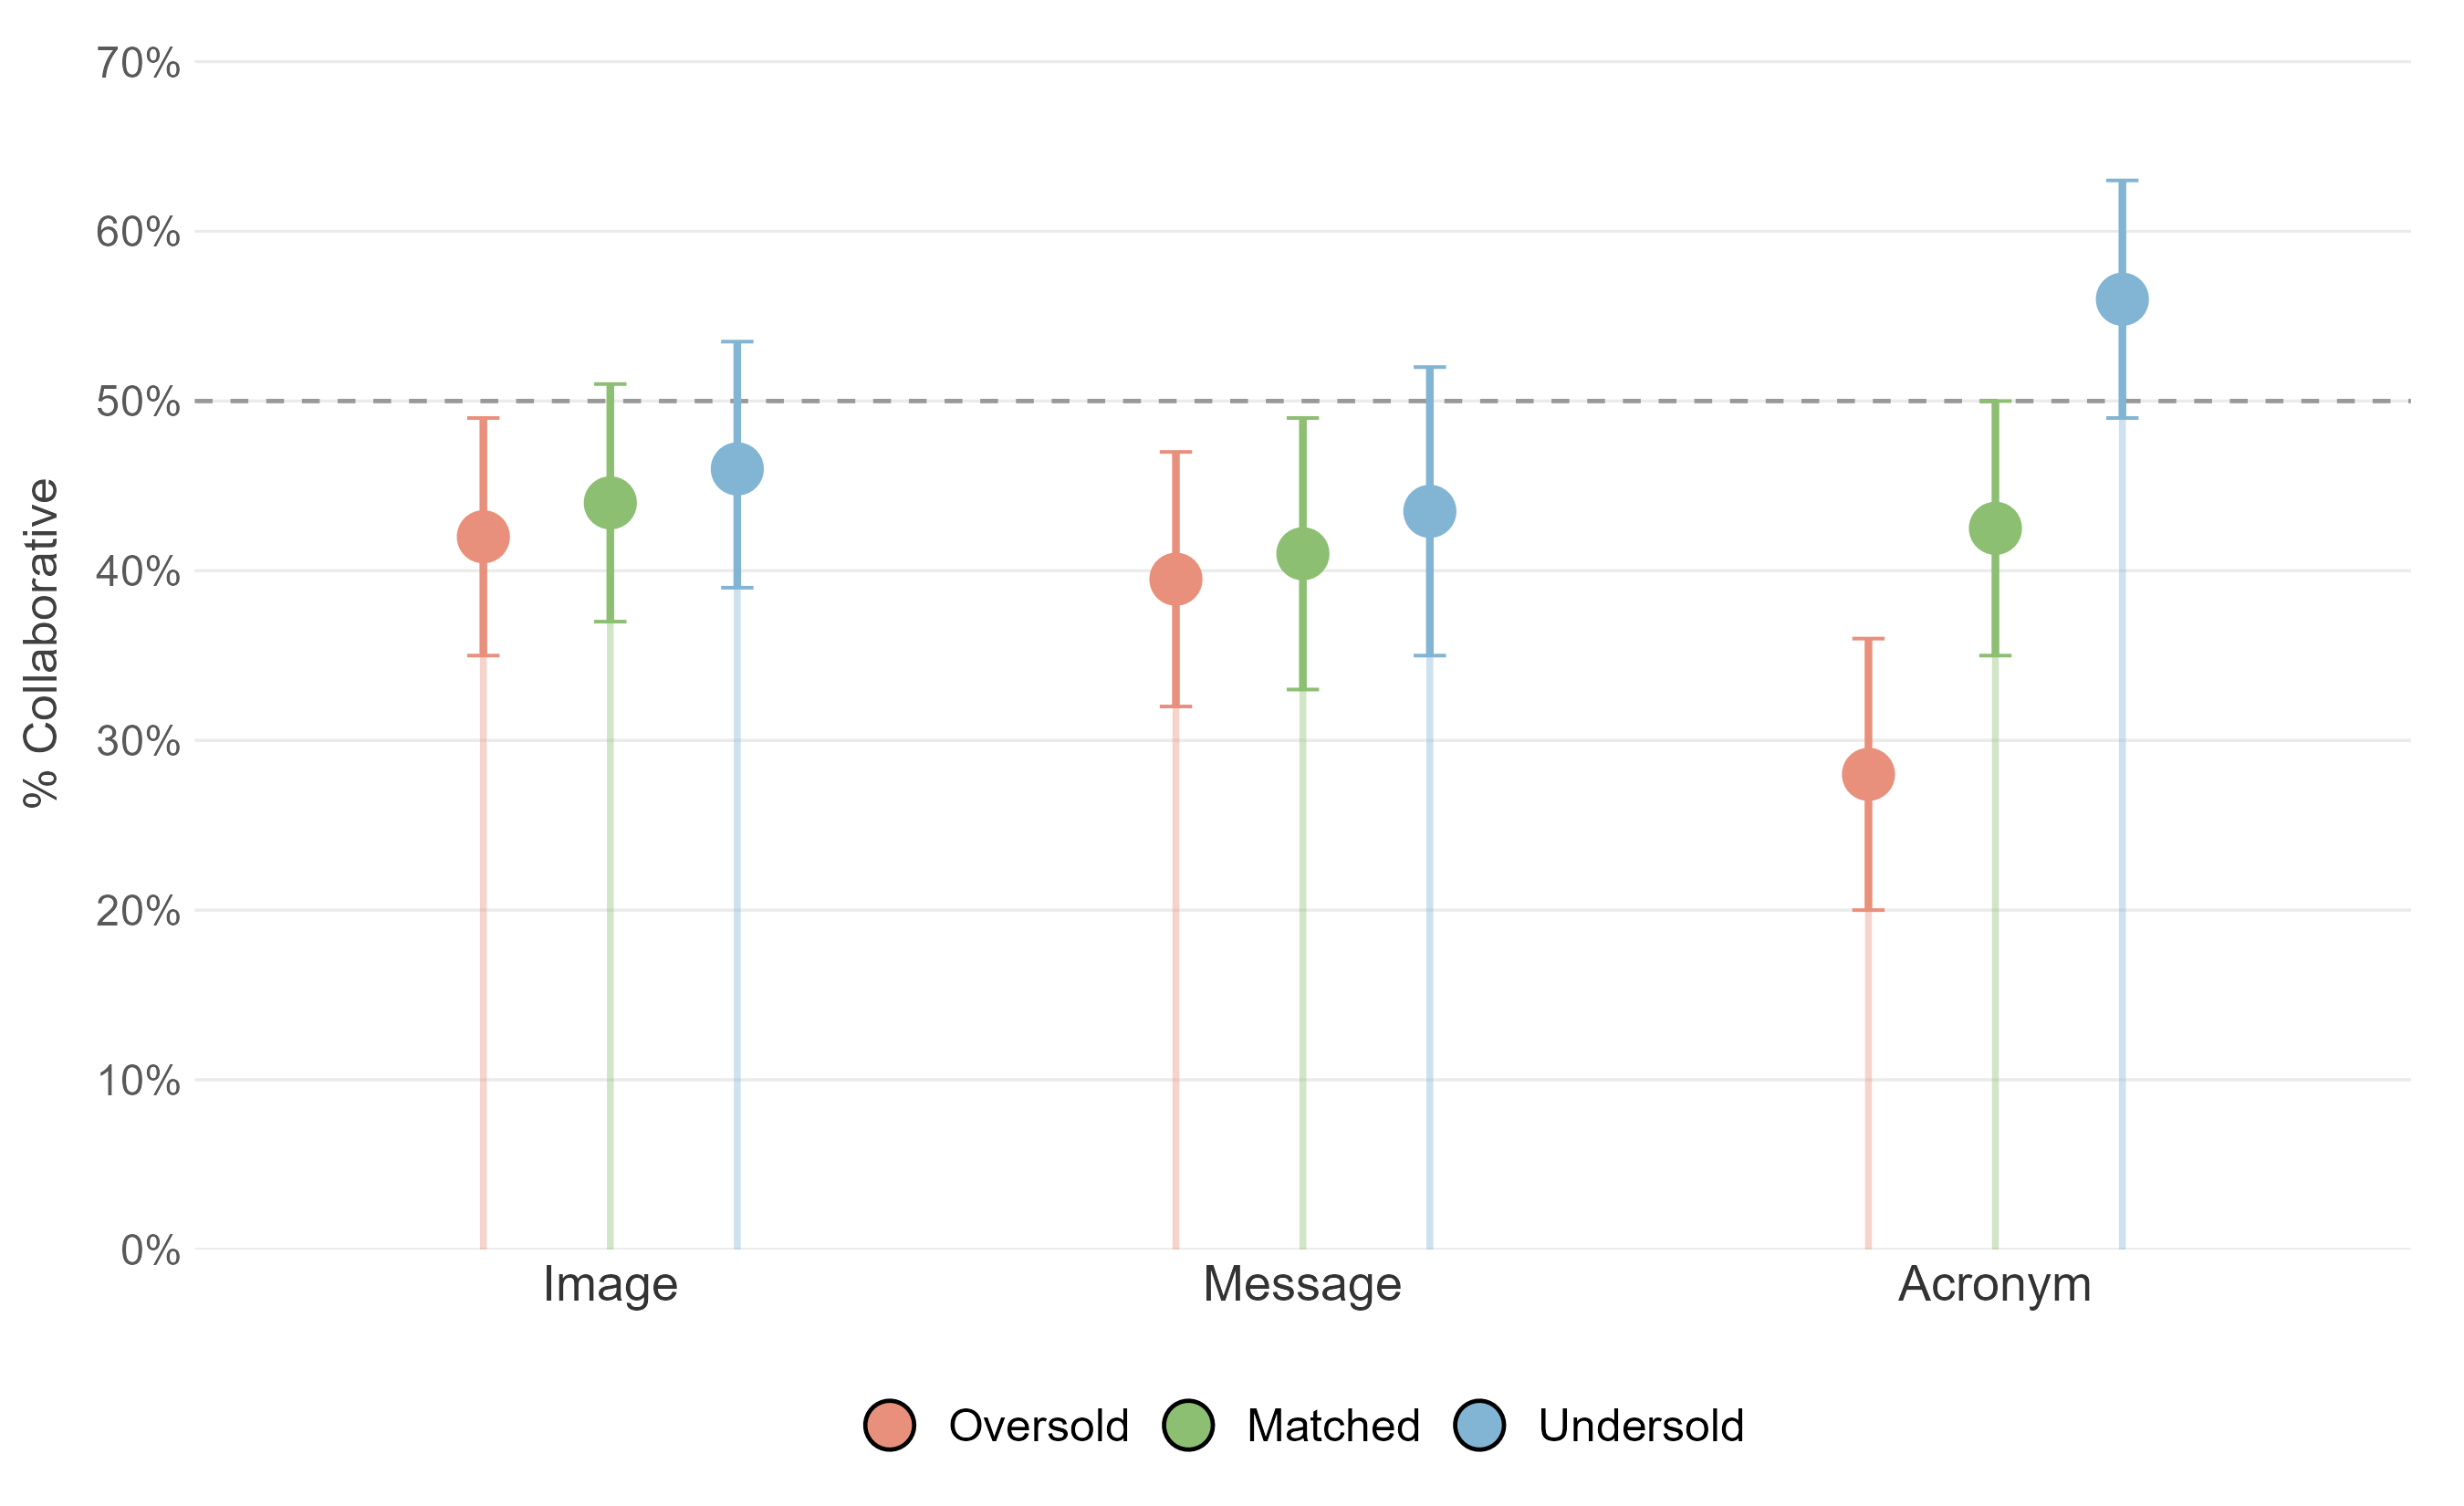
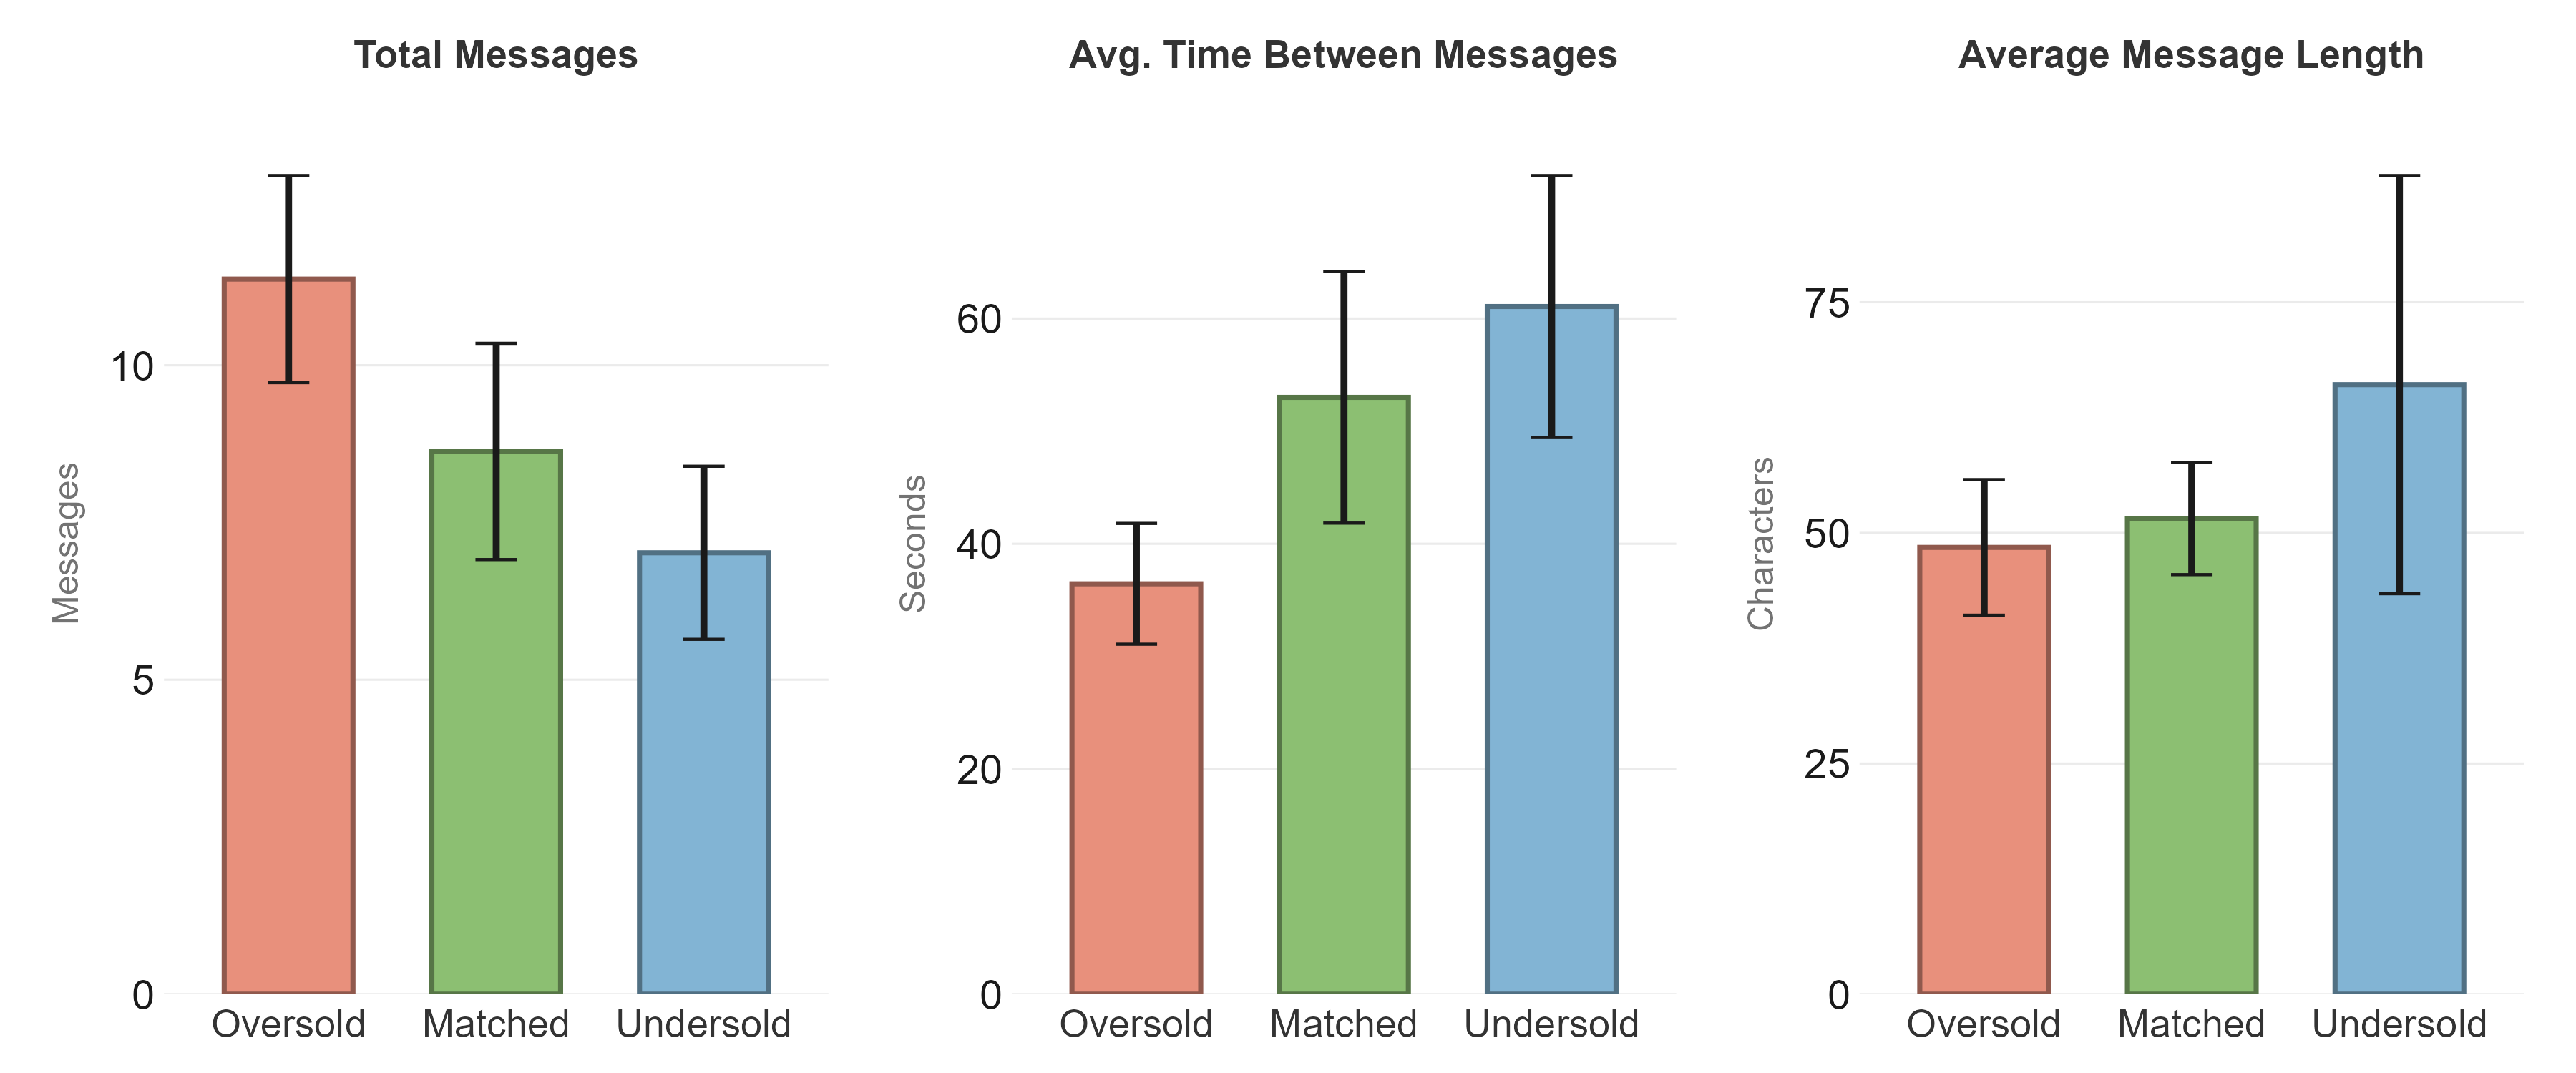
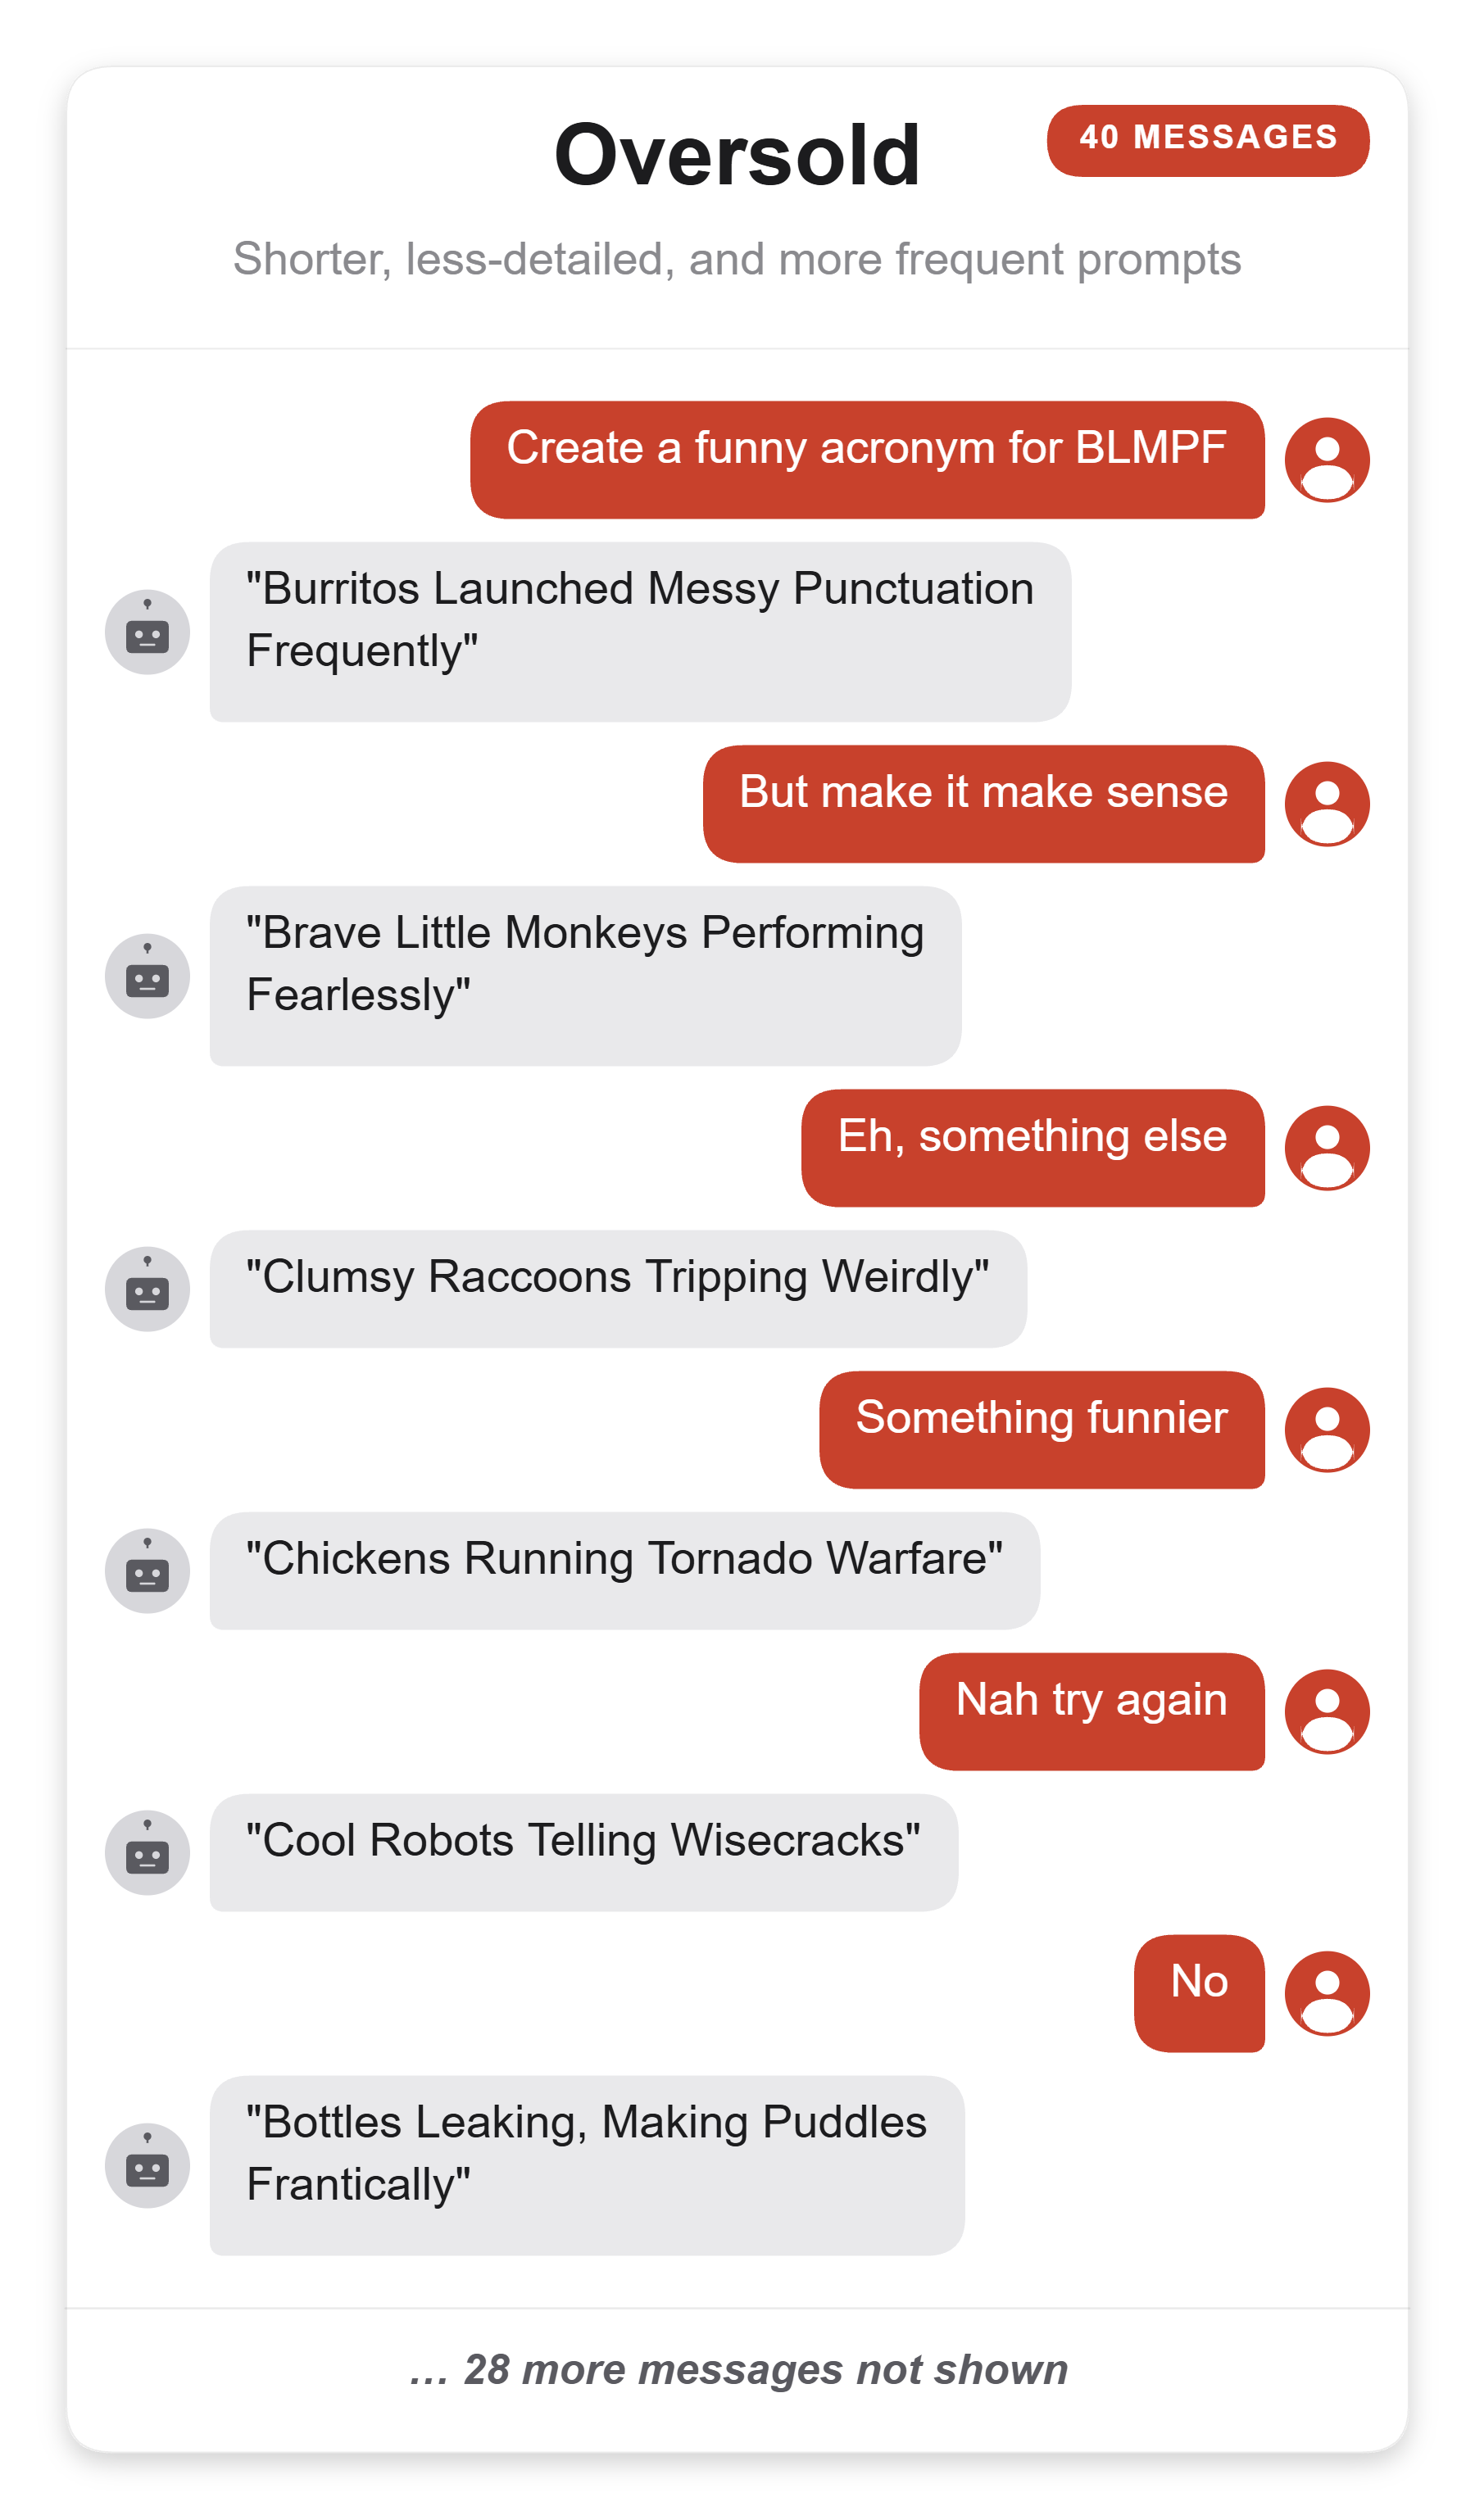
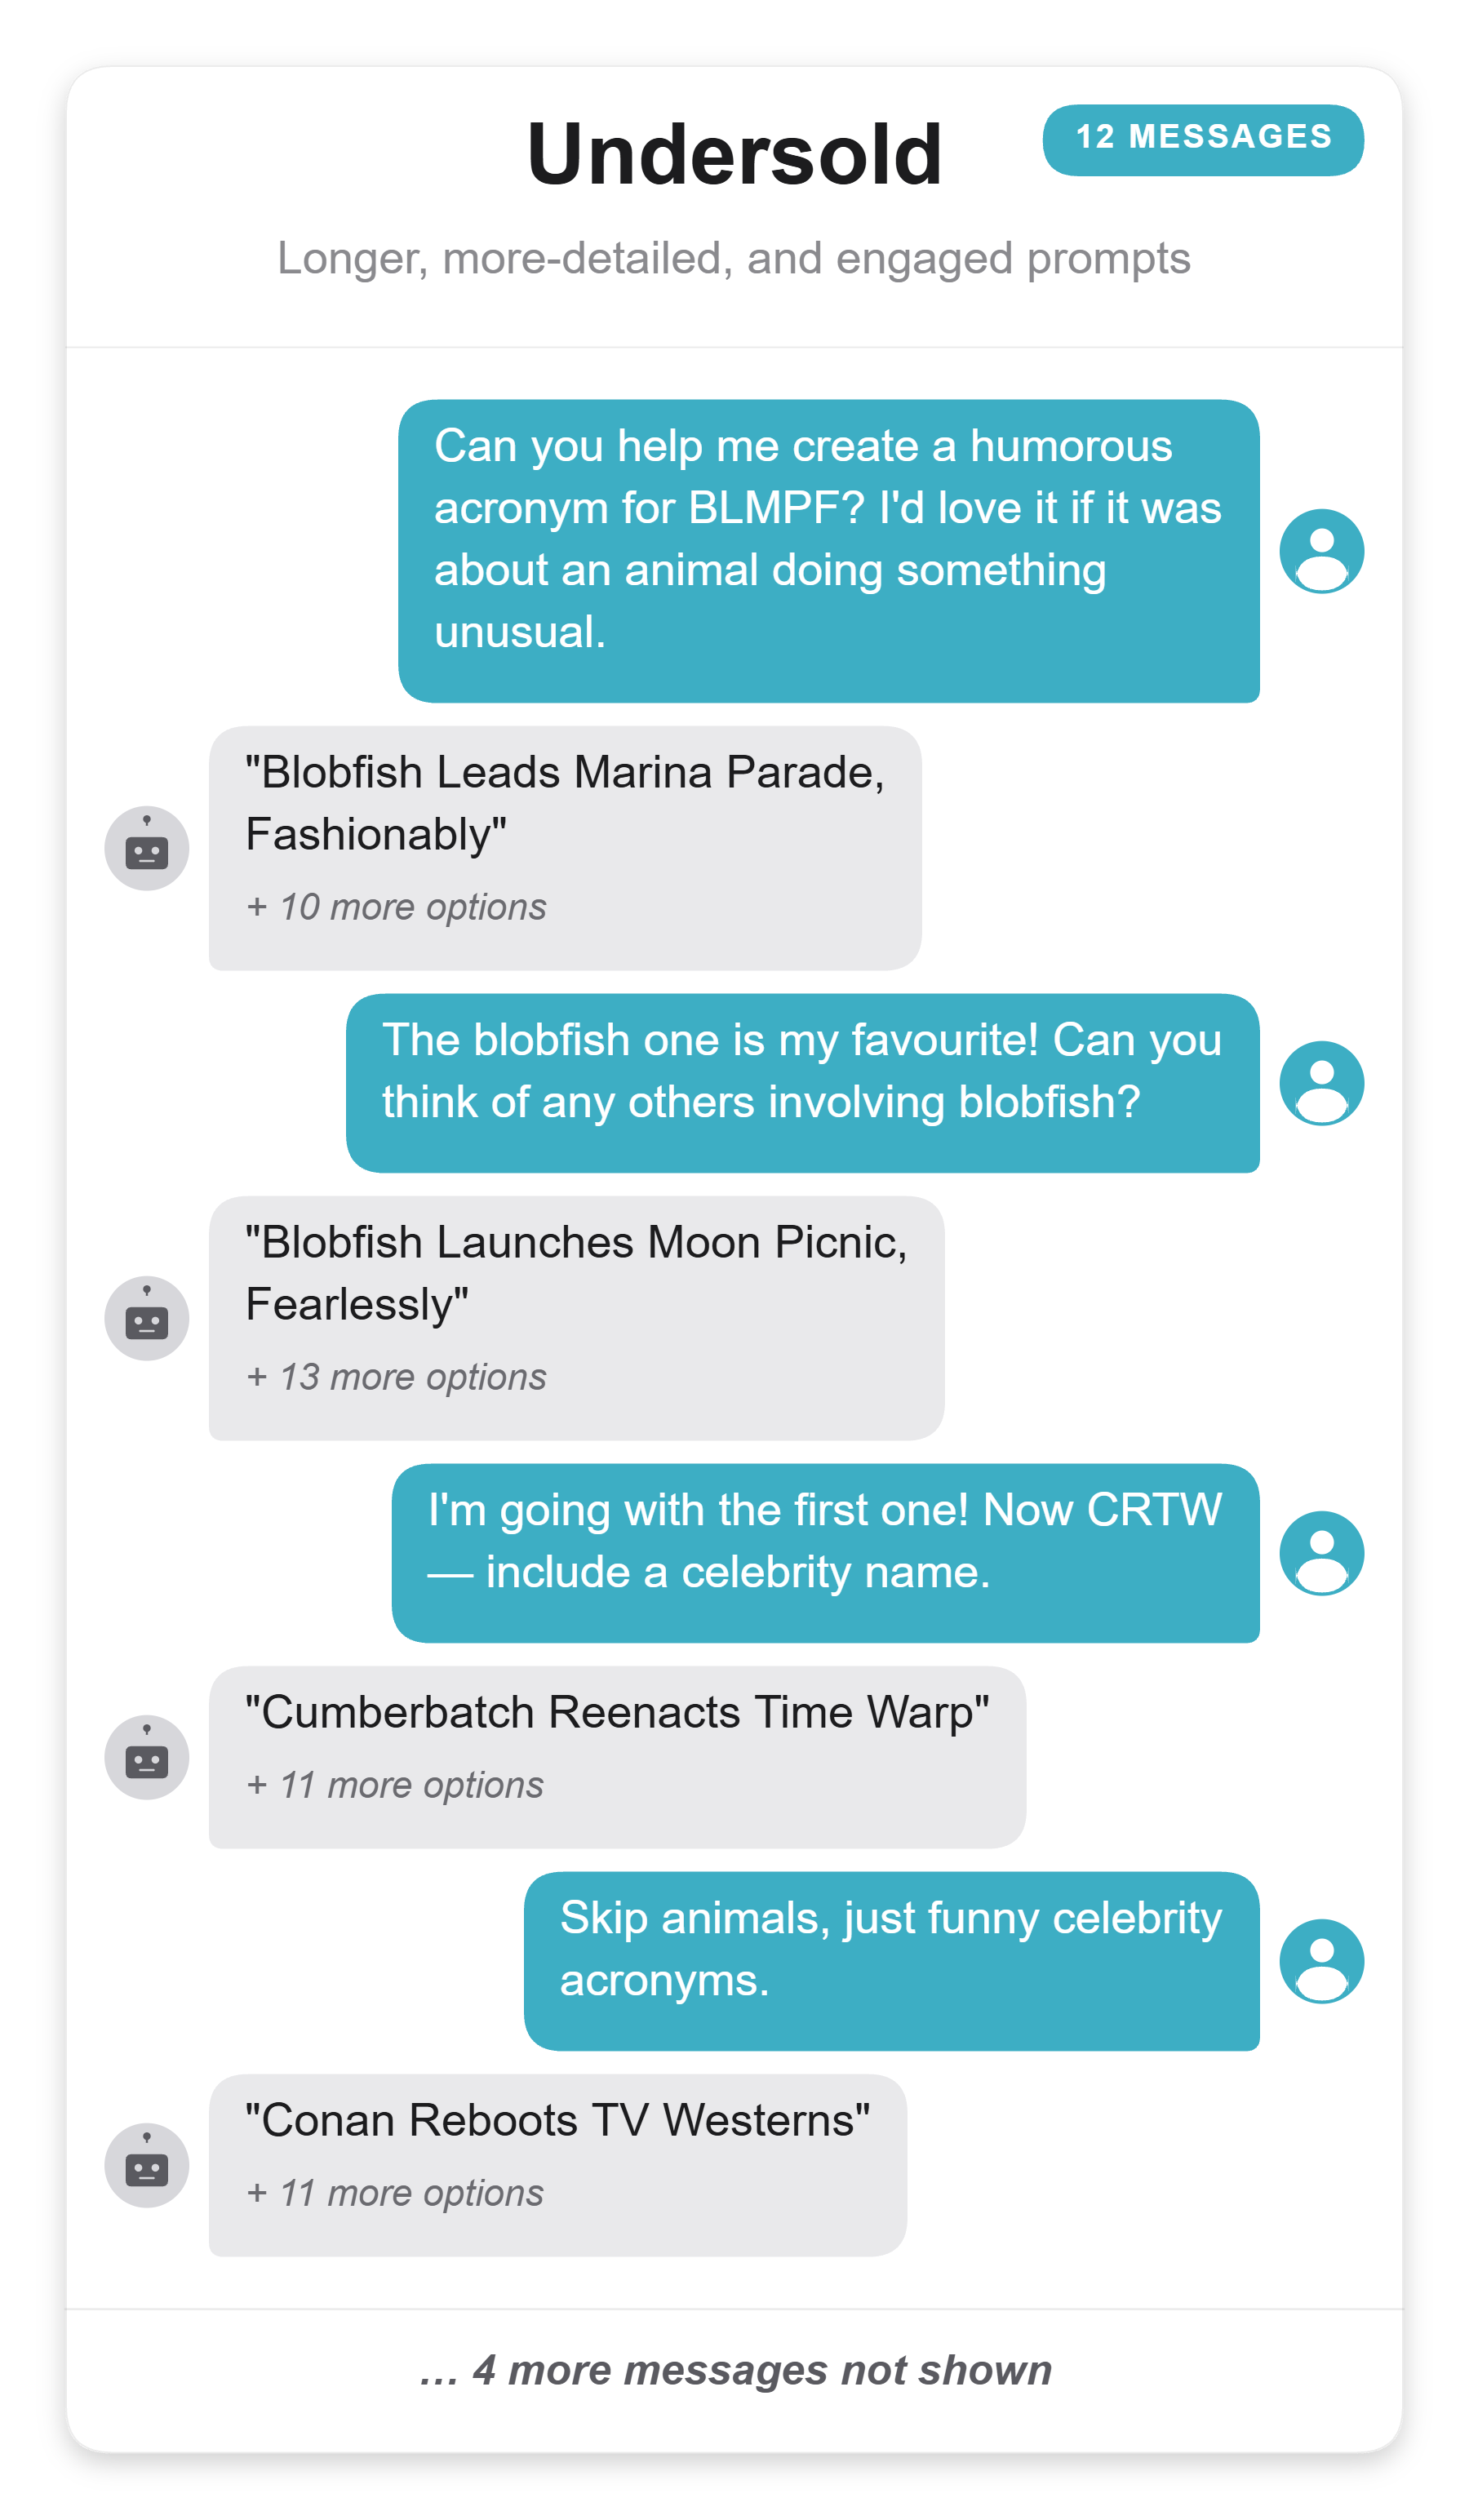
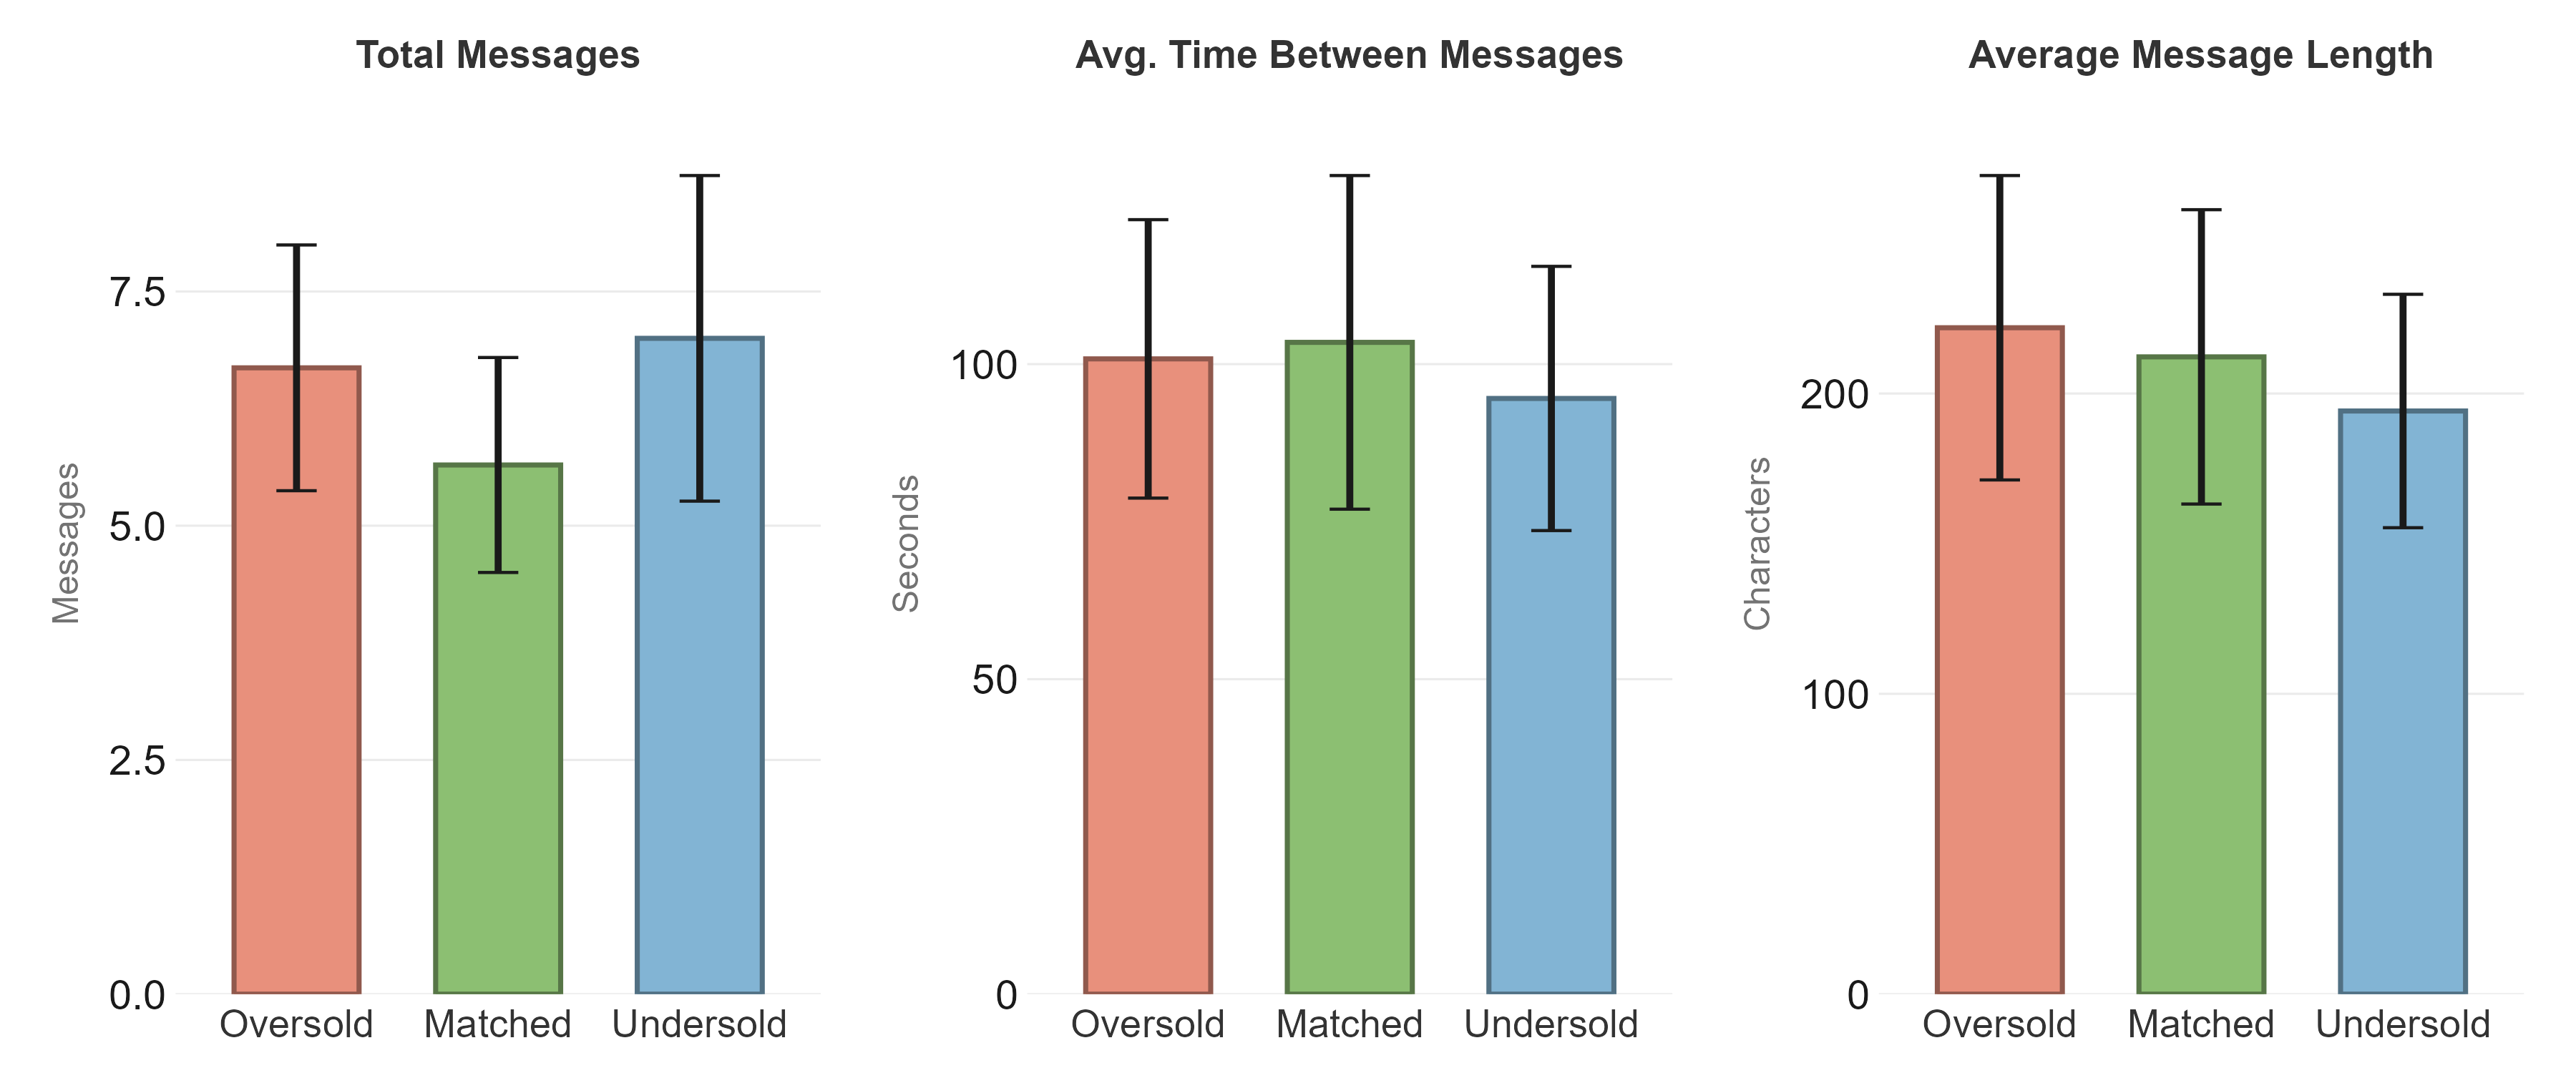
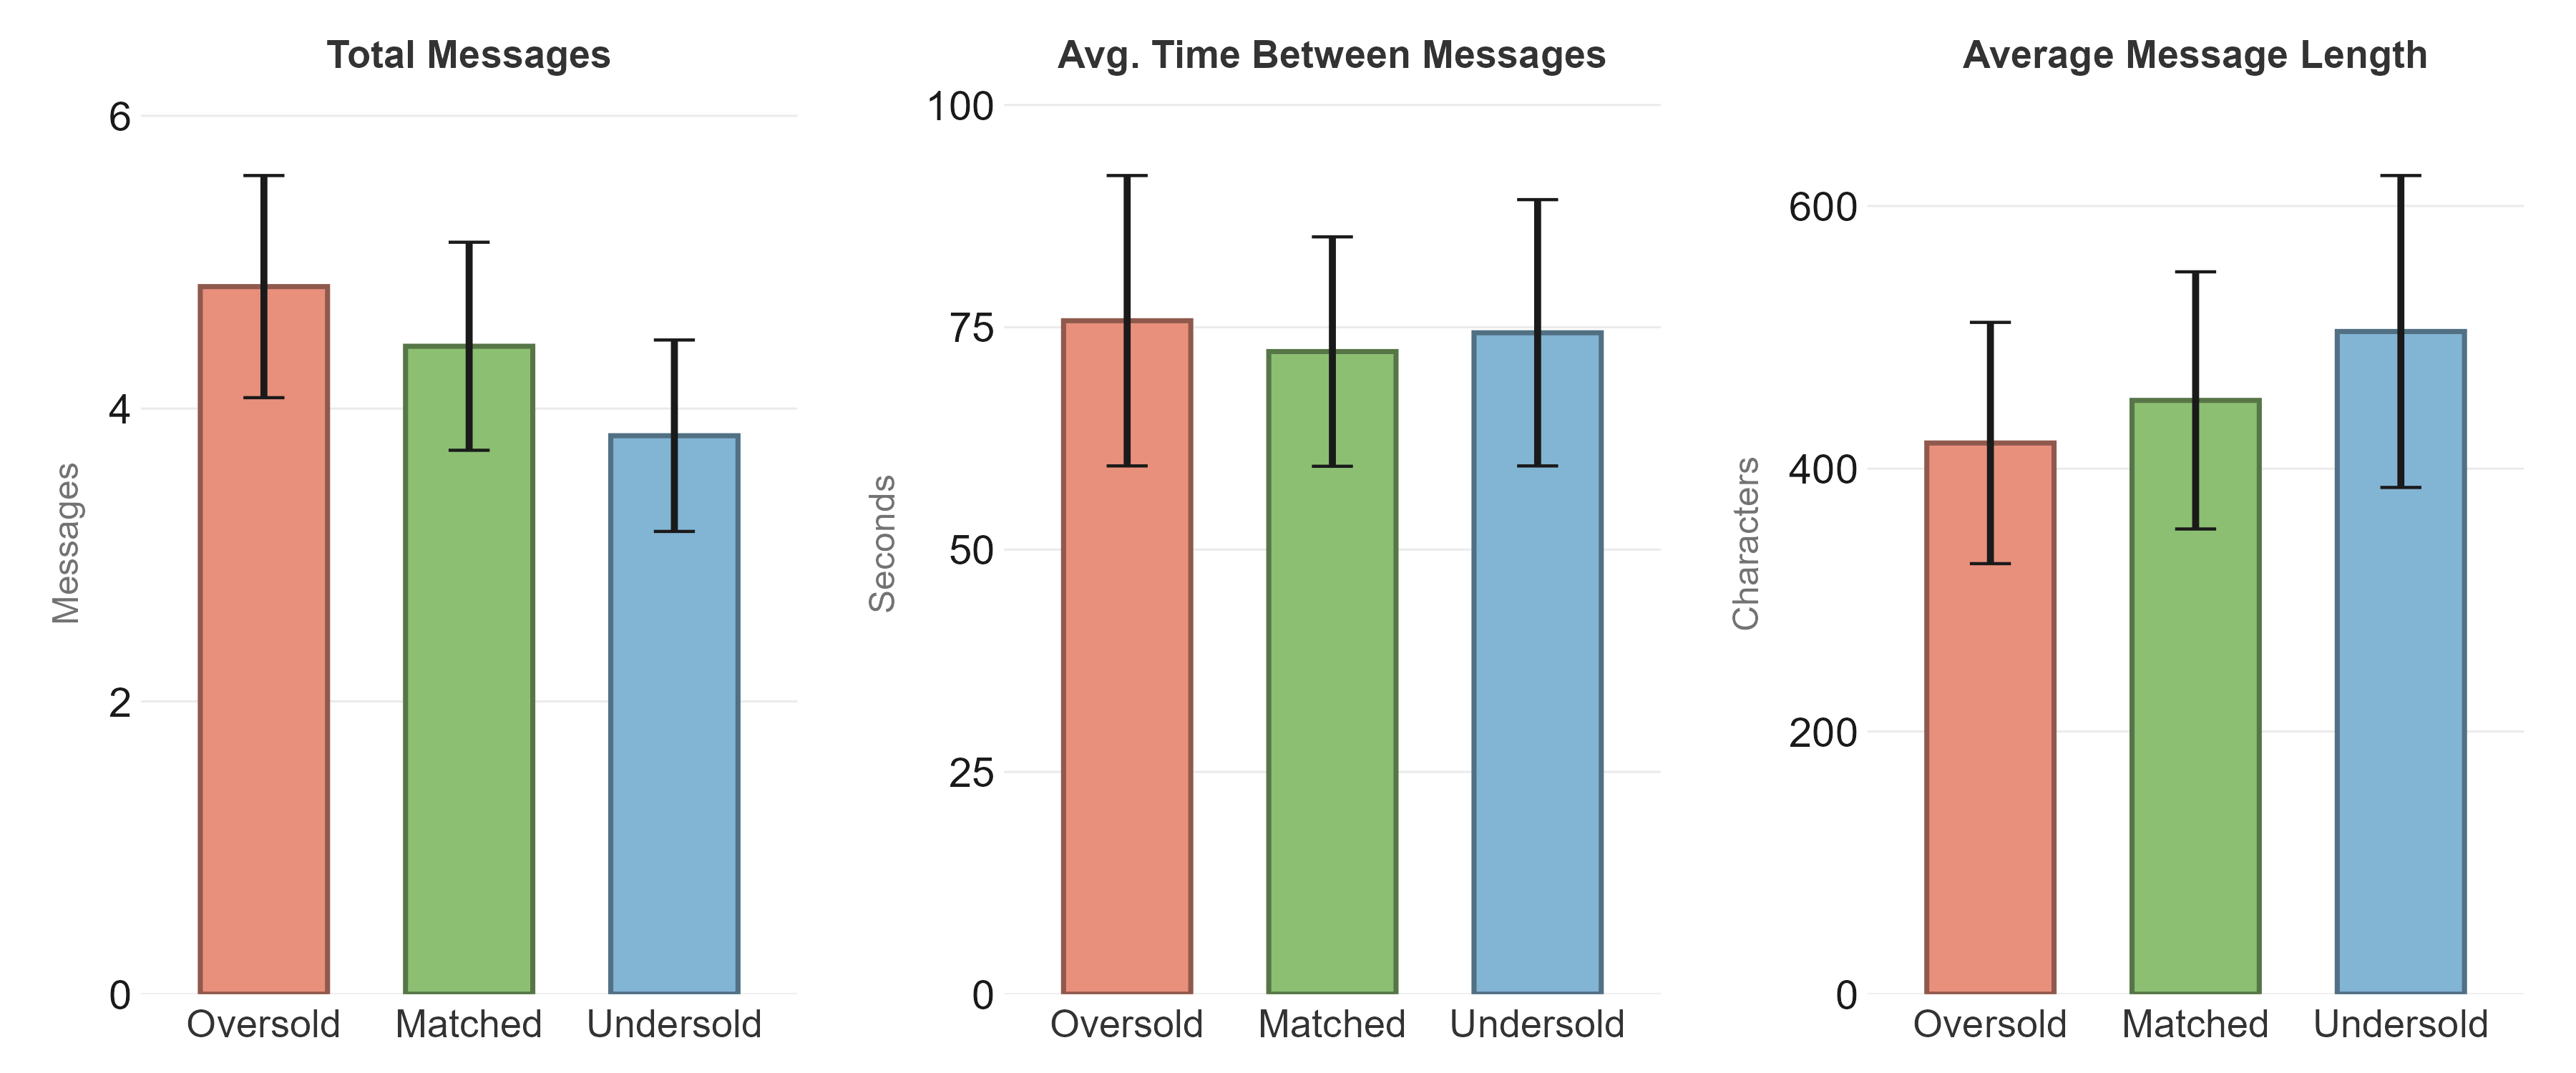
Framing also changed how participants worked with the model, with the effect concentrated on the most open-ended of the three tasks, acronym building. Oversold participants sent the most messages, with the shortest gaps between them and the shortest prompts, a pattern consistent with re-prompting in search of an output the model was failing to deliver; Undersold participants sent fewer, longer messages with more deliberation between them, consistent with active co-construction; Matched fell between the two on every metric (Figure 4).
The effect was largest on the acronym task. Outreach message writing showed the same direction but attenuated (Appendix Figure 23); image generation’s pattern was weaker and less consistent (Appendix Figure 24). The other two tasks had explicit constraints (a target to match or requirements to meet); only the acronym task left user input as the primary determinant of a good output.
The pattern repeated in the character of participants’ messages. On the image and outreach message tasks, the proportion of messages classified as collaborative varied little with framing; on the acronym task, Undersold participants were markedly more collaborative than Oversold, with Matched in between (Figure 5). Representative chat logs are in Appendix Figures 16 and 17.
3.3 Output quality corresponds to model capability, not framing↩︎
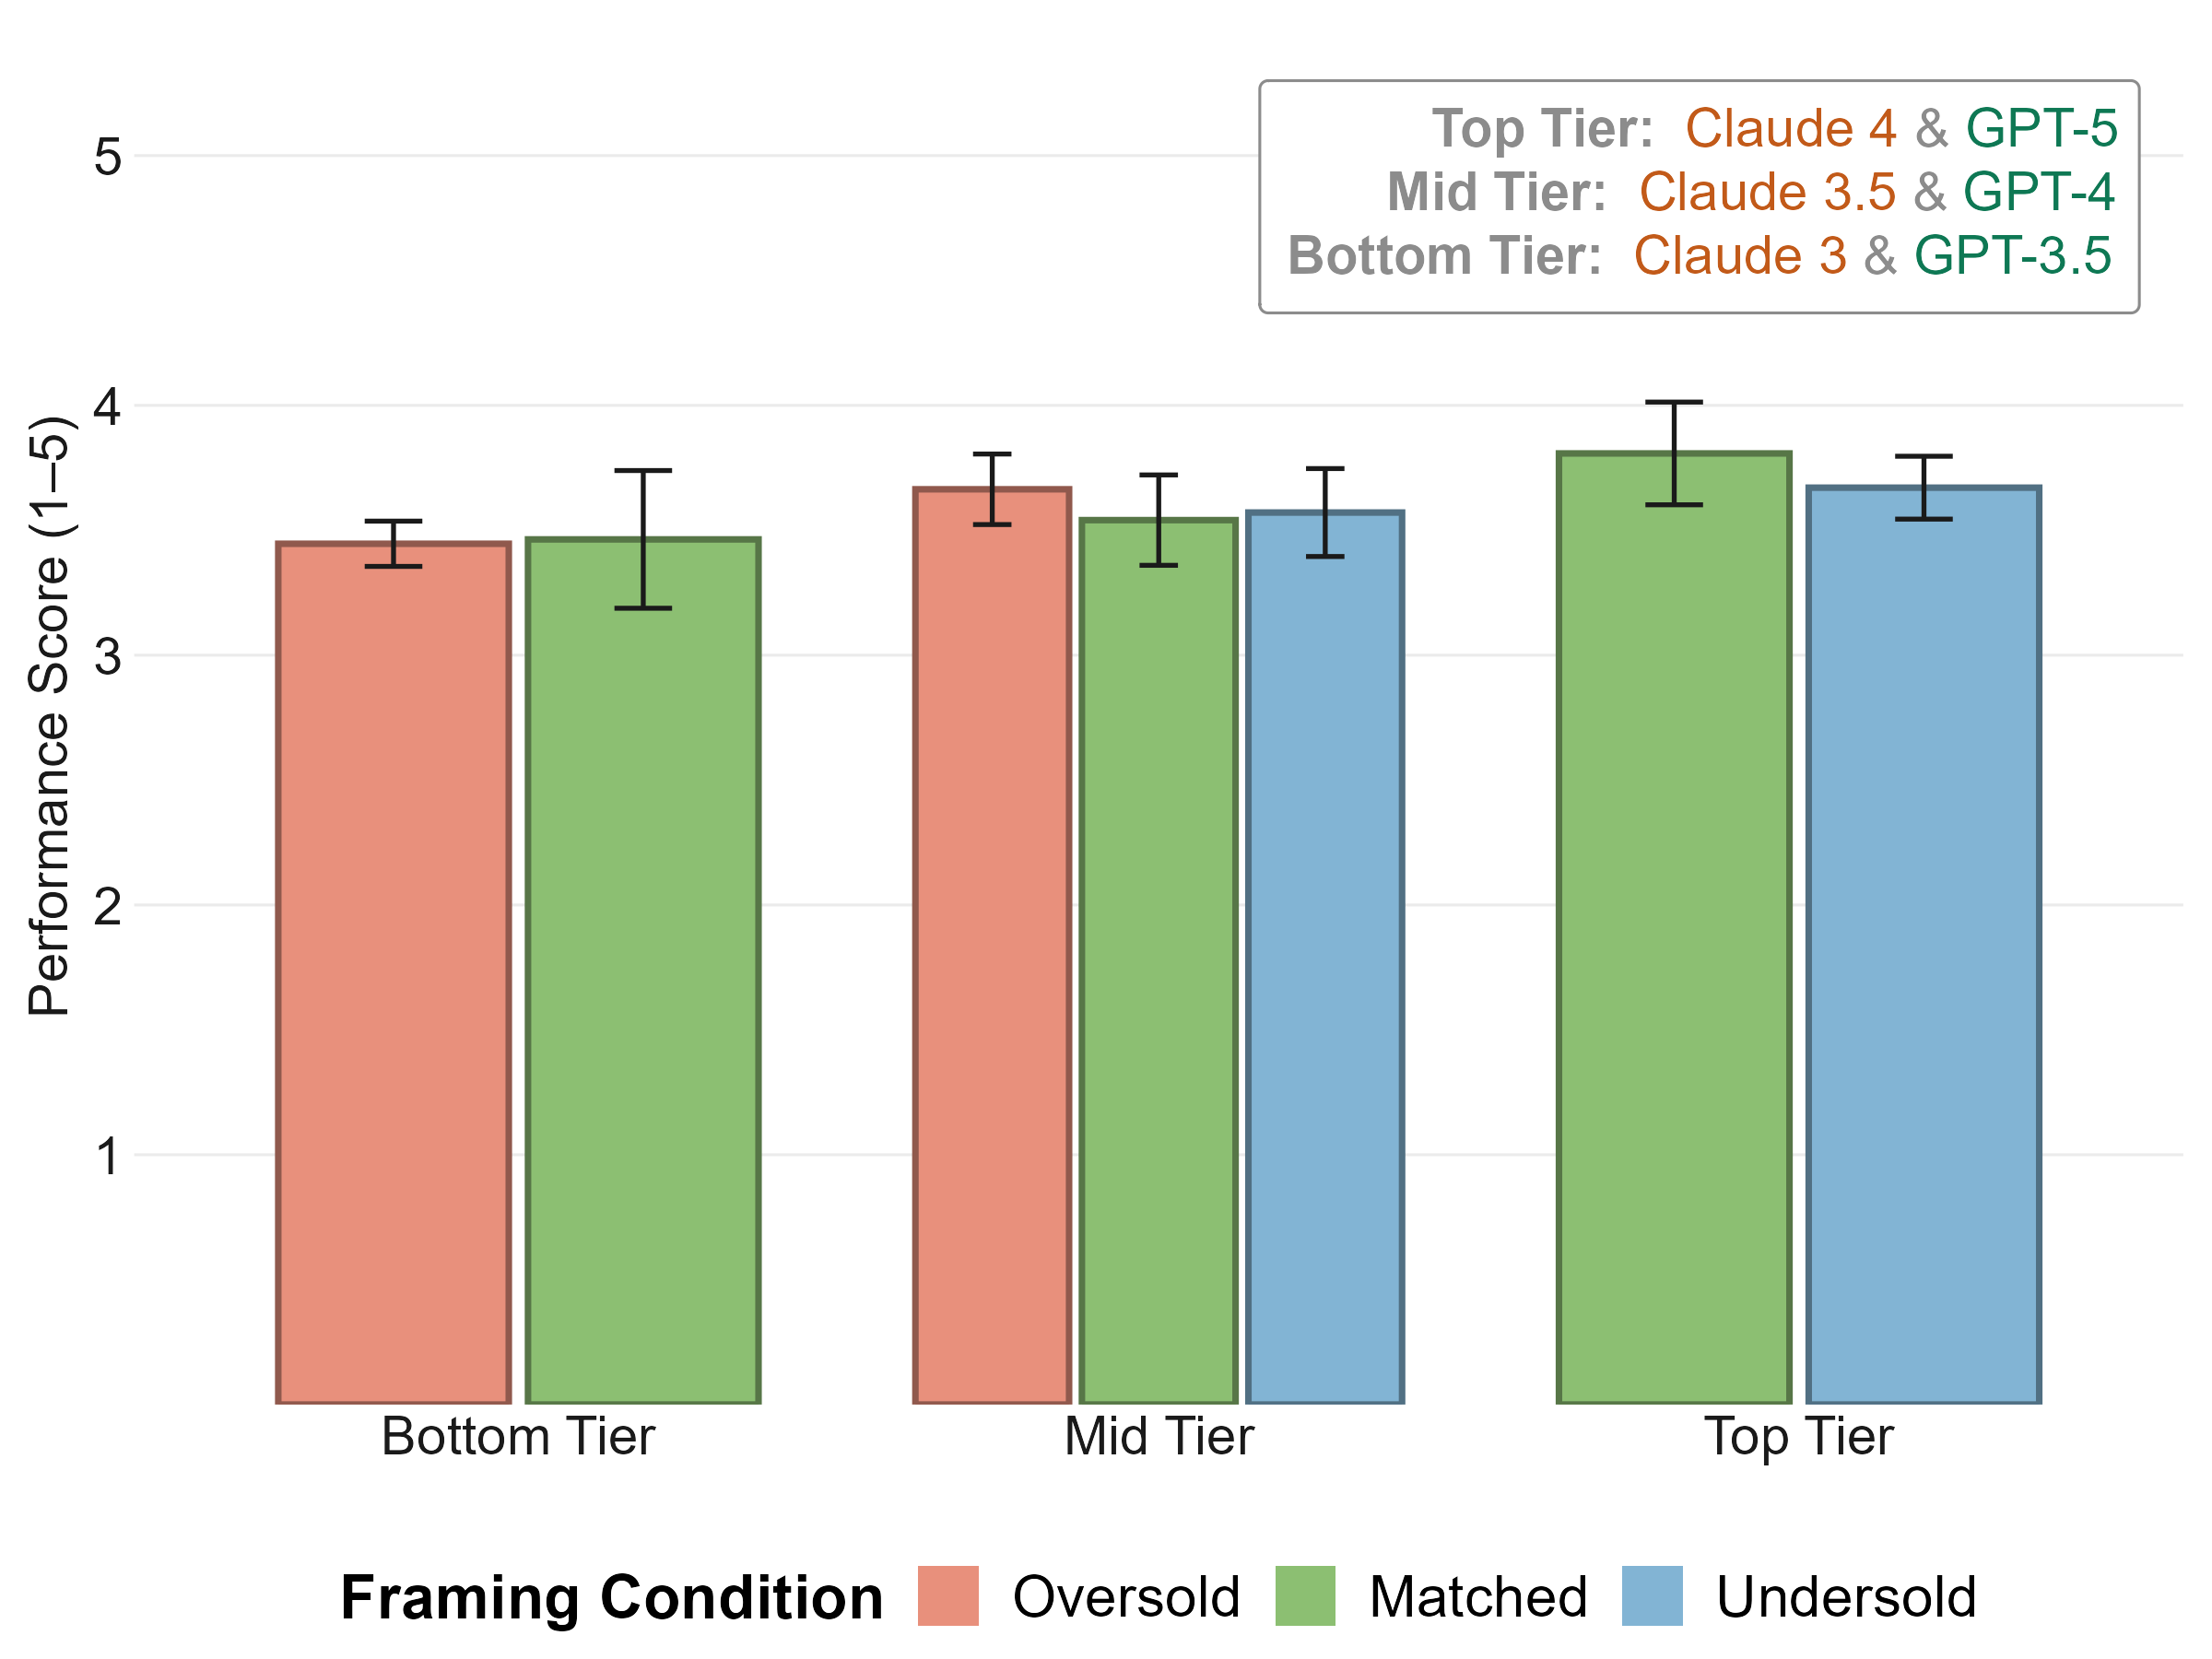
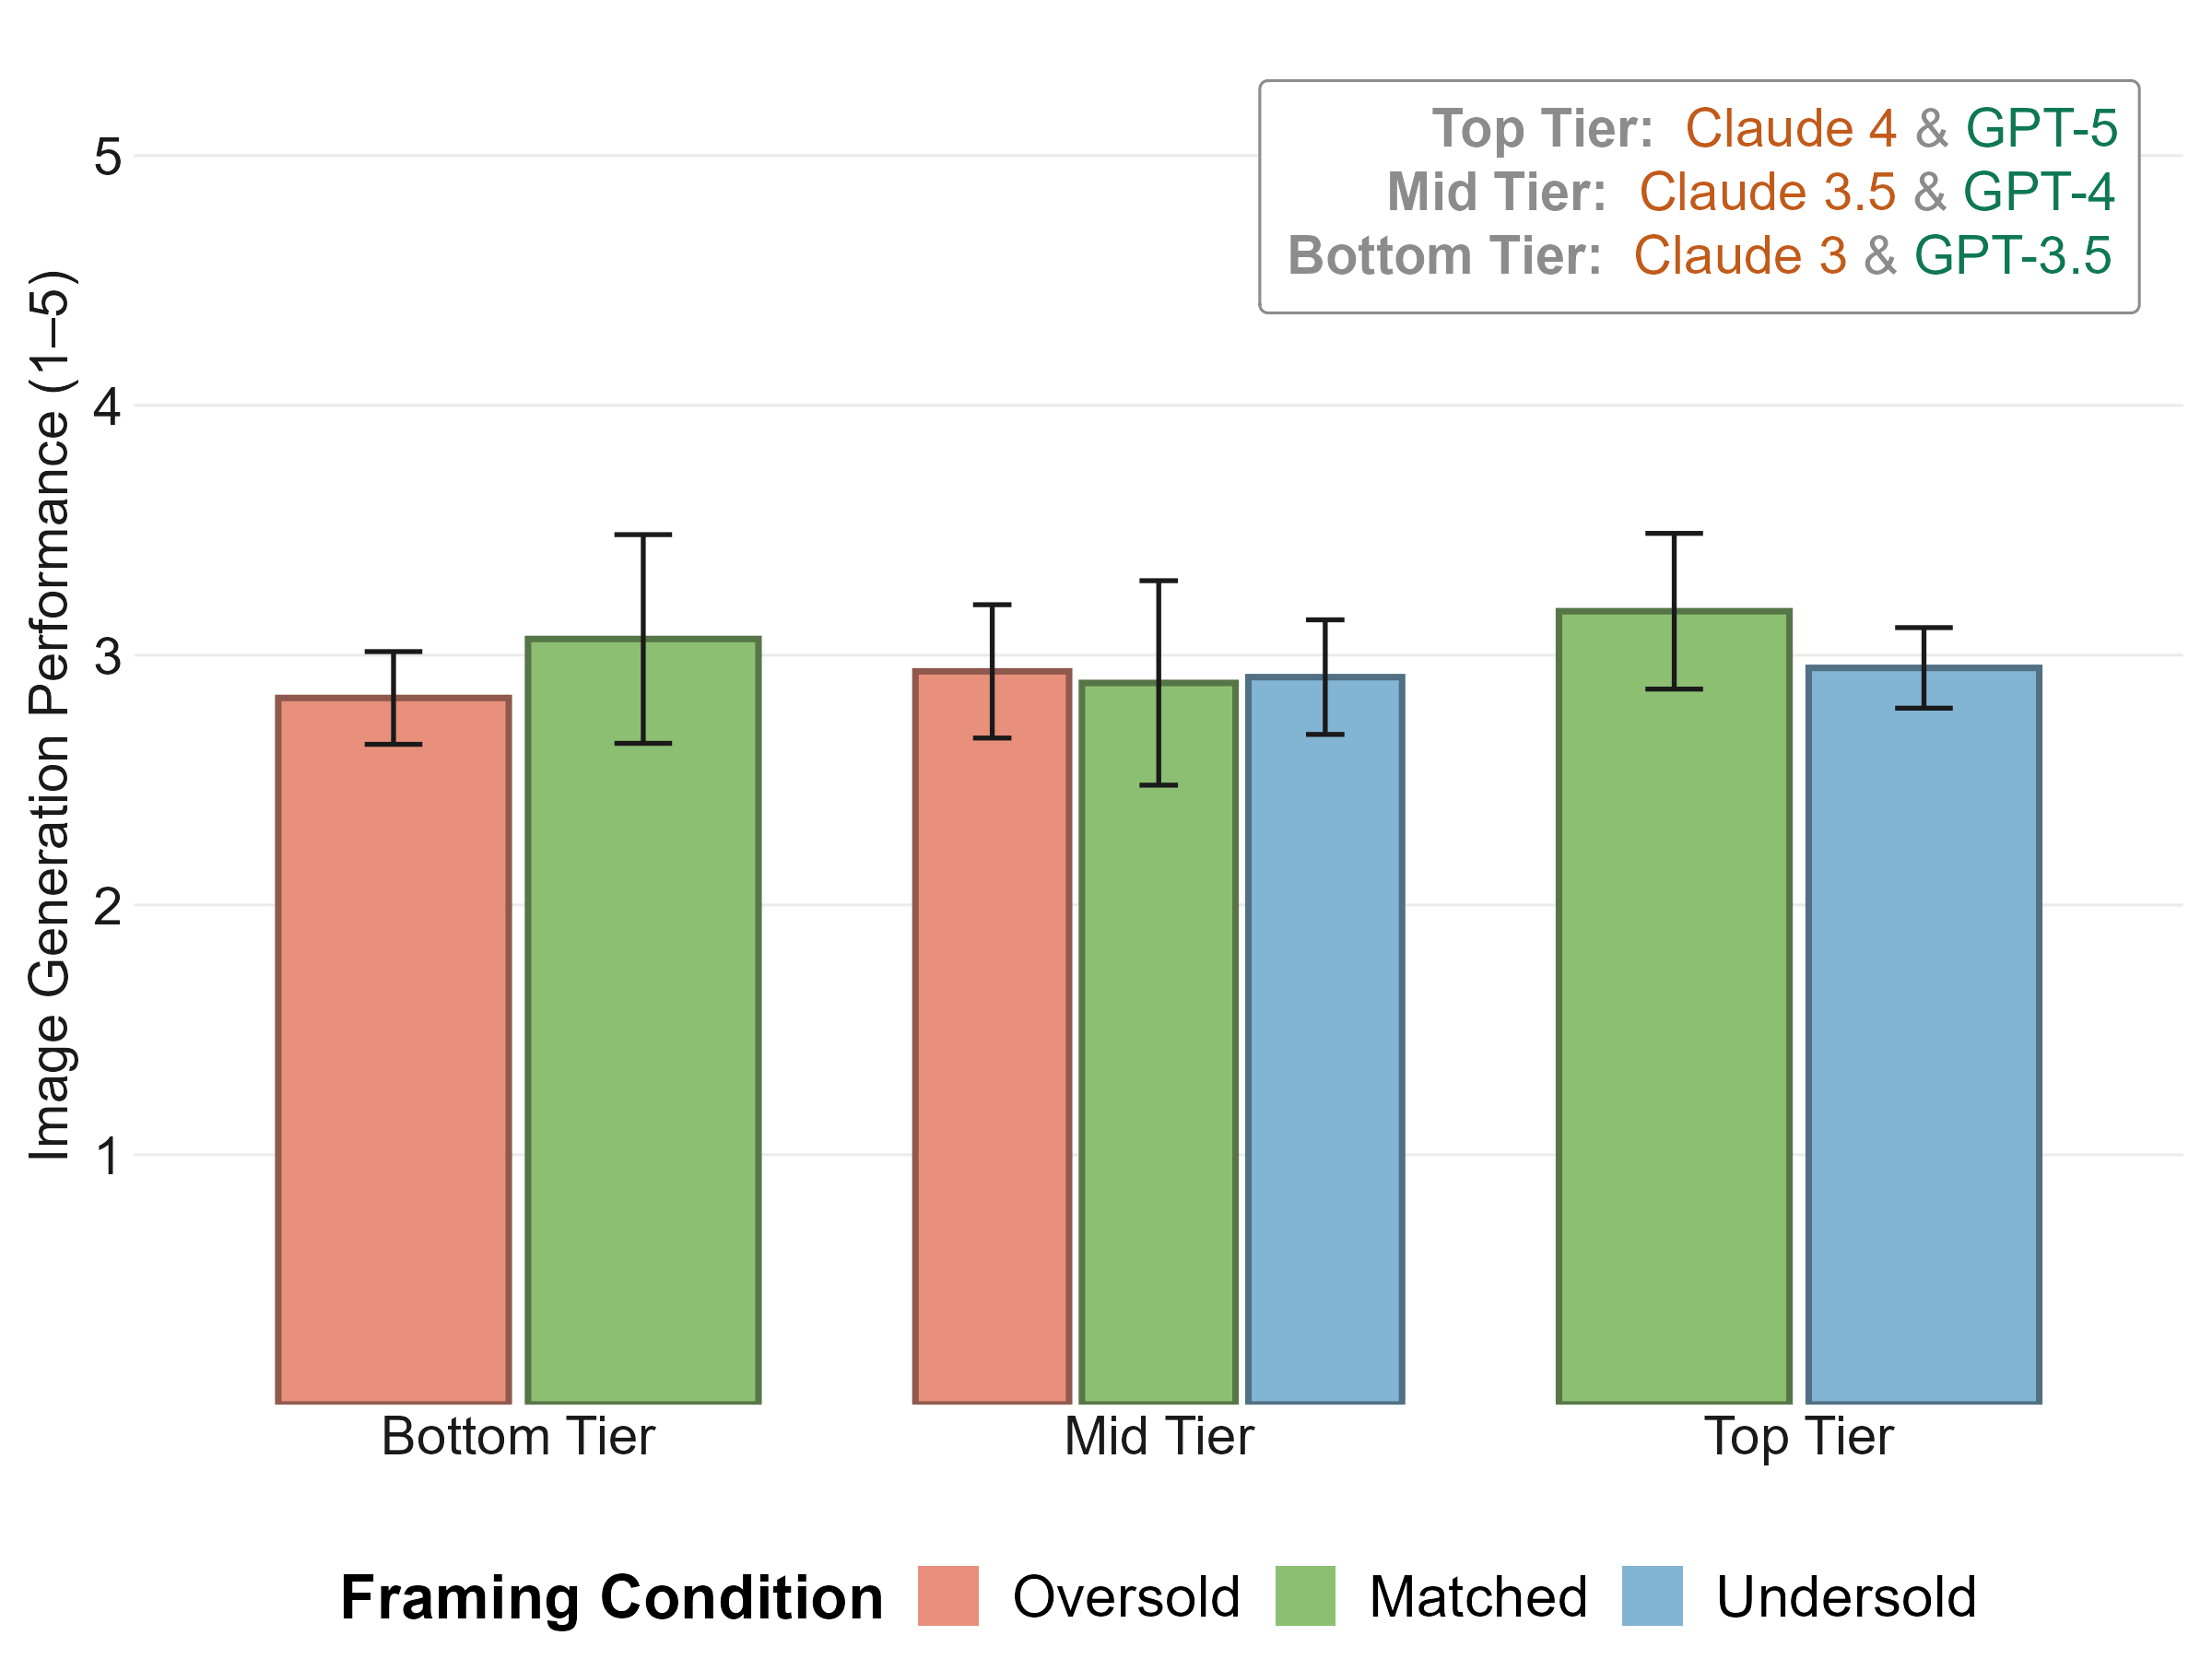
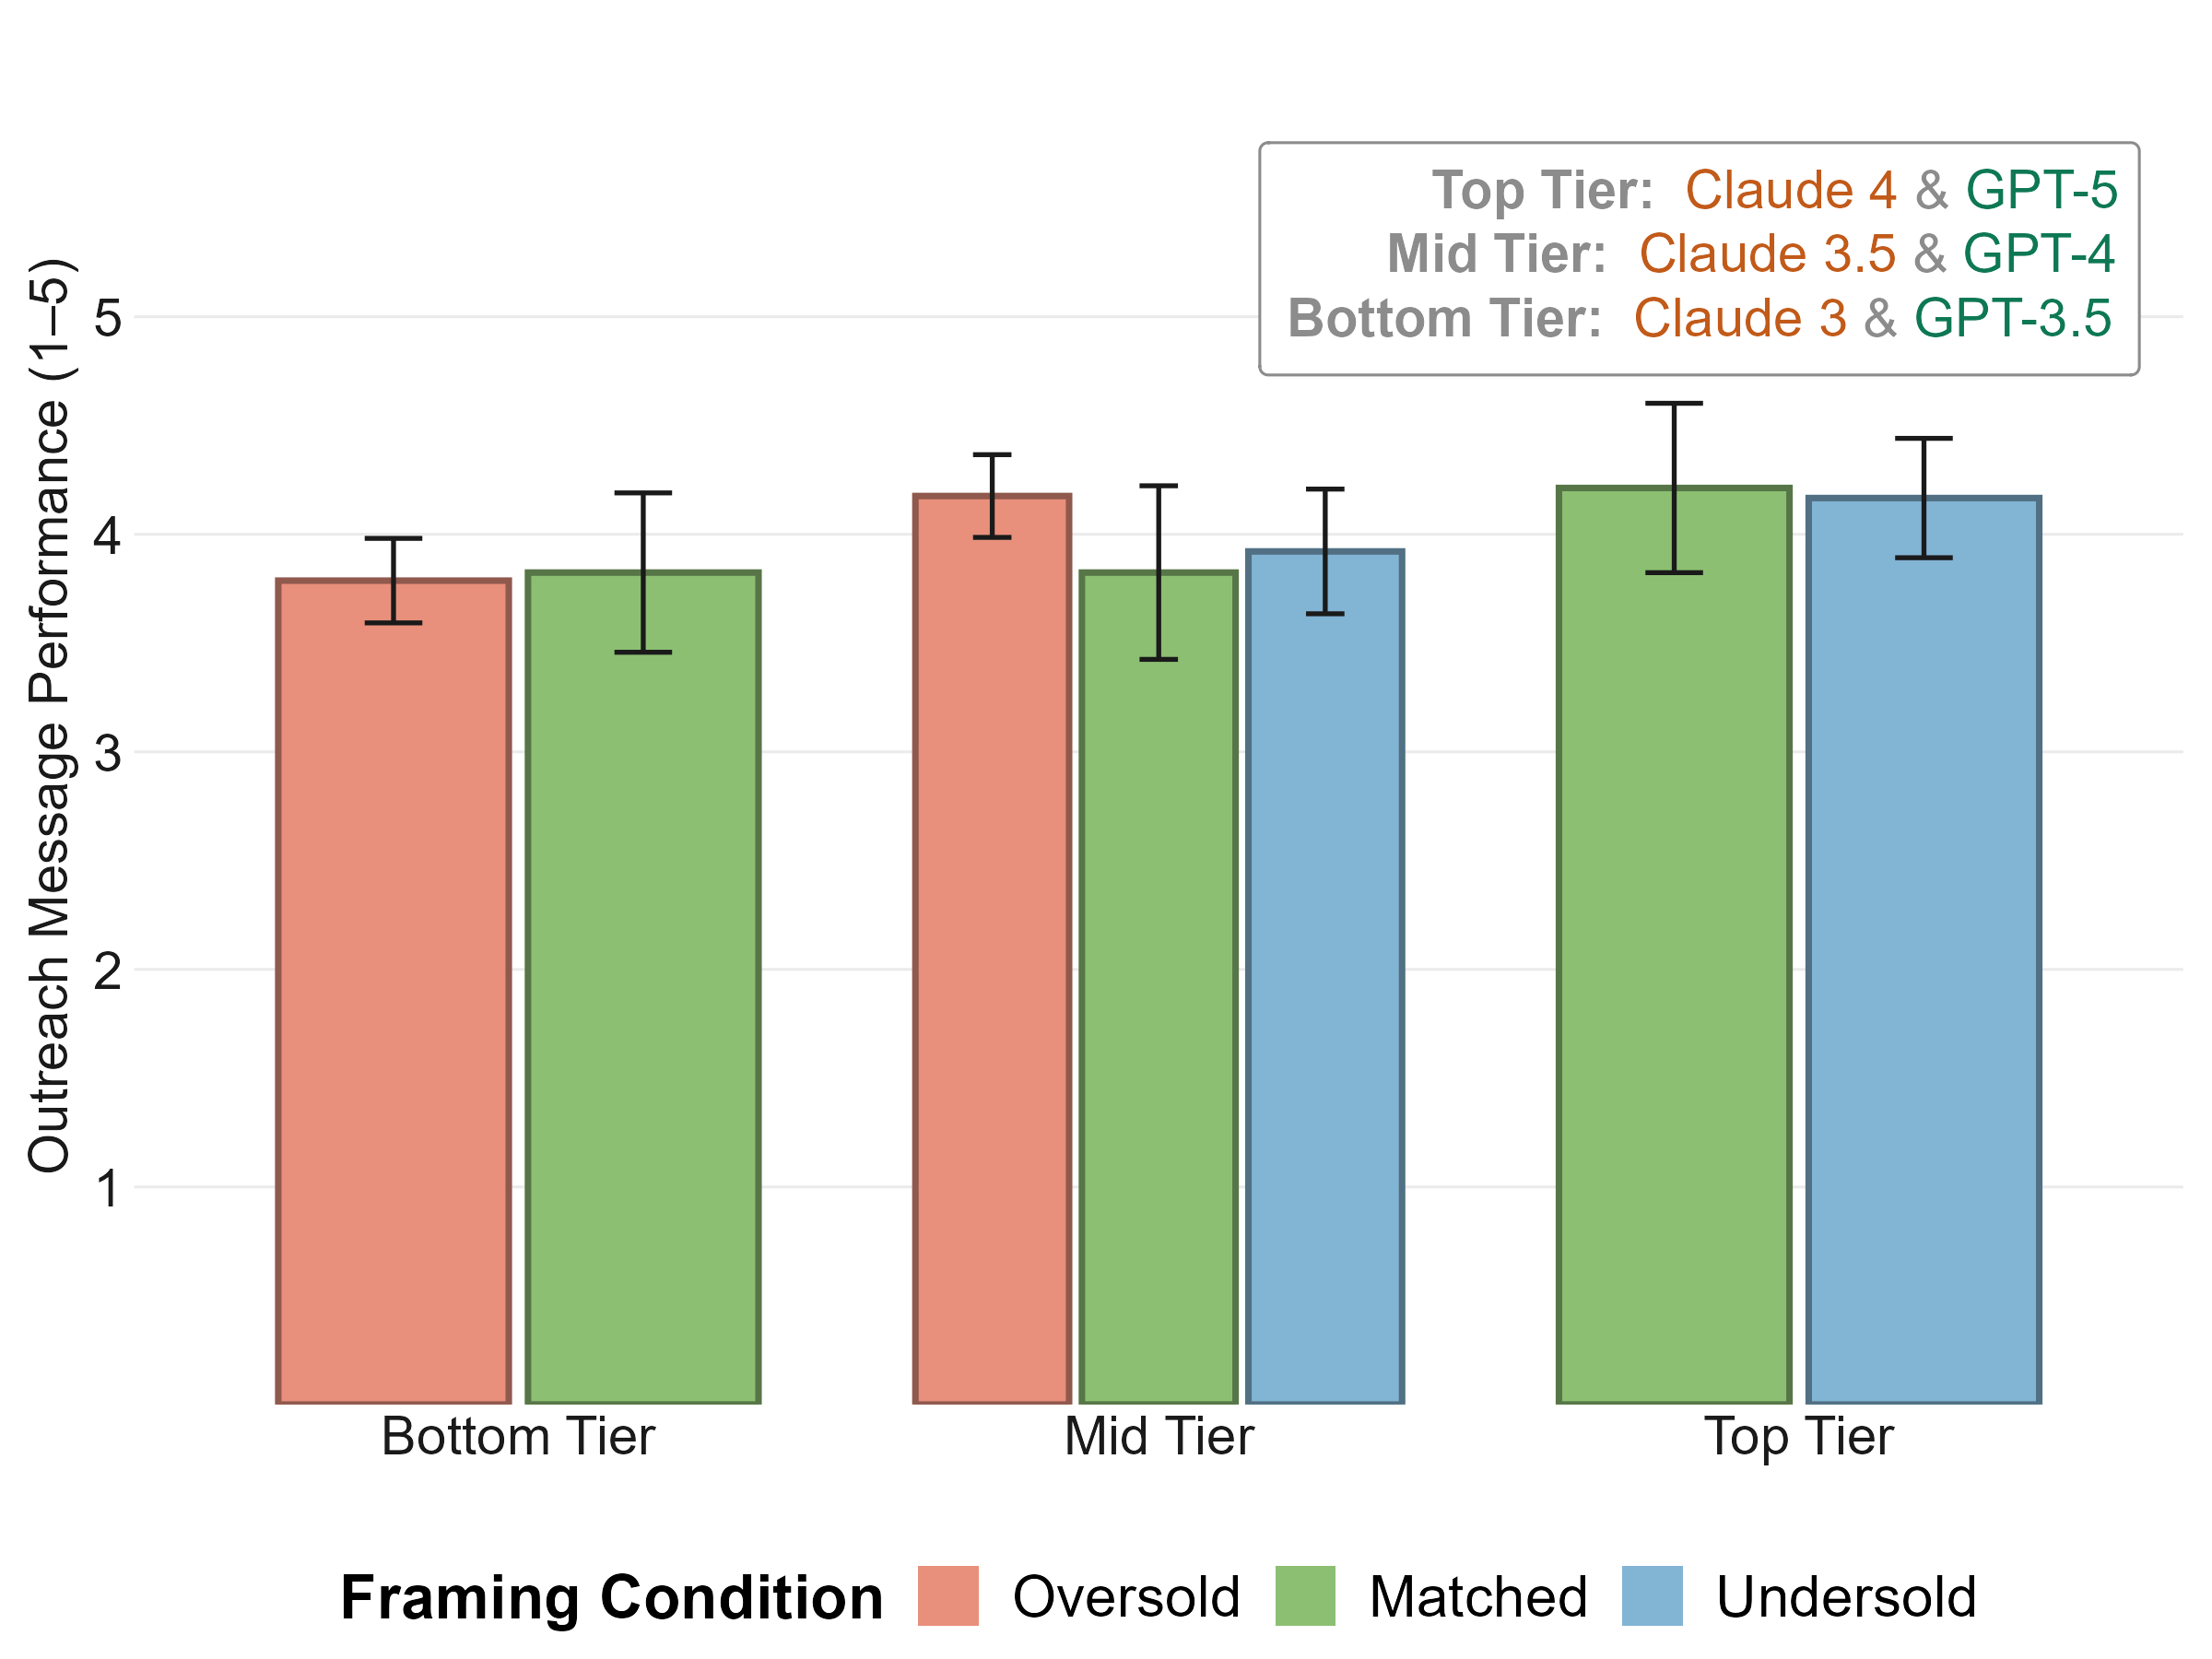
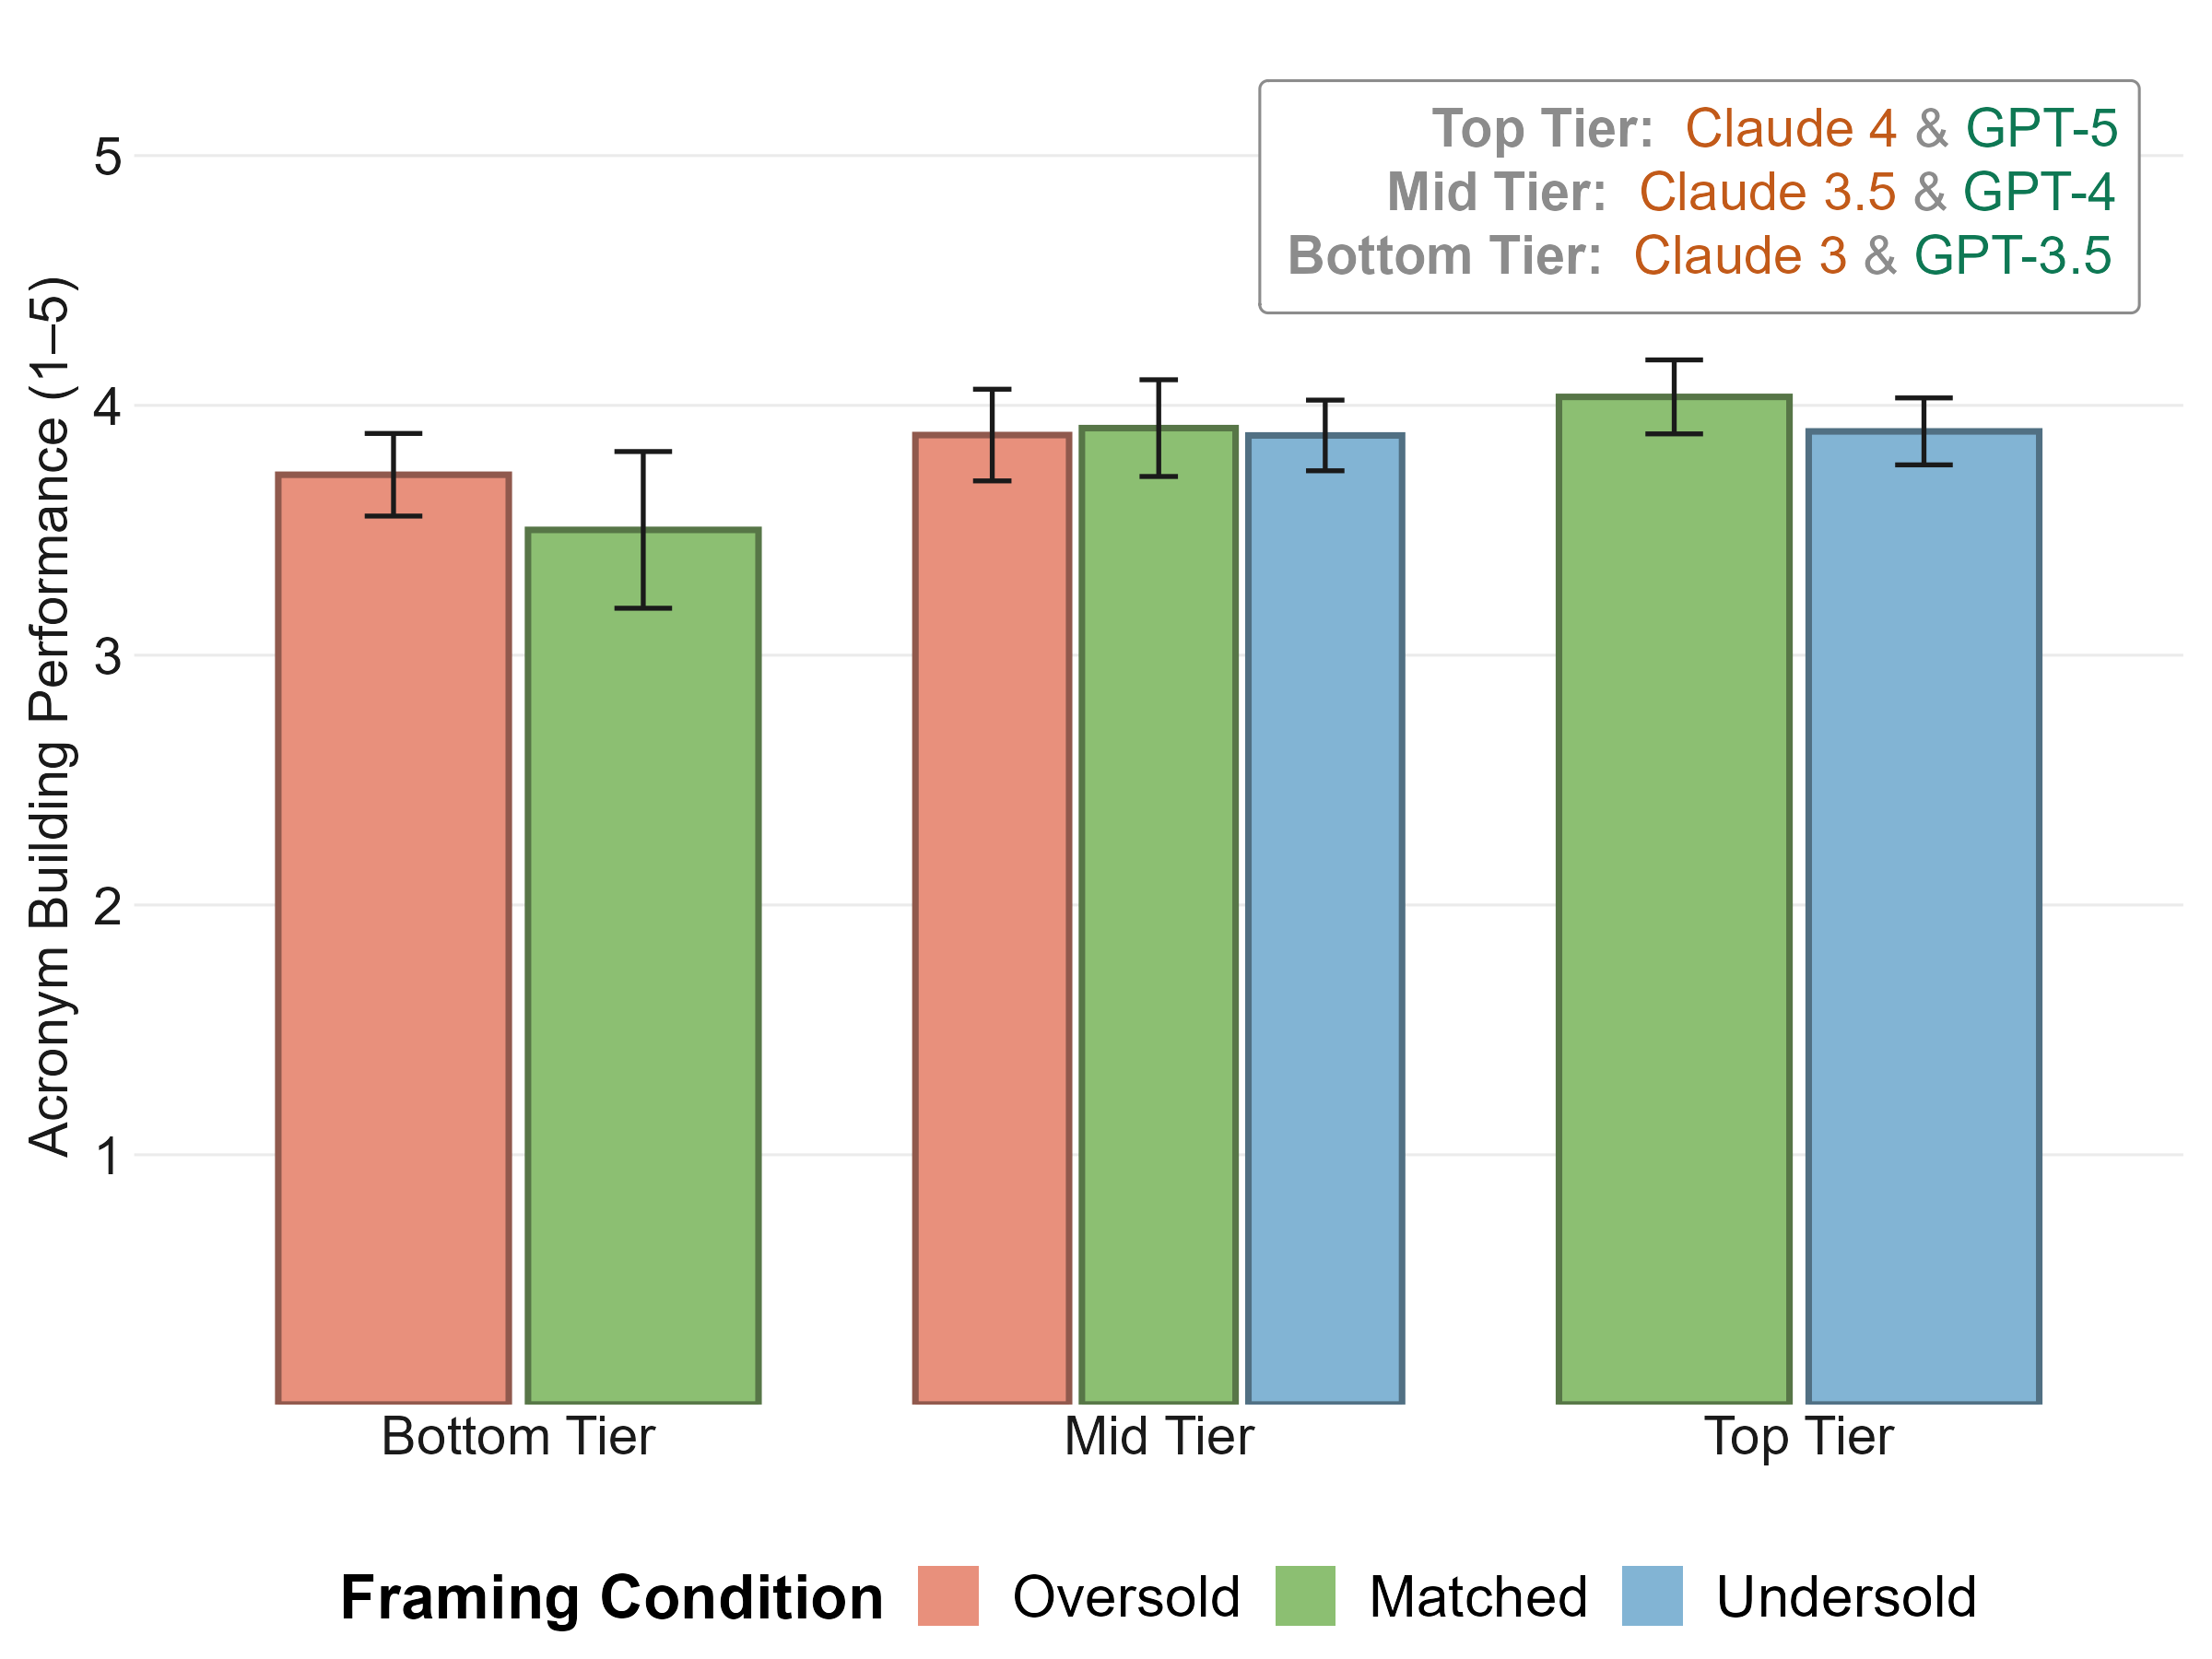
Framing did not affect the quality of what users and the model produced together. Performance increased linearly in correspondence with model tier and was flat across framing conditions within each tier (Figure 6). Oversold participants did not produce better outputs because they expected a better model and Undersold participants did not produce worse ones because they expected a weaker one.
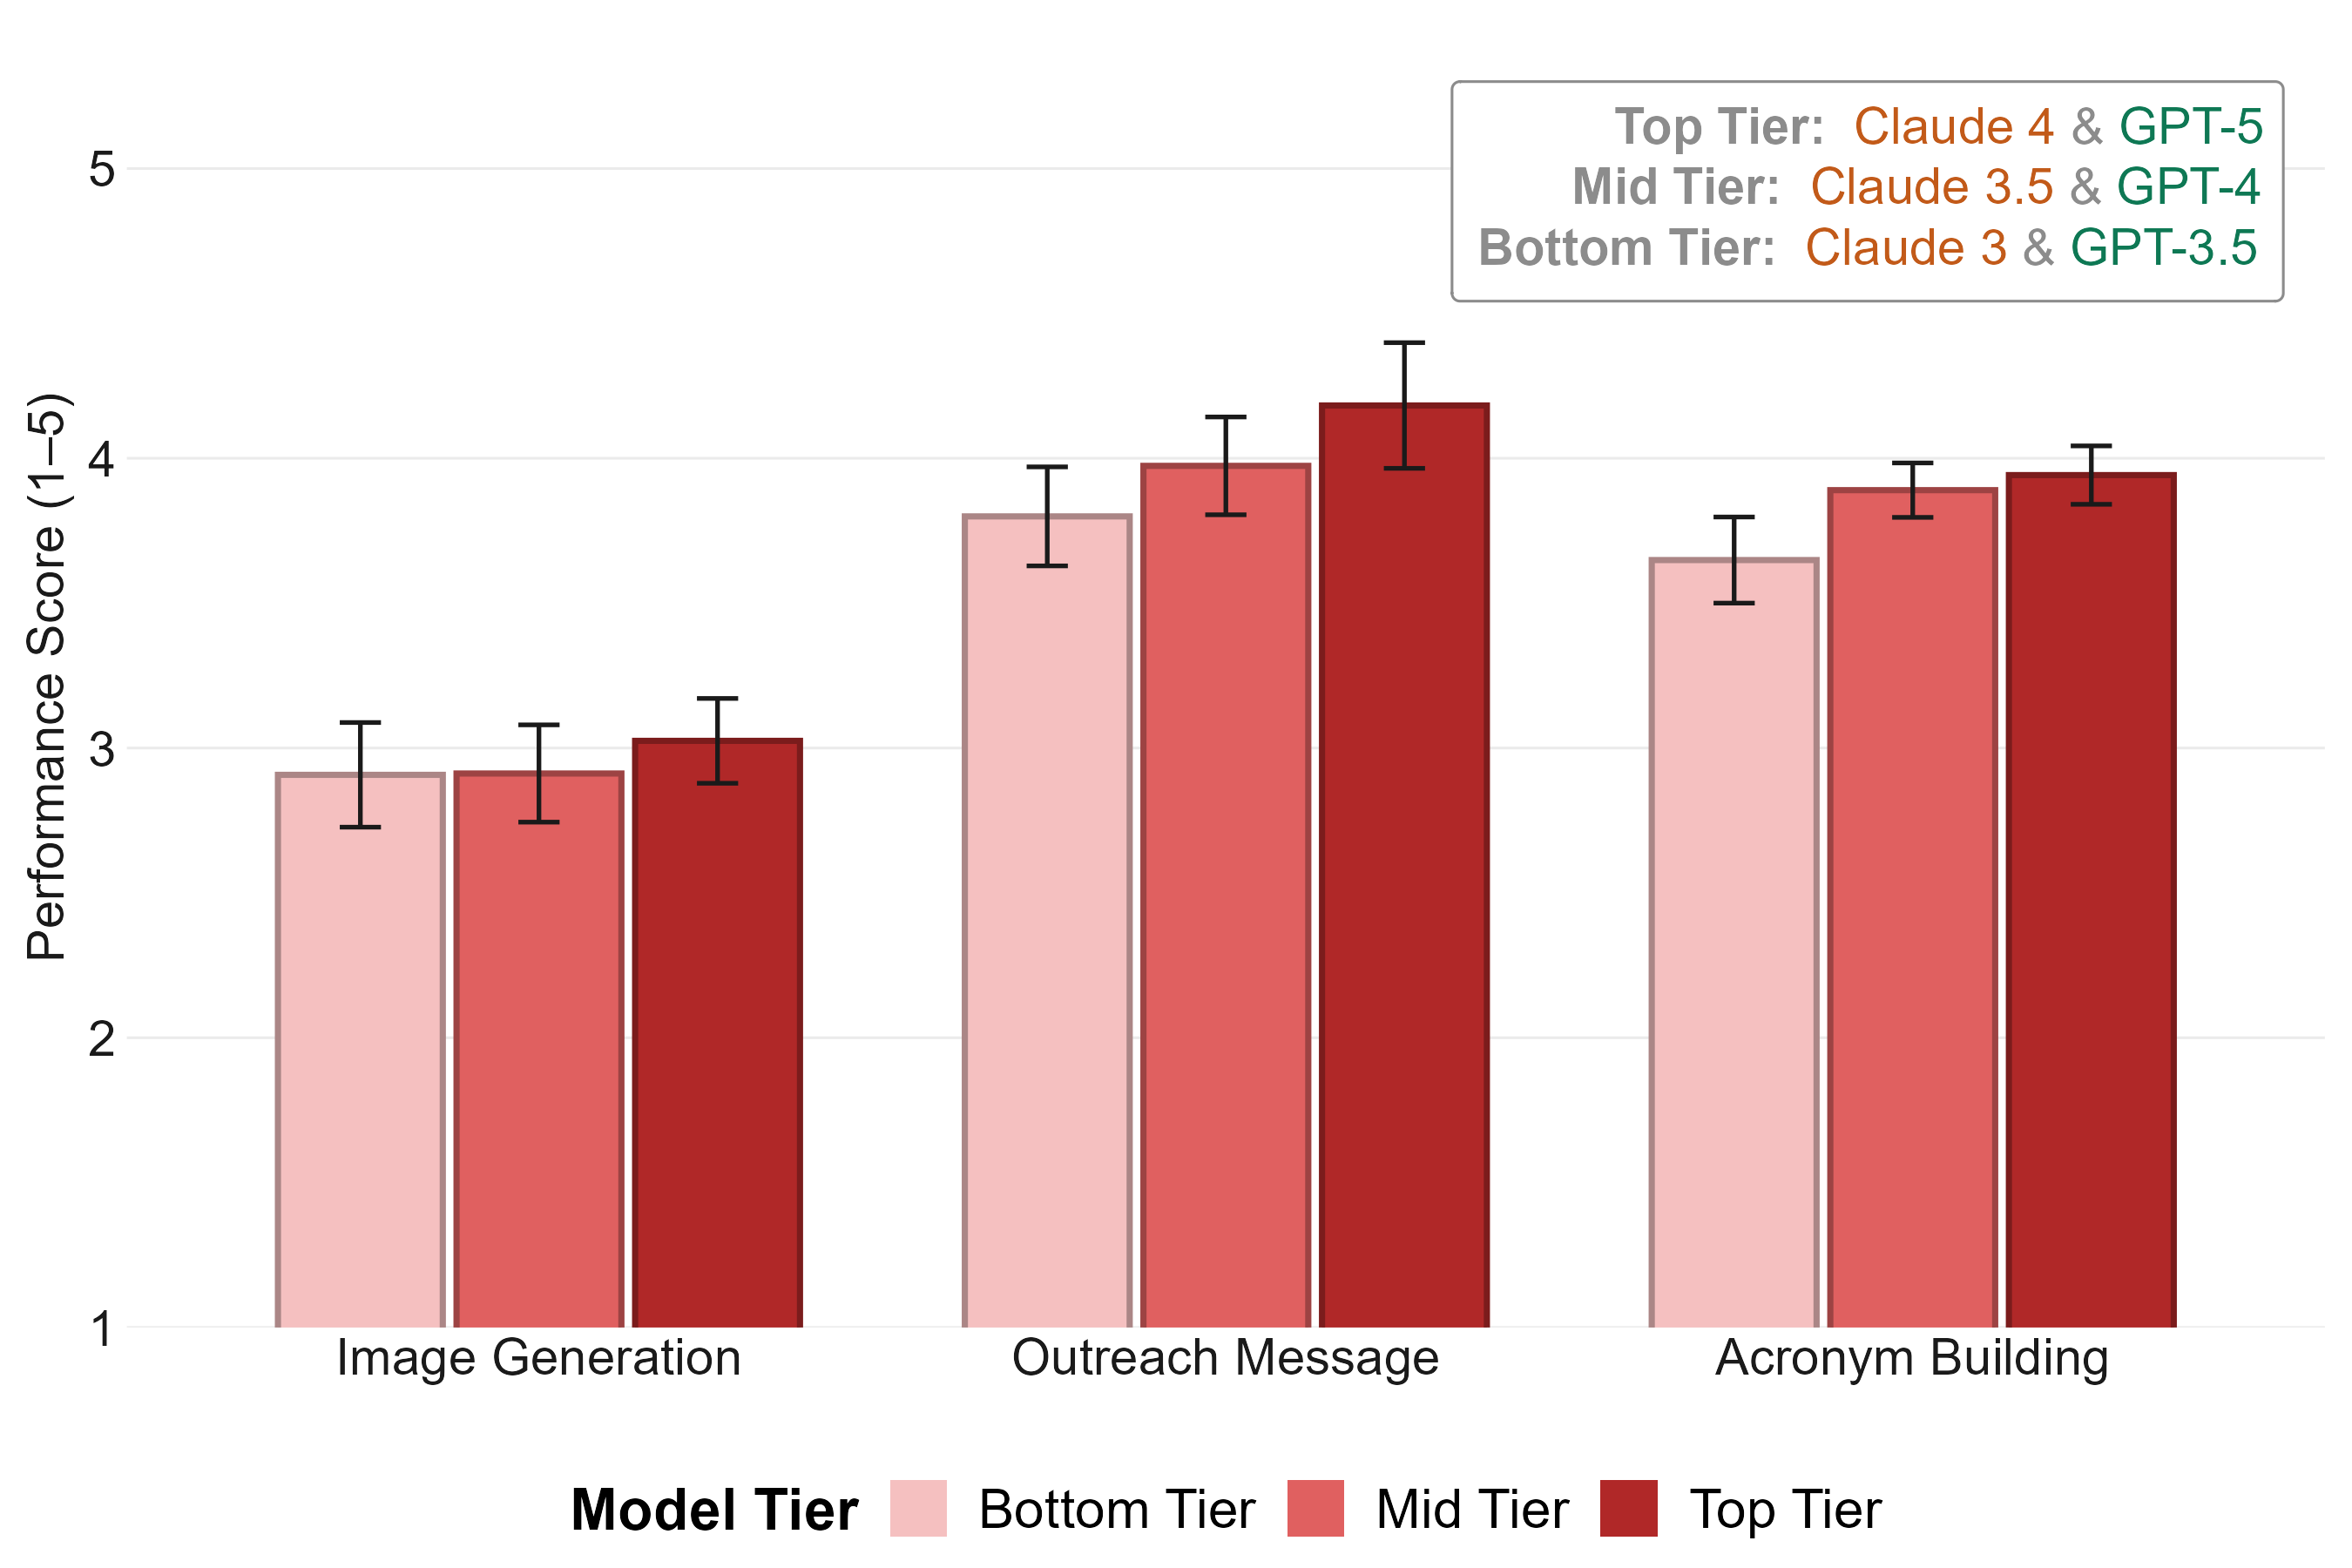
A regression of z-scored performance on framing and model tier confirms this. Model tier predicted performance (\(\beta{=}0.44\), \(p{=}0.0006\)) and framing did not (\(\beta{=}0.14\), \(p{=}0.276\)). The model tier gradient held across all three tasks individually (Figure 7). The judge registered gaps between model tiers, confirming it could detect quality differences, but found none between framing conditions.
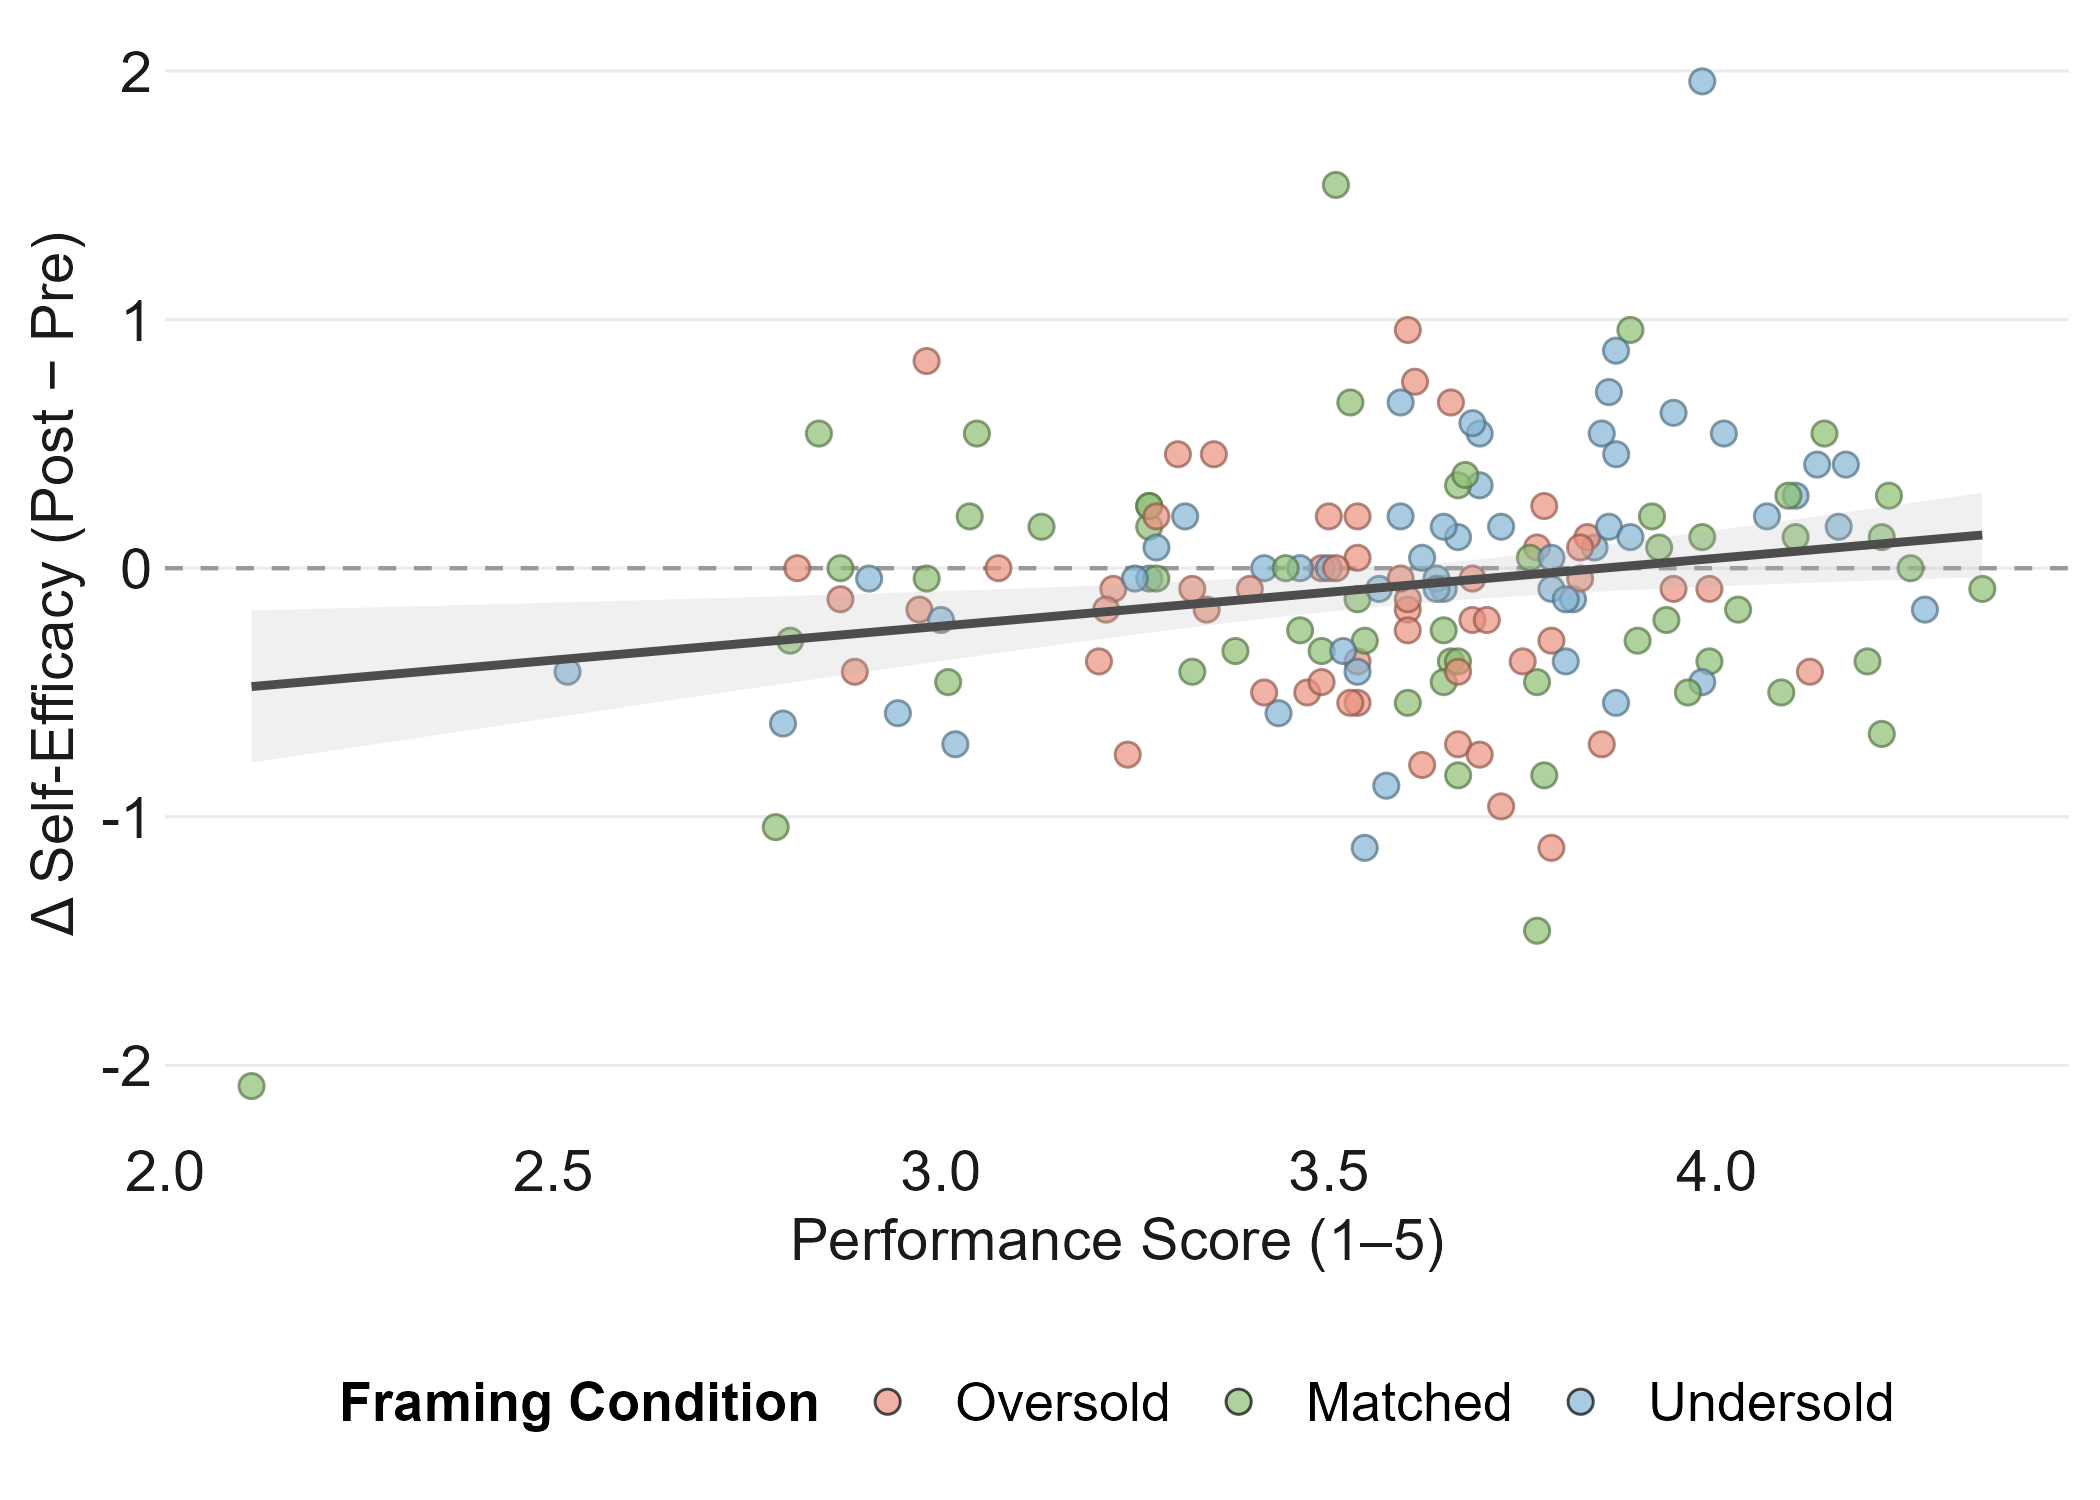
Self-efficacy change and performance were weakly correlated (\(r{=}0.21\), \(p{=}0.008\); Appendix Figure 19): participants who scored higher gained slightly more self-efficacy, but the relationship was loose and the framing conditions overlapped heavily on performance. How capable participants felt and how well they actually performed therefore tracked each other only loosely.
3.4 Impression change is driven by experience, not output↩︎
Framing shifts impressions, but not output quality. What, then, drives their change in impressions? We ran bivariate OLS regressions of \(\Delta{\mathrm{UTAUT}}\) and \(\Delta{\mathrm{Godspeed}}\) on three candidate predictors: objective task performance, self-efficacy change (\(\Delta_{\mathrm{SE}}\)), and level of expectations met. All predictors and outcomes were z-scored, so coefficients are standardized effect sizes. Results are in Table 3.
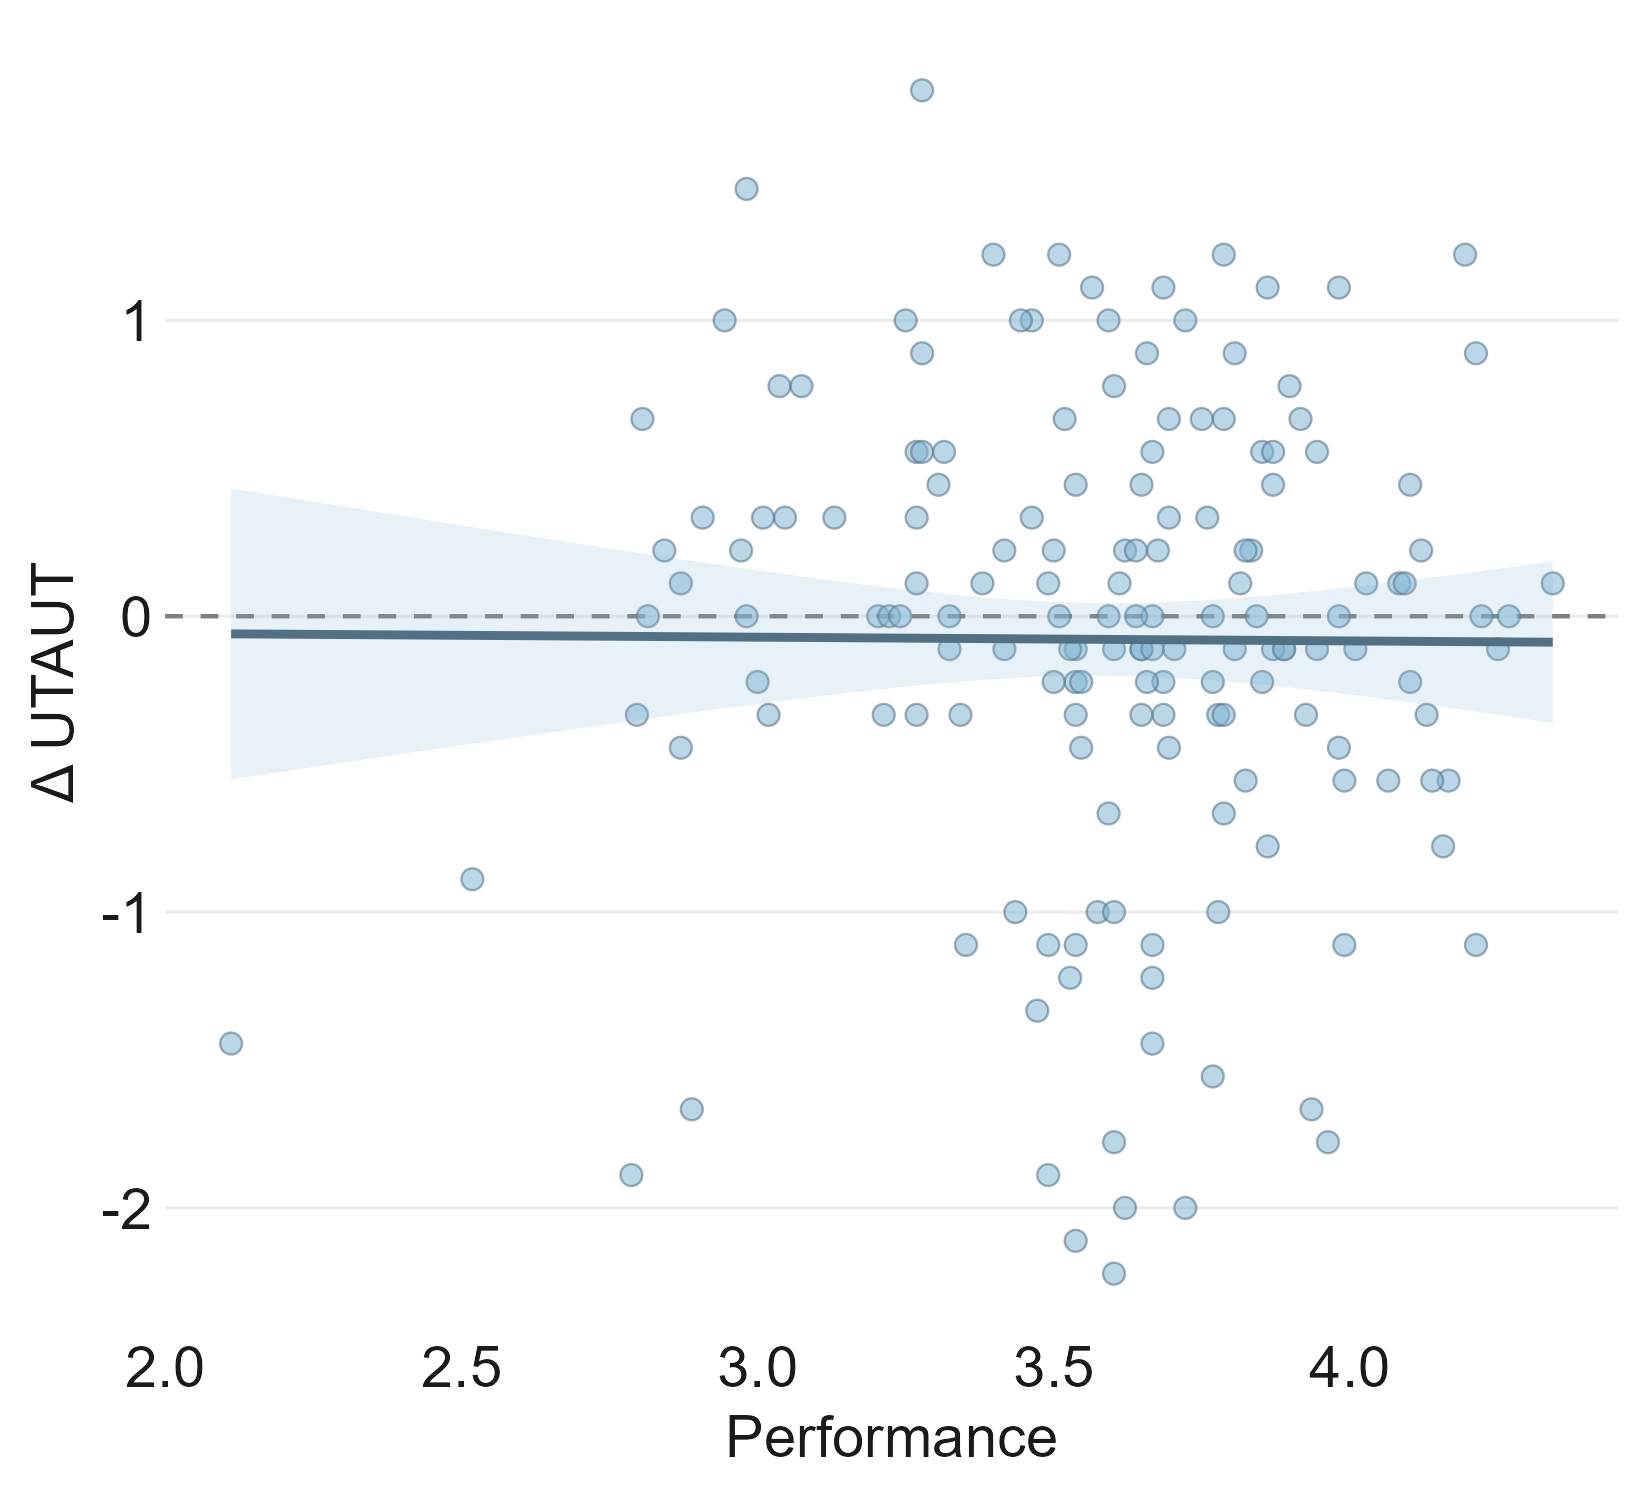
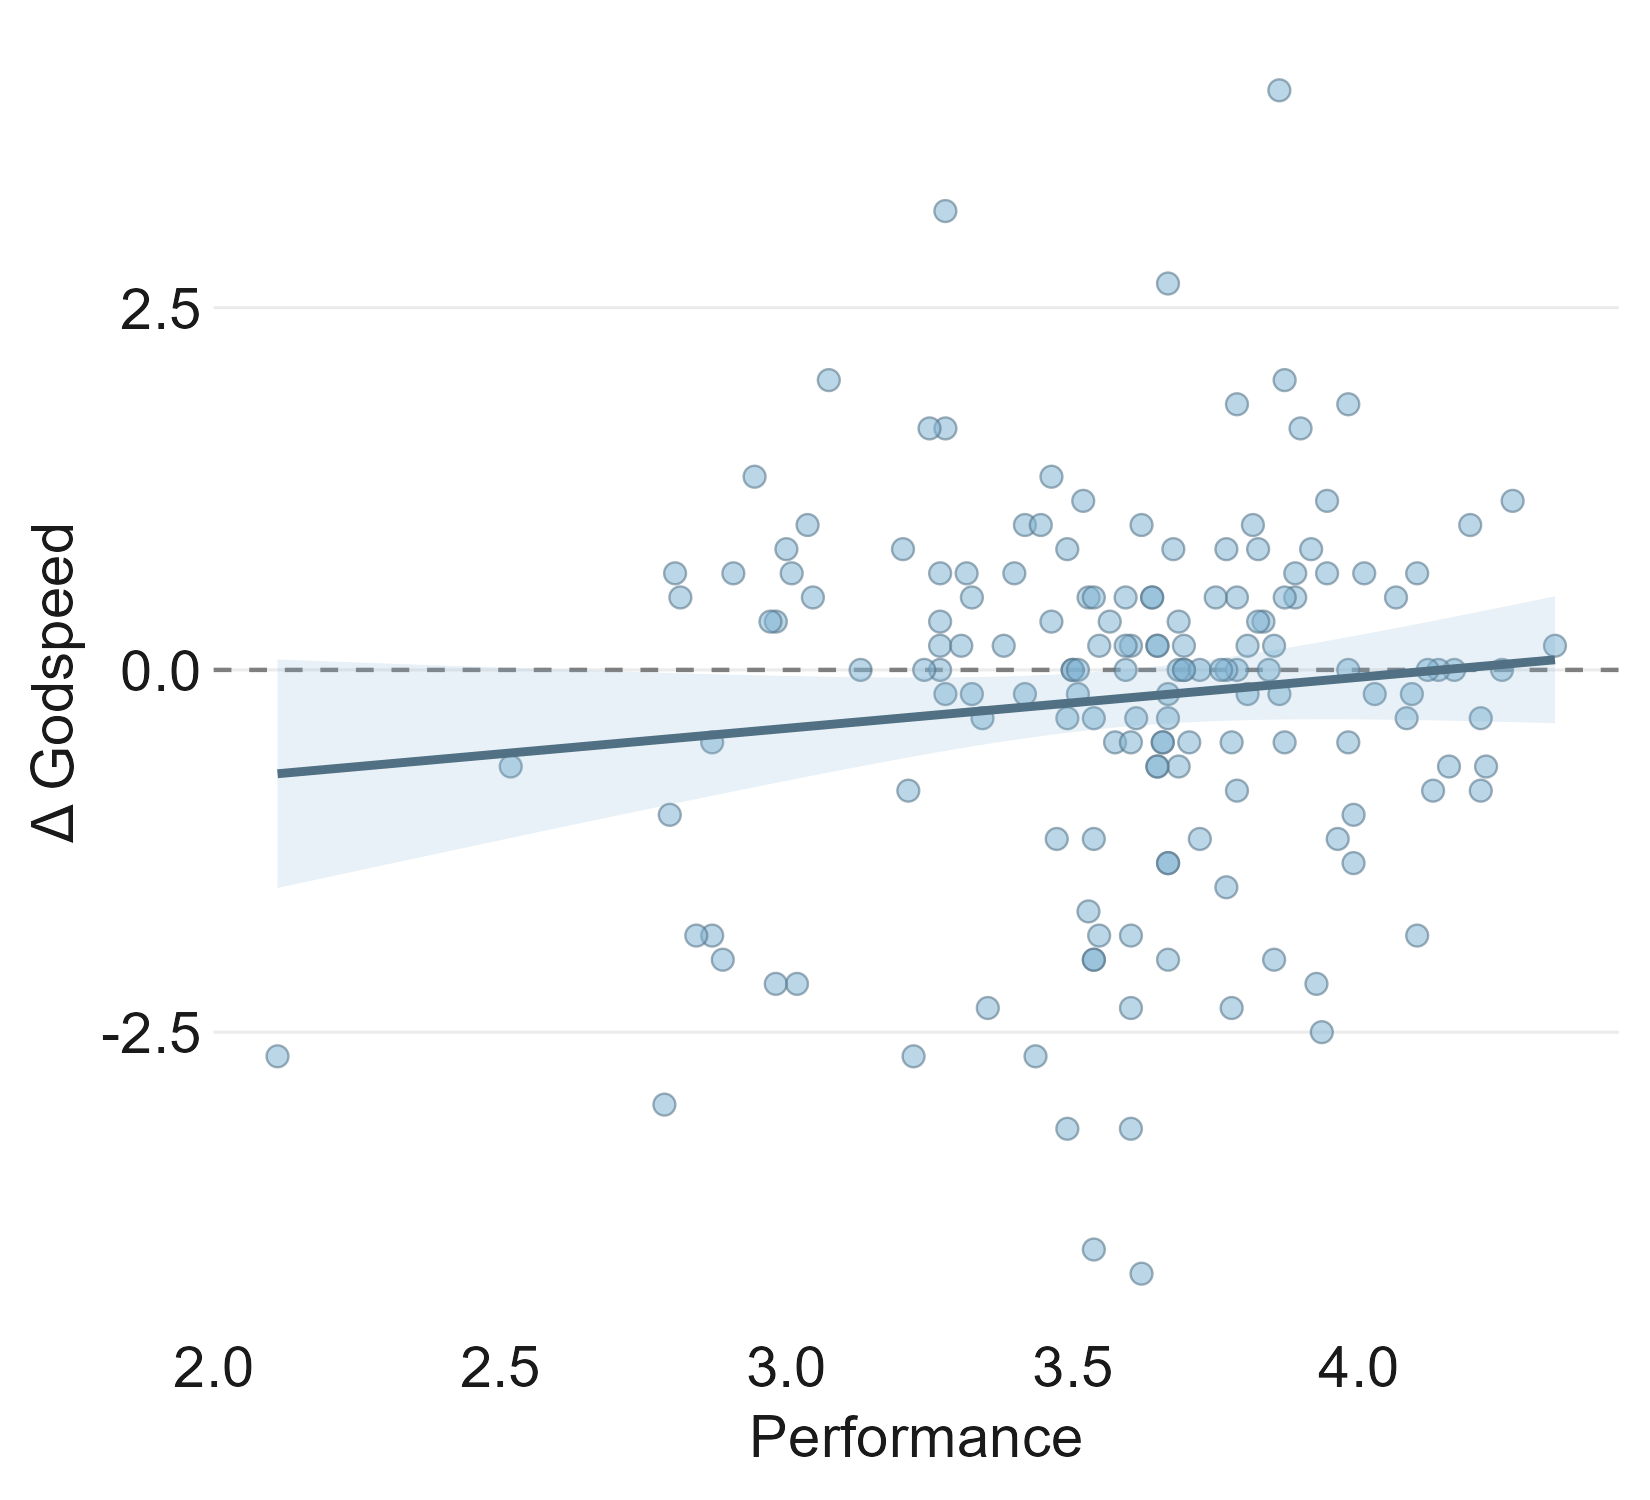
How well participants performed did not predict how their impression changed. The effect on \(\Delta{\mathrm{UTAUT}}\) was essentially zero (\(\beta{=}-0.01\), \(p{=}0.938\); Figure 8), and the effect on \(\Delta{\mathrm{Godspeed}}\), though larger, was still not significant (\(\beta{=}0.11\), \(p{=}0.180\); Appendix Figure 25). Even though output quality differed substantially across model tiers, what participants produced had no bearing on how their impression of the model shifted.
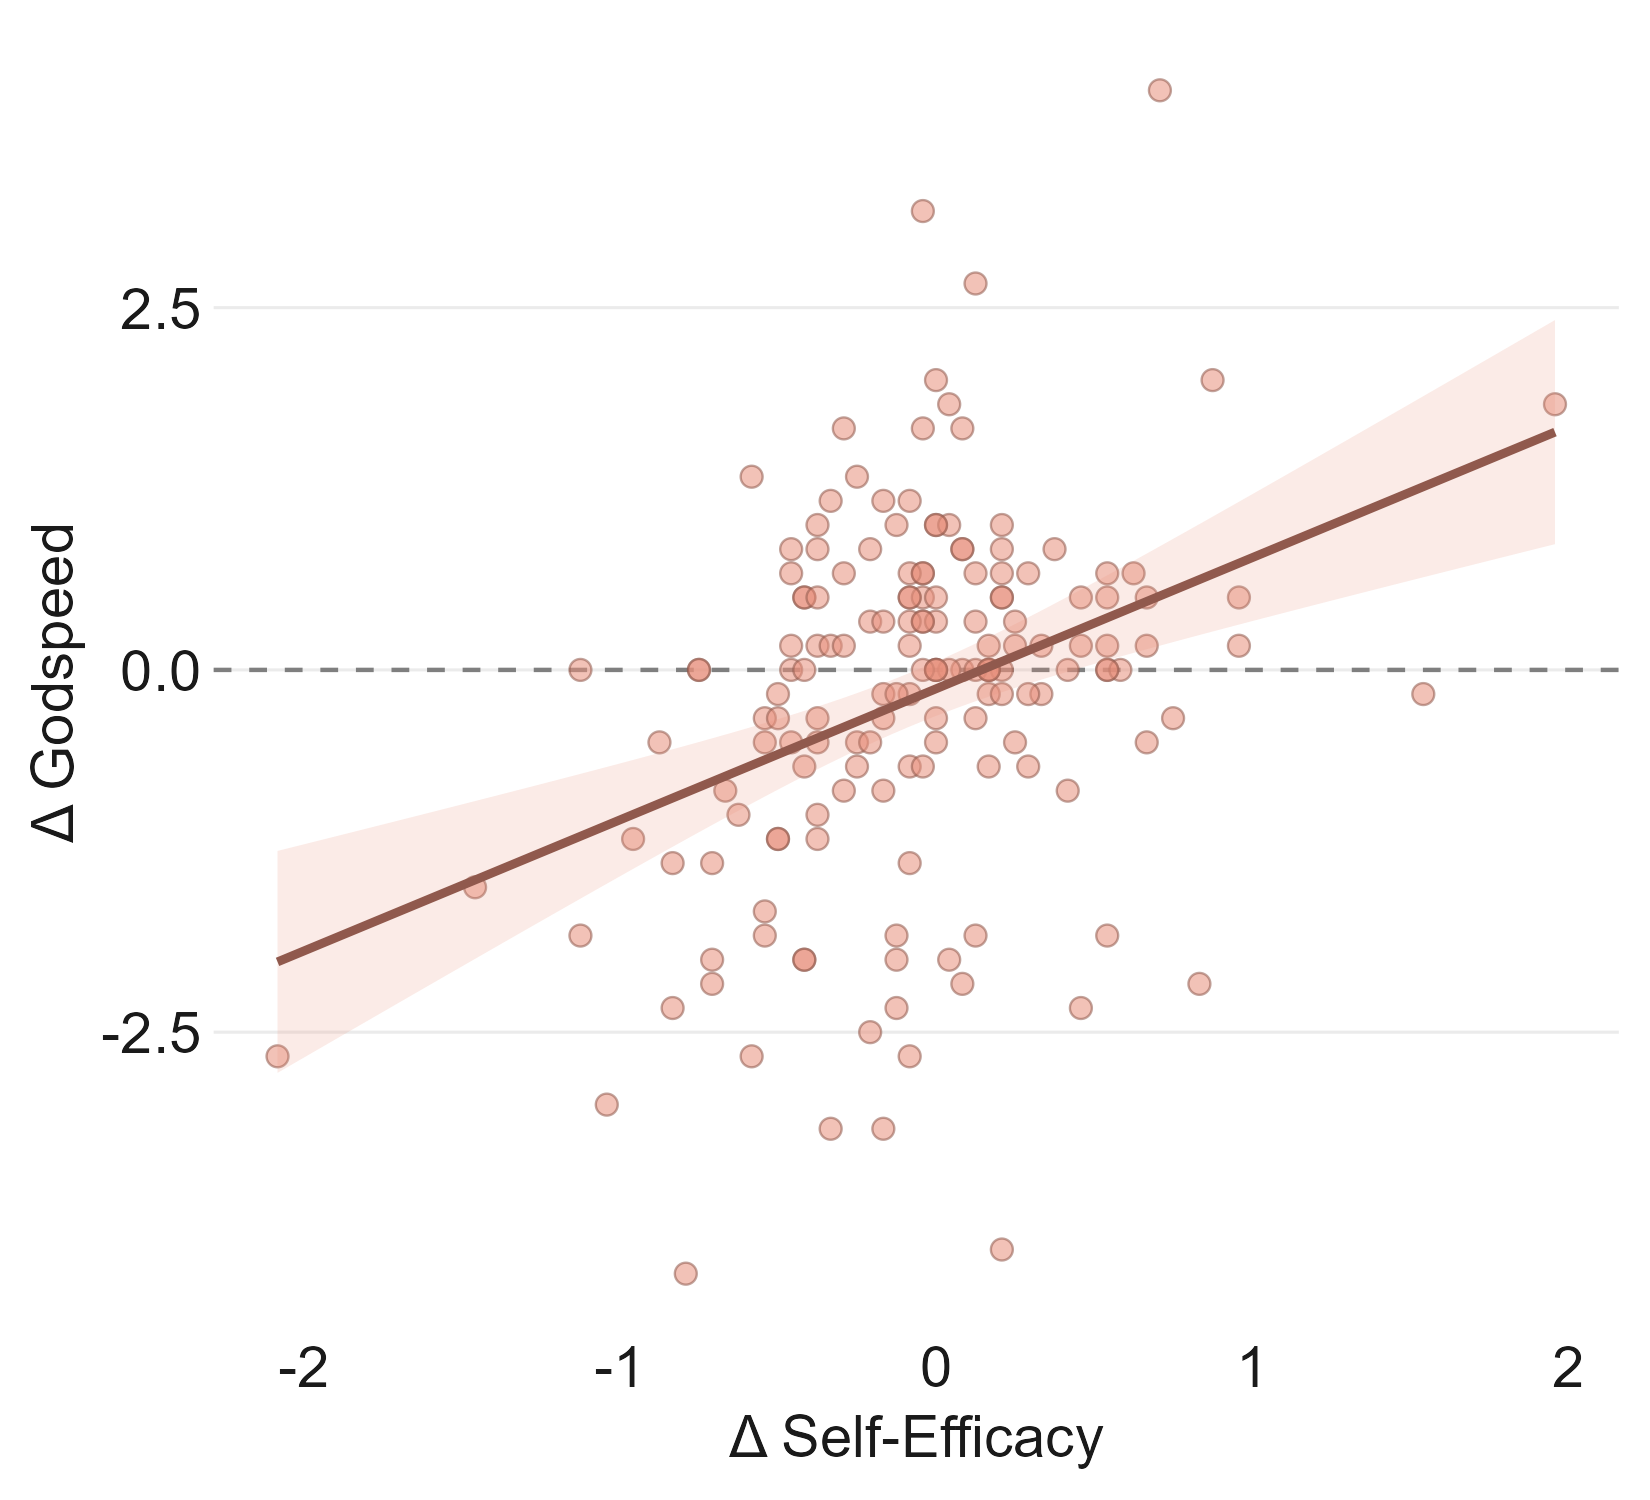
Self-efficacy change, by contrast, was a strong predictor. Participants who finished the study feeling more capable as collaborators rated the model more favorably; a one standard-deviation gain in self-efficacy corresponded to a 0.47 standard-deviation rise in \(\Delta{\mathrm{UTAUT}}\) (\(p < .001\); Figure 9) and a 0.36 standard-deviation rise in \(\Delta{\mathrm{Godspeed}}\) (\(p < .001\); Appendix Figure 26). This aligns with evidence that active AI collaboration preserves users’ sense of competence better than passive reliance does [9].
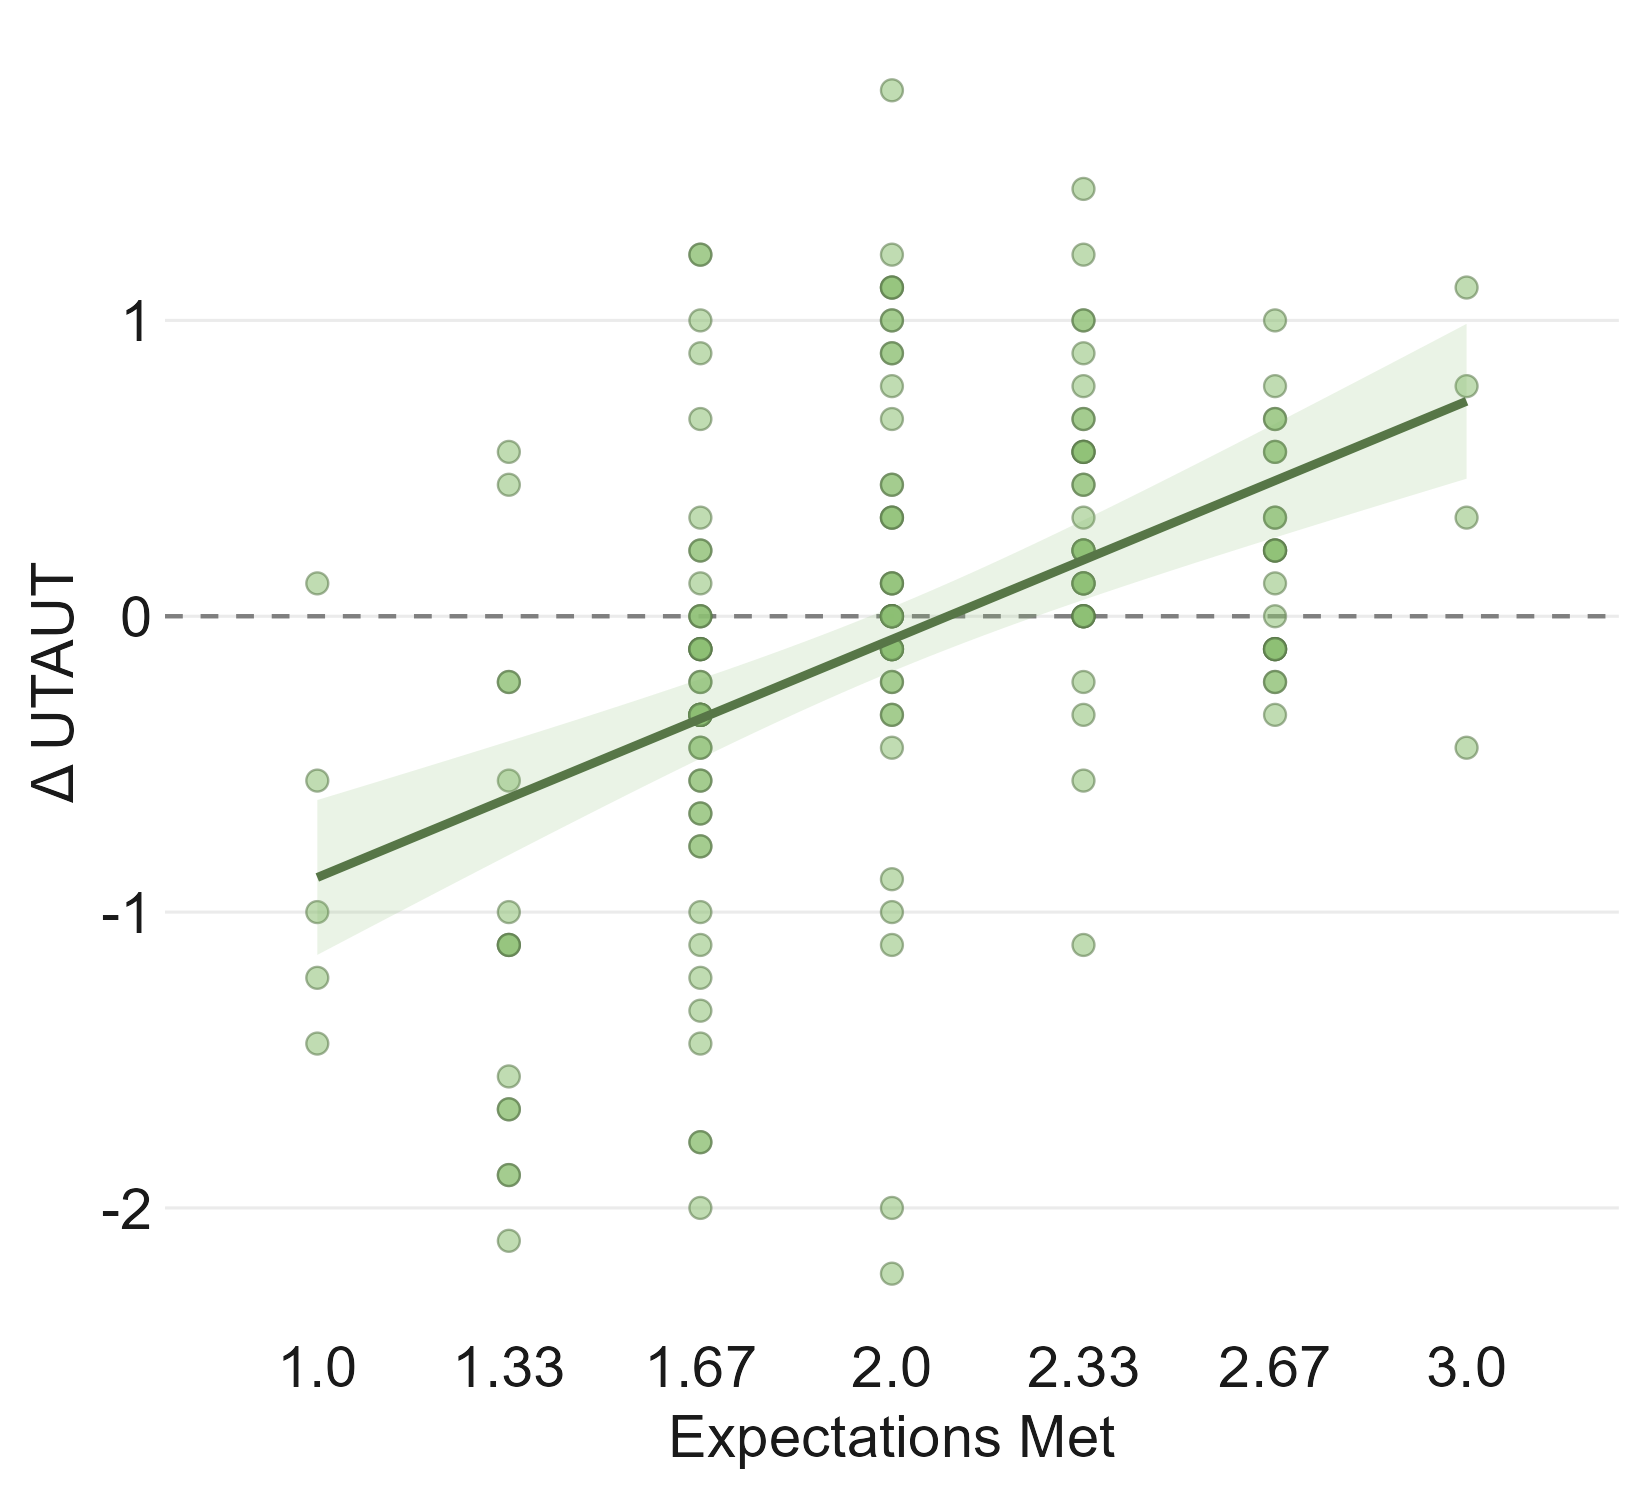
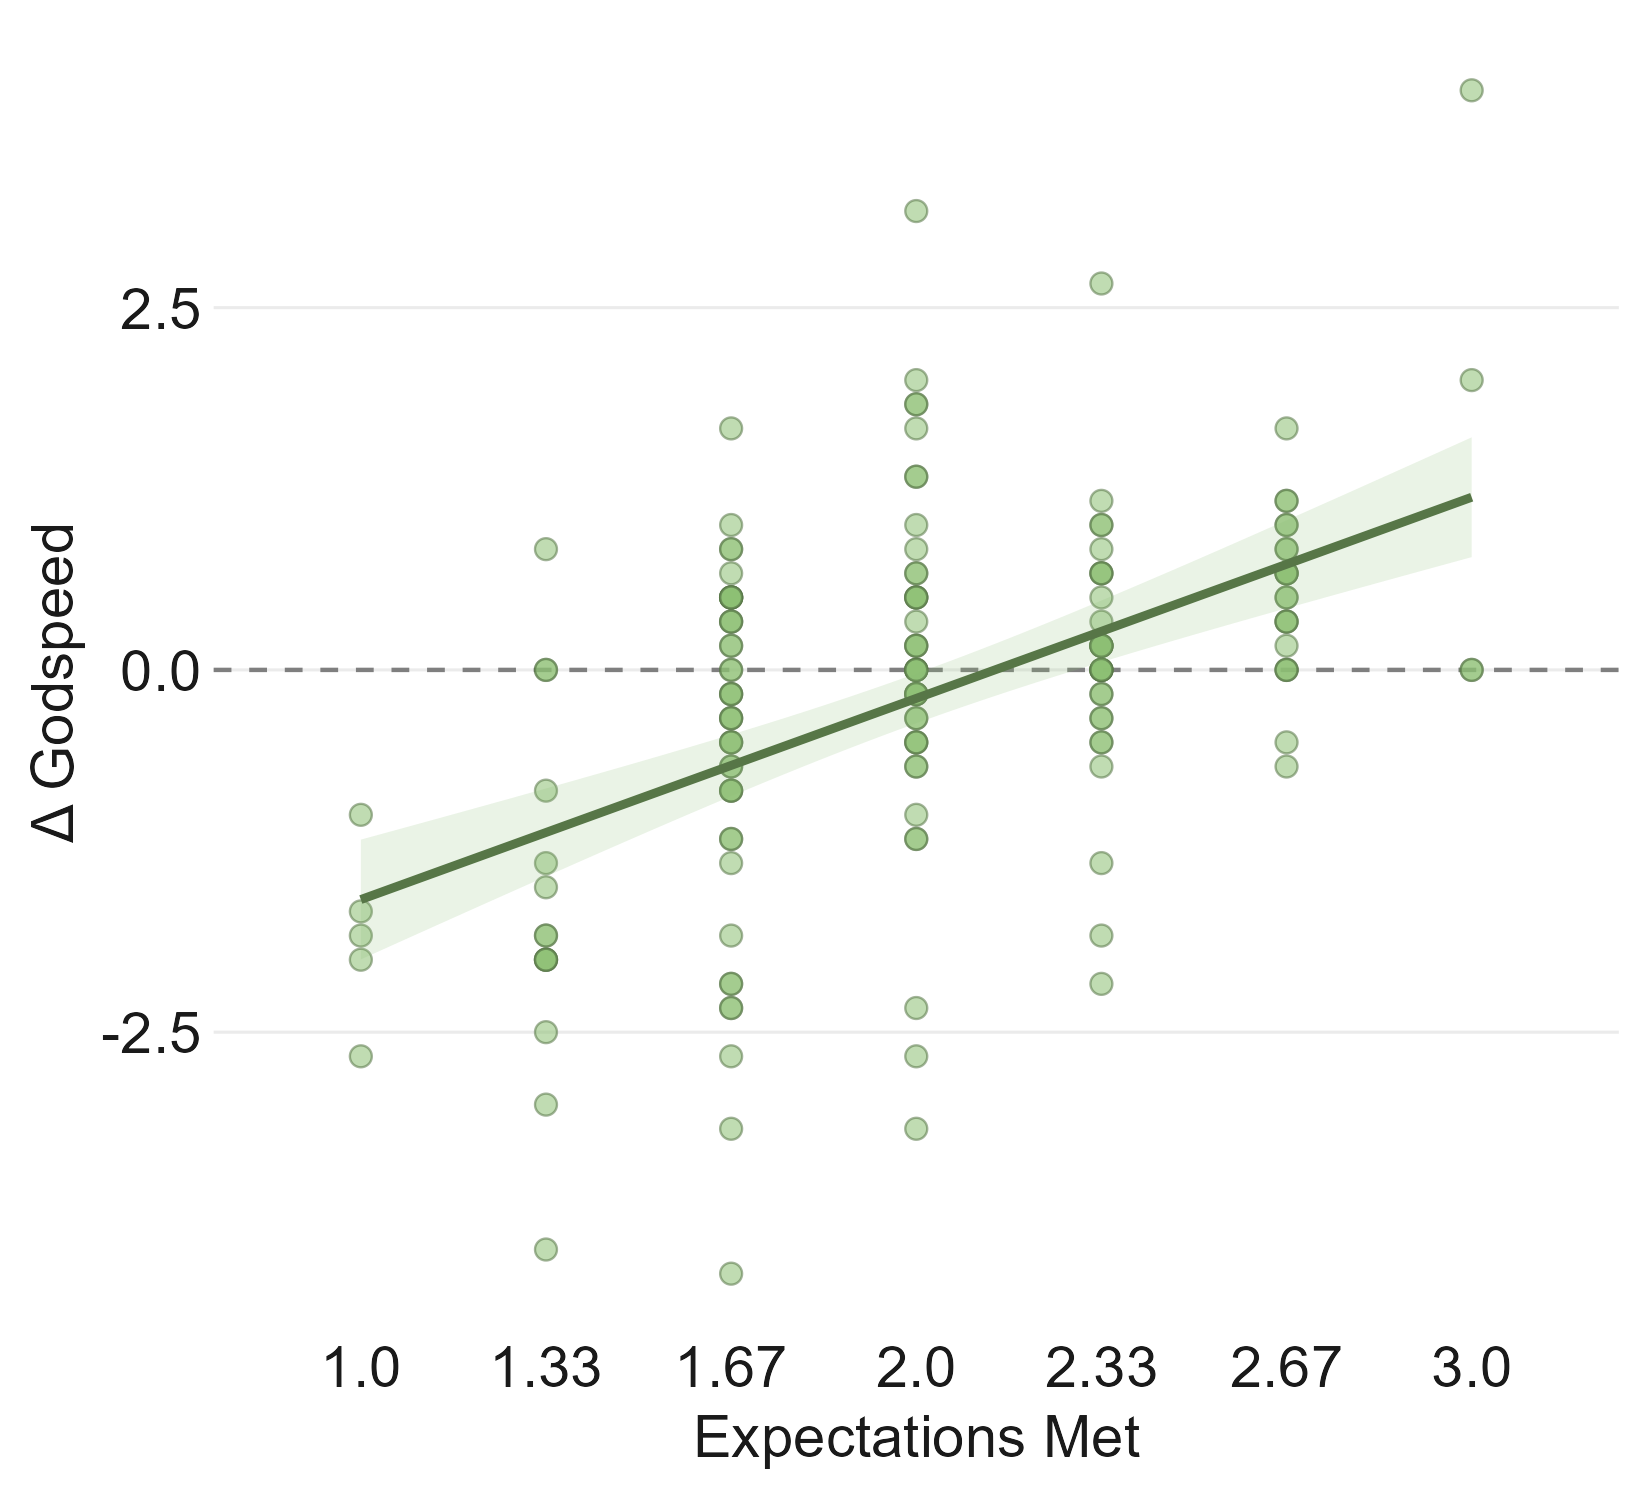
Whether the model met participants’ expectations had a comparably strong effect on impression change. Those who felt the model fell short revised their impression downward; those who felt it exceeded revised upward. A one standard-deviation increase in expectations met corresponded to a 0.47 standard-deviation gain in \(\Delta_{\mathrm{UTAUT}}\) and a 0.50 standard-deviation gain in \(\Delta_{\mathrm{Godspeed}}\) (both \(p < .001\); Appendix Figures 27 and 28).
| Predictor | Outcome | ||
|---|---|---|---|
| Performance | \(\Delta\) UTAUT | \(-\)0.01 | 0.938 |
| \(\Delta\) Godspeed | 0.11 | 0.180 | |
| \(\Delta\) UTAUT | 0.47*** | \(<\!.001\) | |
| \(\Delta\) Godspeed | 0.36*** | \(<\!.001\) | |
| \(\Delta\) UTAUT | 0.47*** | \(<\!.001\) | |
| \(\Delta\) Godspeed | 0.50*** | \(<\!.001\) |
Both experiential predictors tracked impression change, while objective performance did not. What moves users’ ratings of a model is the experience of the interaction, not the output it produced.
4 Related Work↩︎
4.0.0.1 Framing Effects in Human-AI Interaction
The presentation of AI systems shapes user perception and behavior independently of actual capability [21], [22]. Pre-interaction framing significantly alters baseline acceptance and judgments of system trustworthiness [7], [10], and these expectation cues bias evaluations upward or downward independently of actual quality [23], influence reliance decisions [24], and shape active use as users develop implicit assumptions about underlying capabilities [8], [25]. Our work builds on this by controlling the underlying model to create explicit expectation violations and examining how capability framing shifts user impressions of their assigned model.
4.0.0.2 Subjective versus Objective LLM Evaluation
Standard LLM evaluations measure true capability through automated, model-focused benchmarks [26]–[29], yet these metrics often fail to capture the contextual nuances of how users evaluate models in practice [30], [31]. Human-centric frameworks instead capture subjective experiences through in-the-moment satisfaction [32] and collaborative self-efficacy [33], but subjective perceptions frequently diverge from objective reality: evaluators rely on flawed aesthetic heuristics [34], miscalibrate confidence [35], and rate AI-labeled content lower regardless of quality [36]. Contrasting subjective self-efficacy with objective output quality allows us to directly assess which more strongly drives changes in user impressions.
4.0.0.3 Interaction Behavior with AI Models
Human interaction with LLMs ranges from directive commands to collaborative partnering [37], [38]. Researchers typically operationalize these dynamics through structural metrics like query adjustments and turn patterns [39]–[41], which are shaped more by a system’s presentation than its underlying architecture [42]. Treating capability framing as the manipulated variable lets us observe how prompting behavior shifts while output quality stays fixed.
5 Discussion and Conclusion↩︎
Because framing persists through use and reshapes how users interact, a user’s evaluation of an LLM is not a clean readout of its capability. For individual users, this means head-to-head self-reports between models of unequal reputation should be read with care: such reports encode the model’s reputation alongside its actual performance [23], [43]. For organizations deploying AI internally, the implication is more actionable: how a tool is introduced may matter as much as which tool was chosen. Overselling to drive adoption risks depressing post-deployment satisfaction; setting realistic expectations may encourage more collaborative engagement with the tool [44], [45].
Because impression change after use is driven by whether expectations were met rather than by what users produced, the way capability is communicated to users matters distinctly from the capability itself. For developers and benchmark designers, leaderboard rankings function as expectation-setting commitments [46], but the capability differences these rankings advertise are less perceptible to users during use than the rankings imply. A model marketed honestly is more likely to land in users’ exceeded expectations bucket than one marketed at its benchmark ceiling. The implication for evaluation research is sharper: user-preference data that drives pipelines like Chatbot Arena [1] partly measures expectation management [47], [48]. Without controls that hold expectations constant across compared models, such data should be read as experience relative to expectation, not capability in isolation.
LLM capability is real, and benchmarks measure something. But what users walk away believing is shaped at least as much by what they were told about a model as by what it did. The model and the message about it are not separate things to a user; they arrive together, and they leave together.
Limitations↩︎
5.0.0.1 Population.
Our sample was US-based, English-speaking, and drawn from Prolific with a high prior approval rate. Crowdsourced workers may differ from casual consumer users or workplace deployments in ways that could amplify or attenuate framing effects; replication across more naturalistic samples would test the generalizability of these effects.
5.0.0.2 Sample sizing.
The \(N{=}162\) target was derived from a Monte Carlo power analysis seeded with a pilot (\(n{=}18\)). However, effect estimates from \(n{=}18\) are themselves noisy; the final sample is therefore sized against a deliberately conservative effect estimate rather than a precise one.
5.0.0.3 Models and tier ordering.
Tier labels were anchored to public benchmark rankings at the time of data collection. The absolute capability gap between adjacent tiers is not equal across families, and the two bottom-tier models are distinct systems with different stylistic tendencies. We used two model families specifically to test the manipulation’s robustness across different lineages; that the central findings hold across both is reassuring, though a finer-grained mapping between perceived capability and benchmark position would strengthen future replications.
5.0.0.4 Task order.
Tasks were presented in a fixed order: image generation, outreach message, then acronym building. The acronym task is also the most open-ended of the three, so the larger framing effect observed there is consistent with two non-mutually-exclusive accounts: (a) framing effects concentrate on tasks where user input most shapes what counts as a good output, and (b) framing effects compound over session time as users accumulate experience filtered through their initial expectation. Our design cannot distinguish these. A counterbalanced replication would separate task openness from time-in-session and would also test whether framing effects strengthen, attenuate, or reverse across repeated exposures within a session.
5.0.0.5 LLM judges and family-specific agreement.
Task performance was rubric-scored by GPT-5 and message style was classified by claude-haiku-4-5. We averaged three independent scoring runs per output and validated the judge against three independent human raters on a subsample of
submissions (Appendix 6.6). Inter-rater ICCs among humans were modest (mean \(0.271\)), reflecting the inherent subjectivity of the rubrics, particularly for humor and
persuasiveness. Judge–human correlation matched human–human levels overall (\(\rho{=}0.301\)), but was notably stronger for Claude-family outputs (\(\rho{=}0.483\)) than for GPT-family
outputs (\(\rho{=}0.179\), n.s.). Our performance results in §3.3 should therefore be read as more reliable on the Claude side, although the central dissociation (framing affects behavior and
impressions but not output) does not depend on the absolute calibration of the judge.
5.0.0.6 Cross-sectional design.
Impression change was measured within a single session, which is appropriate for studying how framing shapes an initial impression but does not address how those effects evolve with repeated exposure. Whether framing-induced impressions persist, erode, or compound over time is a question for longitudinal designs.
5.0.0.7 Statistical testing.
We report uncorrected \(p\)-values. Our safeguard against false positives is built into the design rather than into a correction: every effect of interest replicates across the two independent impression measures (UTAUT and Godspeed), and in §3.4 across two independent experiential predictors (self-efficacy change and expectations met). This cross-measure consistency provides design-level robustness for the central effects.
5.0.0.8 Predictor independence.
Expectations-met and impression change are related but distinct: the former is rated per-task on a three-point scale immediately after each task; the latter is the difference between session-level composites on two multi-item validated scales. The two are measured on different scales, at different time points, and against different referents, so the strong association between them is informative rather than mechanical. Self-efficacy change, measured against the user’s own capability rather than the model’s, provides a fully independent experiential predictor; that both track impression change while objective performance does not is the pattern of interest.
Ethics Statement↩︎
All study procedures were approved by the authors’ institutional research ethics board prior to data collection. Participants were recruited through Prolific and provided informed consent before any study activities. They were compensated at a rate of $12.50 USD per hour to be consistent with Prolific’s recommended fair-pay guidelines, with an additional $10 performance bonus available on each of the tasks. No personally identifying information was collected; participant records were keyed only by Prolific worker ID, which was discarded after compensation processing. Conversation logs and survey responses were stored on access-controlled infrastructure. Participants were informed in the consent form that they would be interacting with a large language model and that their interactions would be analyzed; the specific framing manipulation was disclosed in a debrief at the end of the study.
The framing manipulation involved presenting some participants with a model description that did not match the model they actually used. This deception was minimal, time-limited, fully reversed in the debrief, and judged by the ethics review board to pose no risk of harm. We see no reasonably foreseeable harms from the methods or findings of this work; if anything, the findings argue for more transparent communication of AI system capability to users.
6 Appendix↩︎
This appendix collects the survey instruments, task materials, evaluation rubrics, example outputs, and supplementary analyses referenced in the main paper.
6.1 Survey Instruments↩︎
This section reproduces the items used in each scale, describes how each was administered, and describes how composite scores were computed.
6.1.0.1 Administration.
The UTAUT performance expectancy and effort expectancy subscales, along with one additional engagement item, were administered in future tense before the study and in past tense after the study, with one embedded attention check per administration (Table 4). The Godspeed Perceived Intelligence subscale (Table 6) used the same five bipolar adjective items both pre- and post-study, as well as one additional bipolar adjective of "Artificial vs Natural". The task-specific NGSE items (Table 5) were administered before each of the three tasks in future tense and after each task in past tense.
6.1.0.2 UTAUT composites.
Each administration yields a single score: the arithmetic mean of all non-attention items on a 1–5 Likert scale. Pre-study UTAUT is the mean across the pre-study items (Table 4, left column); post-study UTAUT is the mean across the post-study items (right column). \(\Delta{\mathrm{UTAUT}}\) is post-study minus pre-study.
6.1.0.3 Godspeed Perceived Intelligence composites.
The six bipolar items (Table 6) are each rated on a 1–7 semantic differential scale and averaged. The same items appear pre- and post-study; \(\Delta{\mathrm{Godspeed}}\) is post-study minus pre-study.
6.1.0.4 Task-specific NGSE composites.
Each task has eight task-specific items (Table 5), each rated on a 1–5 Likert scale. The pre-task and post-task scores for a given task are the mean across non-attention items. Per-task self-efficacy change is post-task minus pre-task. Overall self-efficacy change (\(\Delta_{\mathrm{SE}}\)) is the unweighted mean of the three per-task changes.
6.1.0.5 Expectations met.
After each task, participants chose one of three options describing whether the model fell short of, met, or exceeded their expectations for that task. The three options were coded as \(1\), \(2\), and \(3\) respectively. The composite expectations-met score used in §3.4 is the average of the three per-task codings, ranging from \(1\) (fell short on all three) to \(3\) (exceeded on all three).
| Pre-study (future tense) | Post-study (past tense) |
|---|---|
| Performance Expectancy | |
| 1. I think that I will find this chatbot useful | 1. I found this chatbot useful |
| 2. I expect that using this chatbot will enable me to accomplish tasks more quickly | 2. Using this chatbot enabled me to accomplish tasks more quickly |
| 3. I expect that using this chatbot will increase my productivity | 3. Using this chatbot increased my productivity |
| 4. If I use this chatbot, I feel I will increase my chances of getting my work done successfully | 4. Using this chatbot, I felt my chances of getting my work done successfully was increased |
| Effort Expectancy | |
| 5. I think I will find this chatbot easy to use | 5. Please select “Disagree” for this item. |
| 6. I think my interactions with this chatbot will be clear and understandable | 6. I found this chatbot easy to use |
| 7. I feel that it will be easy for me to become skillful at using this chatbot | 7. My interactions with this chatbot were clear and understandable |
| 8. Select “Strongly Agree” for this statement. | 8. It was easy for me to become skillful at using this chatbot |
| 9. I expect that learning to operate this chatbot will be easy for me | 9. Learning to operate this chatbot was easy for me |
| Additional Engagement Item | |
| 10. I plan to use the chatbot as much as possible during the tasks | 10. I used the chatbot as much as possible during the tasks |
| Pre-task (future tense) | Post-task (past tense) |
|---|---|
| Image generation task | |
| 1. I will be able to generate an image closest to the target image using the chatbot. | 1. I was able to generate an image closest to the target image using the chatbot. |
| 2. When facing difficulty with the image generation task, I am certain I will still accomplish it with the chatbot. | 2. When facing difficulty with the image generation task, I was certain I would still accomplish it with the chatbot. |
| 3. In general, I think that I can obtain outcomes that are important to achieving the target image using the chatbot. | 3. In general, I thought that I obtained outcomes that were important to achieving the target image using the chatbot. |
| 4. I believe I can succeed at the image generation task using the chatbot. | 4. I believe I succeeded at the image generation task using the chatbot. |
| 5. I will be able to successfully overcome challenges in the image generation task using the chatbot. | 5. I was able to successfully overcome challenges in the image generation task using the chatbot. |
| 6. Using the chatbot, I am confident that I can perform the image generation task effectively. | 6. Using the chatbot, I was confident that I performed the image generation task effectively. |
| 7. Compared to other people, I can do the image generation task very well with the chatbot. | 7. Compared to other people, I think I did the image generation task very well with the chatbot. |
| 8. Even when generating the target image is tough, I can perform quite well with the chatbot. | 8. Even when generating the target image was tough, I performed quite well with the chatbot. |
| Outreach message writing task | |
| 1. I will be able to write the most convincing message using the chatbot. | 1. I was able to write the most convincing message using the chatbot. |
| 2. When facing difficulty with the message writing task, I am certain I will still accomplish it with the chatbot. | 2. When facing difficulty with the message writing task, I was certain I would still accomplish it with the chatbot. |
| 3. In general, I think that I can obtain outcomes that are important to writing a convincing message using the chatbot. | 3. In general, I thought that I obtained outcomes that were important to writing a convincing message using the chatbot. |
| 4. Even if you don’t agree, select Neutral below. | 4. I believe I succeeded at the message writing task using the chatbot. |
| 5. I believe I can succeed at the message writing task using the chatbot. | 5. I was able to successfully overcome challenges in the message writing task using the chatbot. |
| 6. I will be able to successfully overcome challenges in the message writing task using the chatbot. | 6. Using the chatbot, I was confident that I performed the message writing task effectively. |
| 7. Using the chatbot, I am confident that I can perform the message writing task effectively. | 7. Compared to other people, I think I did the message writing task very well with the chatbot. |
| 8. Compared to other people, I can do the message writing task very well with the chatbot. | 8. Even when writing the message was tough, I performed quite well with the chatbot. |
| 9. Even when writing the message is tough, I can perform quite well with the chatbot. | |
| Acronym building task | |
| 1. I will be able to create the funniest acronyms using the chatbot. | 1. I was able to create the funniest acronyms using the chatbot. |
| 2. When facing difficulty with the acronym creation task, I am certain I will still accomplish it with the chatbot. | 2. When facing difficulty with the acronym creation task, I was certain I would still accomplish it with the chatbot. |
| 3. In general, I think that I can obtain outcomes that are important to creating a funny acronym using the chatbot. | 3. In general, I thought that I obtained outcomes that were important to creating a funny acronym using the chatbot. |
| 4. I believe I can succeed at the acronym creation task using the chatbot. | 4. I believe I succeeded at the acronym creation task using the chatbot. |
| 5. I will be able to successfully overcome challenges in the acronym creation task using the chatbot. | 5. I was able to successfully overcome challenges in the acronym creation task using the chatbot. |
| 6. Using the chatbot, I am confident that I can perform the acronym creation task effectively. | 6. Using the chatbot, I was confident that I performed the acronym creation task effectively. |
| 7. Compared to other people, I can do the acronym creation task very well with the chatbot. | 7. Compared to other people, I think I did the acronym creation task very well with the chatbot. |
| 8. Even when the acronym creation is tough, I can perform quite well with the chatbot. | 8. Even when the acronym creation was tough, I performed quite well with the chatbot. |
| Perceived Intelligence |
|---|
| Incompetent – Competent |
| Ignorant – Knowledgeable |
| Irresponsible – Responsible |
| Unintelligent – Intelligent |
| Foolish – Sensible |
| Additional Pair |
| Artificial – Natural |
| Sales Representative – Dr. Rogers’ Premier Office Furniture |
We’re seeking an energetic sales representative to join our established furniture dealership serving businesses across the region. You’ll build relationships with office managers, architects, and facility planners to provide complete workspace solutions. Key responsibilities:
Requirements:
What we offer: |
| Base salary ($40K) plus commission (avg.total $65K–80K), company car allowance, health benefits, and 401K matching in a stable, family-owned business. Ready to build your sales career with us? |

| Criterion | Scale |
|---|---|
| Image Generation | |
| Accuracy. The generated image contains the same key objects, subjects, and elements as the target. | 1 = Most key elements missing or wrong 5 = All key elements present and correct |
| Similarity. Layout, arrangement, and spatial relationships between elements match the target. | 1 = Completely different arrangement 5 = Nearly identical layout and positioning |
| Style. Overall visual feel (color palette, lighting, atmosphere) matches the target. | 1 = Completely different feel 5 = Very similar visual style and mood |
| Overall Resemblance. How similar the generated image is to the target overall. | 1 = Not similar at all 5 = Very close match |
| Outreach Message Writing | |
| Naturalness. The message feels like it was written by a real person rather than an AI. | 1 = Definitely AI-sounding 5 = Definitely human-sounding |
| Professionalism. The tone and style are appropriate for professional communication with a recruiter. | 1 = Very unprofessional (casual, rude, etc.) 5 = Very professional (clear, respectful, polished) |
| Persuasiveness. How likely the reader would respond or be interested in the candidate. | 1 = Not persuasive at all 5 = Very persuasive and credible |
| Quality. The message is written well and coherently. | 1 = Written very poorly 5 = Written very well |
| Acronym Building | |
| Amusement. How funny the acronym is. | 1 = Not funny at all 5 = Extremely funny |
| Novelty. The acronym shows a clever or novel twist; not predictable. | 1 = Very predictable 5 = Very clever or unexpected |
| Coherence. The expanded phrase makes sense and follows the given letters correctly. | 1 = Does not make sense / wrong letter order 5 = Makes sense and fits letters perfectly |
| Benignness. The acronym is appropriate; not offensive or harmful. | 1 = Offensive / inappropriate 5 = Completely appropriate |
0pt 0pt
| High-scoring outreach message (rubric mean 5.00) |
|---|
| Dear Dr. Rogers, I’m ready to step in as your next Sales Representative and drive growth for your established furniture dealership serving businesses across the region. In my previous territory, I generated new business through cold calling, networking, and referrals, averaging 45 targeted calls a day and 8–10 first meetings a week, which powered six straight quarters at 120%+ to quota and $1.1M TTM. I conducted site visits and presented furniture solutions to office managers, architects, and facility planners, turning walk-throughs into tailored proposals that raised our win rate from 22% to 33% and shortened the sales cycle by two weeks. I prepared quotes, negotiated contracts, and managed the sales process end to end, with a $22K average deal size and on-time installs. After the sale, I maintained relationships with existing accounts and identified growth opportunities: 95% retention, 35% average expansion within six months, and 30% of revenue from referrals. Give me 90 days to map the territory, fill the pipeline, and close early wins while setting up steady expansion. I’d welcome a conversation on how I can help grow your market share. Best regards, |
| J. Doe |
| Low-scoring outreach message (rubric mean 2.33) |
| Dear Hiring Manager, I am excited to apply for the Sales Representative position at Dr. Rogers’ Premier Office Furniture. In my previous roles, I have successfully generated new business through cold calling, networking, and referrals. I excel in conducting site visits and presenting tailored furniture solutions to potential clients. My experience includes preparing quotes, negotiating contracts, and managing the sales process efficiently. I have a proven track record of maintaining strong relationships with existing accounts and identifying growth opportunities. I am confident that my skills and experiences make me a strong fit for this role and I am eager to contribute to the success of your team. Thank you for considering my application. I look forward to discussing how I can bring value to Dr. Rogers’ Premier Office Furniture. Warm regards, |
| [Your Name] |
6.2 Task Materials↩︎
This section reproduces the materials participants saw: the capability framing landing page (Figure 10), the chat interface they used to complete all three tasks (Figure 11), the fixed target image for the image generation task (Figure 14), and the job description used in the outreach message task (Table 7).

6.3 Evaluation Rubrics and Example Outputs↩︎
Submitted outputs were scored by an LLM judge (GPT-5) against four rubric dimensions per task (Table 8). To illustrate the spread of submissions on each task, Figures 12 and 13 show a high- and low-scoring image submission. Tables 9 and 10 give high- and low-scoring outreach and acronym submissions.
| High-scoring acronyms (rubric mean 4.22) | |
|---|---|
| BLMPF | Book Lovers Mourn Poor Films |
| CRTW | Cats Request Tuna Weekends |
| YOLD | Your Orientation Lacks Direction |
| Low-scoring acronyms (rubric mean 2.83) | |
| BLMPF | Boat Lamp Milk Pen Flower |
| CRTW | Cat Rabbit Turtle Watermelon |
| YOLD | Yacht Owl Lemon Dog |
6.4 Collaborative/Directive Classification↩︎
For the message classification pipeline, we used claude-haiku-4-5 to label each participant message as collaborative or directive. Messages were classified three times using the default temperature of 1.0 and max tokens set
to 512, then the majority classification was used. The preceding AI response was truncated to 400 characters to fit within the model’s context window along with the user message and instructions.
The definition of directive that was given to the model was adapted from searle_1976? who defined it as the following:
“they are attempts (of varying degrees, and hence, more precisely, they are determinates of the determinable which includes attempting) by the speaker to get the hearer to do something. They may be very modest ‘attempts’ as when I invite you to do it or suggest that you do it, or they may be very fierce attempts as when I insist that you do it.”
The definition of collaboration that was given to the model was adapted from [20] who defined it as the following:
“Collaboration is a coordinated, synchronous activity that is the result of a continued attempt to construct and maintain a shared conception of a problem.”
These adaptations can be seen in the system prompt that was used below. The examples given were manually coded by a human from real chat log data, based on the definitions.
Collaboration/Directive Classifier (system prompt):
You are classifying user messages from human-AI task conversations. For each
message you will receive the previous AI response (if available) and the user
message to classify.

Classify each user message as exactly one of:

DIRECTIVE (D)
A message whose primary purpose is to get the model to perform an action, without engaging with or building on its previous response. It is transactional in nature, treating the model as a tool to execute rather than a partner to engage with. There is no attempt to construct shared context or build on what came before.
Examples:
- "No",
- "Try again",
- "Something funnier",
- "Make it make sense",
- "Create a funny acronym for BLMPF"

COLLABORATIVE (C)
A message that works toward a mutual construction of a shared conception of the task, by building on, referencing, or extending the model's previous response, or by providing rich context that frames the interaction as a joint endeavour. It treats the model as a partner rather than a tool, contributing to a shared understanding of what is being created together.
Examples:
- "The blobfish one is my favourite, can you think of others involving blobfish?",
- "I liked the animal theme, keep that but make it funnier",
- "Can you help me create a humorous acronym for BLMPF, I'd love it if it was about an animal doing something unusual"

DISAMBIGUATION
If both elements are present, classify by primary communicative function. Briefly acknowledging before commanding ("That was okay, try again") is Directive. Substantively building on the previous output ("I liked the animal theme, can we keep that?") is Collaborative.

For the first message in a conversation, a bare command or simple request is Directive. A message providing creative context, constraints, or framing is Collaborative.

Return ONLY a JSON array, one object per message, in the same order received:
[{"i":1,"label":"D"},{"i":2,"label":"C"}, ...]
No other text.
Each turn was formatted as:
{i}.
AI: "{preceding AI response, up to 400 characters}"
User: "{user message}"
6.5 LLM Judge for Output Quality↩︎
We used GPT-5 as a judge to score participant outputs against the rubrics for each task. Each output was scored in three independent runs, with scores averaged to produce a final point estimate, using a default temperature of 1.0 for all runs. The system prompt for the judge was varied by task to include the relevant rubric and instructions, but the user message below was consistent across tasks:
“Please evaluate the following [task content] according to the rubric provided in your instructions. Return ONLY a JSON object.”
For the image generation task, the participant’s generated image and the target image were included as base64-encoded PNG data.
Below are the system prompts that were given to the model when evaluating each task.
Image generation (system prompt):
We conducted a study where participants were given a target image and asked to prompt a model to generate an image as close to the target as possible.

These were the instructions that they were given:
"In this task, you will use the chatbot's image generation capabilities to create an image, trying to match a target picture below as closely as possible. The participant with the closest image to the target will be awarded a bonus of $10.
You can prompt the chatbot to generate images using phrases like:
- "Generate a picture of..."
- "Make me an image of..."
As well, you can ask the chatbot to add, remove, or adjust elements of the image and it will generate a new version
The target image is below:
[target image]"

You will be given two images: the participant's image first, then the target image.

Evaluate the participant's image against the target on the following 4 criteria, each scored 1-5:
q1.  Accuracy - The generated image contains the same key objects, subjects, and elements as the target image.
- 1 = Most key elements are missing or wrong
- 5 = All key elements are present and correct

q2.  Similarity - The layout, arrangement, and spatial relationships between elements match the target image.
- 1 = Completely different arrangement
- 5 = Nearly identical layout and positioning

q3.  Style - The overall visual feel of the generated image (color palette, lighting, atmosphere) matches the target image.
- 1 = Completely different feel
- 5 = Very similar visual style and mood

q4.  Overall Resemblance - How similar is this image to the target?
- 1 = Not similar at all
- 5 = Very close match

Return ONLY a JSON object in this exact format:
{"q1": <score>, "q2": <score>, "q3": <score>, "q4": <score>}
Outreach message (system prompt):
We conducted a study where participants were asked to write an outreach message to a hiring manager based on a job description, alongside a chatbot model.

These were the instructions that they were given:
"Below is a job description for a sales representative posted by Dr. Rogers. Working with the chatbot, your task is to write a message to Dr. Rogers explaining why you are the best candidate for the job with the goal of being hired.
The participant who creates the most convincing message (most likely to be hired) will receive a bonus of $10.
Restrictions:
- Must contain some direct elements from the job description
- Must sign name as "J. Doe"
- Must address it to "Dr. Rogers"
- Should not sound AI-generated

Job Description below:
Sales Representative - Dr. Rogers' Premier Office Furniture
We're seeking an energetic Sales Representative to join our established furniture dealership serving businesses across the region. You'll build relationships with office managers, architects, and facility planners to provide complete workspace solutions.
Key Responsibilities:
- Generate new business through cold calling, networking, and referrals
- Conduct site visits and present furniture solutions to potential clients
- Prepare quotes, negotiate contracts, and manage the sales process
- Maintain relationships with existing accounts and identify growth opportunities
Requirements:
- 2-4 years sales experience (B2B preferred, but not required)
- Strong interpersonal and presentation skills
- Valid driver's license and reliable transportation
- High school diploma required; college degree preferred
What We Offer:
Base salary ($40K) plus commission (avg. total $65K-$80K), company car allowance, health benefits, and 401K matching in a stable, family-owned business.
Ready to build your sales career with us?"

Evaluate the message on the following 4 criteria, each scored 1-5:
q1.  Naturalness - This message feels like it was written by a real person rather than an AI.
- 1 = Definitely AI-Sounding
- 5 = Definitely Human-Sounding

q2.  Professionalism - The tone and style are appropriate for professional communication with a recruiter.
- 1 = Very unprofessional (casual, rude, etc.)
- 5 = Very professional (clear, respectful, polished)

q3.  Persuasiveness - How likely would you respond to this person or be interested in this candidate?
- 1 = Not persuasive at all
- 5 = Very persuasive and credible

q4.  Quality - The message is written well and coherently.
- 1 = Written very poorly
- 5 = Written very well

Return ONLY a JSON object in this exact format:
{"q1": <score>, "q2": <score>, "q3": <score>, "q4": <score>}
Acronym building (system prompt):
We conducted a study where participants were given three sets of letters and asked to make a funny acronym for each, alongside a chatbot model.

These were the instructions that they were given:
"In this task, you will be given a series of letters and you will use the chatbot to help build them into a funny acronym. The participant with the funniest acronym will be awarded a bonus of $10.
For example, the following are letters and possible acronyms that can be made with them.
- PUGT = "Prolific Users Get Tired"
- LRP = "Laundry Remains Piled"
- USI = "Usually Sleeping In"
The acronym letters are below:
B L M P F
C R T W
Y O L D"

You will be given three acronyms. Evaluate each one on the following 4 criteria, each scored 1-5:
q1.  Amusement - How funny did you find this acronym?
- 1 = Not funny at all
- 5 = Extremely funny

q2.  Novelty - The acronym shows a clever or novel twist.
- 1 = Very predictable
- 5 = Very clever or unexpected

q3.  Coherence - The expanded phrase makes sense and follows the given letters correctly.
- 1 = Does not make sense / wrong order
- 5 = Makes sense and fits letters perfectly

q4.  Benignness - The acronym is appropriate (not offensive or harmful).
- 1 = Offensive / inappropriate
- 5 = Completely appropriate

Return ONLY a JSON object in this exact format:
{
  "acr1_q1": <score>, "acr1_q2": <score>, "acr1_q3": <score>, "acr1_q4": <score>,
  "acr2_q1": <score>, "acr2_q2": <score>, "acr2_q3": <score>, "acr2_q4": <score>,
  "acr3_q1": <score>, "acr3_q2": <score>, "acr3_q3": <score>, "acr3_q4": <score>
}
6.6 Human Validation of the LLM Judge↩︎
To check the LLM judge against an external standard and to test for systematic family-specific bias, we had three independent human raters per task score a sample of participant submissions using the same rubrics as the LLM judge (Table 8).
6.6.0.1 Raters.
Five members of our lab served as raters. Three were assigned to each task, so some raters covered the assessment of multiple tasks. They spanned undergraduate to faculty level, coming from Computer Science, Applied Mathematics and Statistics, and Business. All were aware of the general aims of the project, but none had seen the LLM judge’s scores or any other study data before rating. All raters joined on a volunteer basis.
6.6.0.2 Blinding.
Raters were blind to (i) the source model identity (model family and tier), (ii) the framing condition assigned to the participant, and (iii) the LLM judge’s scores for the same submissions.
6.6.0.3 Sample.
We rated 54 submissions per task. To set this size, we first ran a pilot in which raters scored 18 submissions, one from each study configuration (nine model-framing combinations per family, across both families). We then calculated the Intraclass Correlation Coefficient (ICC) from that pilot in a power analysis targeting 80% power, indicating that a sample of 54 participants would be sufficient. The final sample was drawn proportionally from the full dataset, preserving the distribution of framing conditions.
6.6.0.4 Procedure.
Rating was administered through Qualtrics. Each rater began with an introductory page describing the task and the rubric, then rated one submission per page on the four rubric dimensions on a 1–5 scale, moving freely between submissions as they went. For the image task, the participant’s submission and the fixed target were shown side by side; for acronym building, the letter set and the participant’s expansion were shown together; for outreach, however, only the participant’s message was shown, since the rubric does not depend on the original job description. Figure 15 shows a sample of the rater’s interface during evaluation of the acronym building task. Approximate rating times varied by task, with the image generation and acronym building tasks generally taking around a minute per submission, and the outreach message task taking between one and two minutes.
6.6.0.5 Inter-rater reliability.
Inter-rater reliability was calculated using ICC. Agreement among the three raters was modest, with ICCs of \(0.283\) for outreach, \(0.315\) for image generation, and \(0.216\) for acronym building (overall mean \(0.271\)). However, these values reflect the subjectivity of some rubrics: image generation has a clear target to compare against, while acronym building asks raters to judge how personally humorous they found the submission, where reasonable people often disagree.
6.6.0.6 Agreement with the LLM judge.
The LLM judge’s scores correlated with the human consensus (the mean of the three raters) at \(\rho{=}0.575\) for image generation, \(\rho{=}0.171\) for outreach, and \(\rho{=}0.156\) for acronym building (overall mean \(\rho{=}0.301\)). This shows that overall, the model’s evaluations were similar in agreement to the human evaluators, as the human evaluators were to each other. Agreement was strongest on the task with a concrete external target and weaker on the more open-ended ones, where the rubric leaves more room for interpretation.
6.6.0.7 Family-specific bias.
To test for systematic bias when the LLM judge scored outputs across model families, we compared LLM-human agreement separately for submissions produced with GPT-family and Claude-family models. Agreement was \(\rho{=}0.179\) (\(p{=}0.372\)) for GPT submissions and \(\rho{=}0.483\) (\(p{=}0.011\)) for Claude submissions. Therefore, the judge’s scores aligned more closely with the human consensus on Claude outputs than on GPT outputs. The performance results in §3.3 should be read with this asymmetry in mind.
6.7 Behavioral Metrics↩︎
Table 11 lists the full set of behavioral metrics extracted from each participant’s conversation logs on each task.
| Metric | Definition |
|---|---|
| Total messages | Total number of messages sent by the participant during the task. |
| Mean message length | Mean character count per participant message. |
| First message length | Character count of the participant’s first message. |
| Total keystrokes | Total number of keydown events recorded while typing a message. |
| Keystrokes per message | Mean number of keystrokes per message sent. |
| Messages per conversation | Mean number of messages sent per conversation thread. |
| Mean conversation depth | Average point in a conversation thread when the participant switched away from it or finished the task. |
| Edit count | Number of times the participant edited a previously sent message. |
| Mean edit distance | Average number of differences between edited and original messages. |
| Total backspaces | Total number of backspace key presses recorded while typing a message. |
| Conversation count | Total number of conversation threads started by the participant. |
| Conversation switches | Number of times the participant switched between conversation threads. |
| Total clicks | Total number of mouse click events recorded during the session. |
| Total mouse movements | Count of sampled mouse movement events, recorded at a 1-in-10 sampling rate. |
| Session duration | Total elapsed time from task page load to task completion. |
| Total idle time | Total time the task page was out of focus (tab hidden). |
| Mean inter-message gap | Mean elapsed time in seconds between consecutive message submissions. |
6.8 Representative Chat Logs↩︎
Figures 16 and 17 illustrate the qualitative difference in interaction style discussed in Section 3.2. The Oversold participant sent short, directive prompts and re-prompted quickly after each output. The Undersold participant sent fewer, longer prompts with more deliberation between them.
6.9 Supplementary Analyses↩︎
This section collects the supplementary analyses referenced in the Results. Table 12 reports the full pairwise grid of \(t\)-tests on pre-interaction perceptions referenced in Section 3.1. Figure 18 shows pre- and post-study score distributions pooled across all conditions referenced in 3.3. Figure 19 shows the relationship between self-efficacy change and overall performance referenced in Section 3.3. Figures 20–22 show performance by tier and framing condition broken down by task. Figures 23 and 24 replicate the acronym engagement metrics from the main paper on the image and outreach message tasks. Figure 25 and 26 show the Godspeed counterparts to the performance and self-efficacy scatter plots referenced in Section 3.4. Figures 27 and 28 show the scatter for the expectations-met predictor referenced in Section 3.4 for UTAUT and Godspeed respectively.
| Outcome | Contrast | |||
|---|---|---|---|---|
| Pre-UTAUT | Over vs. Matched | 1.24 | 0.218 | 0.24 |
| Under vs. Matched | \(-\)0.73 | 0.467 | \(-\)0.14 | |
| Over vs. Under | 2.22* | 0.029 | 0.43 | |
| Pre-Godspeed | Over vs. Matched | 0.63 | 0.532 | 0.12 |
| Under vs. Matched | \(-\)2.77** | 0.007 | \(-\)0.53 | |
| Over vs. Under | 3.41*** | 0.0009 | 0.66 |
References↩︎
https://arena.ai/leaderboard/↩︎
Anthropic: Claude models overview; OpenAI: OpenAI models overview↩︎