Correct but Slow: An Empirical Study of the GPU Kernel Evaluation Gap in Modern Domain-Specific Languages
July 05, 2026
Abstract
Modern GPU domain-specific languages (DSLs), such as Triton and TileLang, are increasingly used to implement specialized deep-learning kernels and as target languages for automated kernel-generation systems. Existing DSL-kernel evaluations establish correctness through reference-based numerical validation—necessary, but silent on replacement quality: a functionally valid kernel may still fall far below the throughput of the optimized library operator it is intended to replace.
We study this correctness–performance gap using 22 Triton and TileLang kernels from five operator categories on NVIDIA A100 and GH200 GPUs, asking whether correctness-based evaluation identifies kernels unsuitable as library replacements, why such failures occur, and how they can be detected without exhaustive benchmark coverage. The study yields three results. First, correctness-based evaluation can admit severe slowdowns: an idiomatic TileLang LayerNorm kernel passes KernelBench’s correctness check while running more than 300× slower than the PyTorch baseline. Second, the causes differ by kernel family. TileLang normalization and reduction slowdowns are mainly repairable authoring defects, such as sequential reductions and unnecessary dtype conversions, whereas convolution and large general matrix multiplication (GEMM) retain residual gaps after optimization due to code-generation and autotuning-coverage limits; vendor-library algorithm selection contributes only marginally. Third, two lightweight checks—library-relative efficiency and roofline utilization—are complementary screening criteria: together they flag every functionally valid but inefficient kernel in our suite and separate repairable authoring defects from structural residuals.
GPU kernels, domain-specific languages, Triton, TileLang, empirical study, performance analysis
1 Introduction↩︎
Deep learning systems depend on GPU kernels that dominate execution time [1], [2]. Frameworks have historically delegated these kernels to vendor libraries such as cuBLAS and cuDNN [3],
[4], but modern architectures increasingly require fused, specialized, model-specific computations outside what those libraries expose [5]. Domain-specific languages (DSLs) such as Triton [6] and TileLang [7] have emerged as the standard answer: they express kernels at the tile level and delegate memory movement, scheduling, and code generation to
a compiler. Triton is already the lowering target for torch.compile [8], and DSLs are increasingly the output of large
language model (LLM)-based kernel generators [9]—so whether DSL kernels can match vendor-library performance is now central to deploying them.
A DSL kernel measured against the vendor library may be faster, comparable, or slower by orders of magnitude, yet the measurement alone does not reveal the cause: poor authoring, a hardware ceiling already reached, or limits in the compiler’s code generation or library maturity [10]. No systematic method separates these cases, and for the fused, model-specific operators that motivate DSLs in the first place, no strong vendor baseline exists to anchor the comparison at all [11]; closing this attribution gap requires tracing performance to its cause, not just observing it.
Existing benchmarks do not close this gap: they admit performance-poor kernels, and their coverage across DSLs, data types, shapes, and GPUs is too narrow to certify kernel quality. KernelBench [9] and TritonBench [12], two prevailing benchmarks, report performance as an outcome but gate only on correctness. A naive but idiomatic TileLang kernel passes KernelBench’s correctness gate while running more than 300\(\times\) slower than PyTorch; KernelBench’s only reward-hacking guard never fires, because it watches for suspiciously fast kernels. Both benchmarks also cover only one DSL, data type, shape, and GPU per task, and building one that spans the full space is not practical.
We address this evaluation gap in three steps. First, we run KernelBench [9] end-to-end and analyze TritonBench’s [12] acceptance criteria, showing that both admit performance-poor kernels: the correctness gate accepts kernels orders of magnitude slower than the baseline,
and coverage is too narrow to certify quality beyond the tested configuration. Second, we study 22 kernels across five operator classes on an NVIDIA GH200 and an A100-SXM4-40GB (hereafter A100), using hardware counters to trace each performance gap to a
specific cause: authoring, code generation, or library immaturity. The dominant TileLang normalization gap turns out to be an authoring artifact, removable by correcting a single reduction idiom (a two-line T.reduce rewrite plus native-dtype
I/O), while the convolution and large general-matrix-multiplication (GEMM) gaps are structural. Third, building on these findings, we propose two lightweight heuristics—a library-comparability screen and a baseline-independent roofline anchor—together with
a small set of recurring optimization patterns; they flag poor kernels and recover most of the gap without a comprehensive benchmark.
We organize the study around three research questions.
RQ1 (Evaluation gap). Do existing DSL and LLM-generated-kernel benchmarks distinguish efficient kernels from performance-poor ones, and how large is the performance gap they admit for kernels that pass?
RQ2 (Root causes). Which authoring, code-generation, and library-maturity factors cause the hidden gap that RQ1 exposes?
RQ3 (Guidance without a comprehensive benchmark). Can lightweight heuristics—a library-comparability screen and a roofline anchor—plus recurring optimization patterns reliably flag poor kernels and guide their repair?
This paper makes the following contributions:
Evaluation gap (RQ1). Prevailing DSL kernel benchmarks gate on correctness alone and admit kernels that run up to \(300\times\) slower than the library baseline.
Hidden gap and causes (RQ2). We trace the performance gap these benchmarks miss to specific authoring, code-generation, and library-maturity causes, each with a distinct hardware-counter signature.
Benchmark-free guidance (RQ3). We give two lightweight evaluation heuristics and a set of recurring optimization patterns that flag poor kernels and guide their repair without a comprehensive benchmark.
Artifacts are available at https://anonymous.4open.science/r/GPUKernelPerformance-6132/ to support reproducibility.
2 Background↩︎
2.1 Tile-Based GPU DSLs↩︎
A GPU executes thousands of threads grouped into thread blocks, each resident on a streaming multiprocessor (SM) with fast programmer-managed shared memory; high-performance kernels tile data [13] to reuse that scratchpad and stay compute-bound under the roofline model [10]. Two Python-embedded DSLs raise this tiling abstraction above hand-written CUDA, and our study targets both. Triton [14] makes the tile—a statically shaped, multi-dimensional array operated on by all threads in a program instance—the unit of computation. The Triton compiler, built on MLIR [15], performs memory coalescing, shared-memory allocation, thread swizzling, and software pipelining automatically while targeting PTX (NVIDIA’s
virtual assembly), and programmers tune tile configurations through @triton.autotune. Triton has been the default lowering target for torch.compile since PyTorch 2.0 [8]. Triton’s convolution support is less mature: an im2col-style lowering (reshaping convolution windows into matrix columns so convolution runs as GEMM) exists but falls substantially short
of cuDNN on common workloads [16]. TileLang [7] separates the algorithm (what to compute) from the schedule (how to map computation onto GPU resources) more explicitly than Triton, letting the programmer tune memory staging, thread layout, and
pipeline depth without changing the functional description. It compiles through Apache TVM with hardware-intrinsic support on NVIDIA and AMD; its convolution performance relative to cuDNN has not been systematically evaluated prior to this work.
Throughout, we compare both DSLs against the vendor libraries they aim to displace: cuBLAS [3] for dense GEMM and cuDNN [4] for convolution and other deep-learning primitives, each dispatching its fastest implementation per shape via a runtime selector [17].
2.2 Benchmarking DSL and LLM-Generated Kernels↩︎
Custom GPU kernels are increasingly produced not by hand but by automated tools: torch.compile lowers operators to Triton [8], and a growing body of research uses large language models (LLMs) to generate kernels directly [9], [18]. This has made kernel benchmarks the de facto arbiters of kernel quality, and two benchmarks dominate the DSL and LLM-generated setting. TritonBench [12] curates production-grade Triton kernels and reports correctness plus a roofline-anchored GPU-efficiency metric; KernelBench [9] accepts a kernel that reproduces a PyTorch reference on randomized inputs. What each benchmark measures, what it gates on, and what its gate admits are the subject of
4.
3 Methodology↩︎
Studying what correctness-gated evaluation misses requires three ingredients: kernels that pass the gate, strong library baselines to measure them against, and instrumentation that attributes any gap to a cause. We therefore construct a kernel suite covering the main computation patterns in modern models, compare DSL implementations against library-backed PyTorch baselines under matched configurations, and profile both end-to-end latency and low-level hardware behavior.
3.1 Kernel Suite↩︎
Our benchmark suite covers five operator categories that capture the dominant computation patterns in modern deep learning: matrix multiplication, attention, convolution, normalization, and element-wise or reduction operators. In total, the suite contains 22 kernels: three GEMM workloads (dense matmul, batched matmul, fused linear+activation), one attention workload (scaled dot-product / FlashAttention variants), one convolution workload (Conv2d, \(1\times1\)–\(7\times7\) filters including depthwise and strided), two normalization workloads (LayerNorm and RMSNorm), and fifteen element-wise or reduction workloads. Triton kernels are drawn from TritonBench [12] (curated from its GitHub channel of 184 kernels across 95 repositories) and, for LayerNorm, the TorchInductor reference; all TileLang suite kernels are our re-implementations of the same operators, following the interfaces of the TritonBench versions and the idioms of the TileLang example repository [7]. Per-kernel provenance and full selection criteria are in 13.1; the authorship threat this creates is discussed in 7.3.
3.2 Baseline Construction↩︎
For each workload, we compare DSL implementations against the strongest available vendor-library path through PyTorch; per-category baseline specifications are in 13.2. For attention, we use PyTorch scaled dot-product attention with the FlashAttention backend; because the Triton and TileLang implementations are not algorithmically identical to this baseline, we report attention results separately.
3.3 Profiling Setup↩︎
We measure both end-to-end latency (which drives all library comparisons) and hardware performance counters (which support root-cause analysis, RQ2).
3.3.0.1 End-to-end throughput
We measure host-synchronized GPU execution time. Locked-clock runs pin graphics and memory clocks to fixed frequencies with run-to-run relative standard deviation \(\leq 0.9\%\); each reported table states whether its measurements are clock-locked (protocol and clock settings in 13.3).
3.3.0.2 Hardware performance counters
For root-cause analysis, we collect Nsight Compute [19] (NCU) profiles grounded in seven counters (definitions in 13.3), each from a single execution with stability verified within 2% across five runs.
3.3.0.3 Correctness
Before any timing, we validate every DSL kernel against its library baseline at per-dtype tolerances (fp32 \(10^{-5}\), fp16 \(10^{-3}\), bf16 \(10^{-2}\), relaxed \(2\times\) for reductions) and an edge-case suite (NaN/Inf/denormal/all-equal) across all 22 kernels with 0 crashes. FP32 TileLang GEMM is excluded from timing:
T.gemm silently lowers float32 to TF32 on SM80, failing an exact \(10^{-5}\) check on 31.8% of outputs while a manual FMA kernel passes (a precision-lowering artifact, reproducible via
exp_fp32_gemm.py in the artifact), so all TileLang GEMM is measured in FP16.
3.4 RQ3 Optimization Methodology↩︎
To produce the optimized kernels evaluated in 6, we apply an LLM-based agentic kernel-optimization harness (included in the artifact) [20] under a fixed protocol (correctness-gated iterations, large-input shapes, no language switching) to instantiate the root-cause-derived optimization patterns of 5. Optimized kernels are validated provenance-agnostically against the same per-dtype tolerances and Nsight Compute counters, and recovered performance is reported as a lower bound on user-space-recoverable gain.
3.5 Metrics↩︎
Our primary metric is library efficiency, \[E_{\mathrm{lib}} = \frac{t_{\mathrm{lib}}}{t_{\mathrm{DSL}}} \times 100\%,\] where \(t_{\mathrm{lib}}\) is the latency of the cuBLAS or cuDNN baseline and \(t_{\mathrm{DSL}}\) that of the corresponding DSL implementation under the same hardware and input configuration; 100% indicates parity, lower values a slower DSL kernel. Secondary metrics (throughput, hardware efficiency, memory bandwidth utilization) are used qualitatively in root-cause analysis (RQ2) and are not tabulated separately.
3.6 Evaluation-Gap and Heuristic Measurement↩︎
To test whether existing benchmarks admit slow kernels (RQ1), we run each naive DSL kernel through KernelBench’s evaluator, which overrides the candidate’s input generators with the reference’s and checks output equivalence on randomized inputs; we record the pass/fail verdict and measured slowdown against the PyTorch baseline (harness details in 13.3). To anchor the RQ3 heuristic in a baseline-independent signal, we model the bytes moved for memory-bound kernels or the floating-point operations (FLOPs) for compute-bound kernels, then divide the achieved work rate by the relevant hardware peak (HBM bandwidth or FP16 Tensor-Core throughput) to obtain its roofline fraction.
3.7 Experimental Setup↩︎
3.7.0.1 Hardware
We measure on two primary architectures: the A100-SXM4-40GB (Ampere, sm_80), used for suite magnitude (4) and root-cause counters (5), and the GH200 (Grace Hopper,
sm_90), used for the evaluation-gap demonstration (4.2) and roofline heuristic (¿tbl:tab:roofline?). Full specifications and clock-lock settings are in 13.4.
3.7.0.2 Software
We use PyTorch 2.8.0+cu128, Triton 3.4.0, TileLang 0.1.6.post1, bundled cuDNN, and Nsight Compute 2026.2.0; the complete version list is in 13.4.
4 The Evaluation Gap (RQ1)↩︎
This section answers RQ1: do existing benchmarks distinguish efficient DSL kernels from performance-poor ones, and along which dimensions do they fall short? We survey what the prevailing benchmarks measure (4.1), show that a correct-but-slow kernel passes their gate unflagged (4.2), and quantify the hidden gap across the 22-kernel suite (4.3 onward).
4.1 What Existing Benchmarks Measure↩︎
The two benchmarks that dominate DSL and LLM-generated GPU-kernel evaluation are KernelBench [9] and TritonBench [12], and both treat performance as a reported outcome rather than an acceptance criterion. KernelBench, the standard LLM kernel-generation
target, accepts a candidate on correctness alone: measured speedup is recorded—and aggregated in the performance-aware fast_p leaderboard metric—but a slow kernel is never rejected, so our critique targets the gate, not the
metric: every passing kernel enters the accepted pool that downstream users and kernel-generation loops treat as usable. TritonBench reports a roofline-anchored efficiency metric—a precedent 6 builds on—but covers only
Triton, one data type and shape per operator, and a single GPU architecture. Neither benchmark spans the full (DSL \(\times\) data type \(\times\) shape \(\times\) architecture) space, and extending one would be costly: re-tuning a single kernel at one deployment shape took 211 s versus under a second at a small shape, a cost that multiplies across every cell. A passing kernel
certifies correctness, not performance quality.
4.2 Passing Is Not Fast↩︎
We pass idiomatic DSL kernels through the KernelBench correctness gate and time them. On the GH200, TileLang LayerNorm passes the correctness gate on all five shapes but runs \(323\times\) slower than PyTorch at the
large shape under locked clocks (\(51.5\) ms vs.\(0.16\) ms); TileLang RMSNorm passes and is \(117\times\) slower. A deliberately constructed worst-case
LayerNorm variant reaches \(1293\times\) (\(176.4\) ms, unlocked); even a naive argmax passes and is \(16.7\times\) slower.1 In every case the gate returns correct=True and the more-than-\(10\times\) reward-hacking guard never triggers, because the kernels are slow,
not fast. These are not adversarial constructions: they differ from a competent implementation in a single reduction primitive ([sec:analysis:jit]); 2 shows the two-line fix. The A100 suite exhibits the same pattern; per-architecture magnitudes are reported throughout.
4.3 The Hidden Gap These Benchmarks Admit↩︎
Every kernel in the 22-kernel suite passes the same correctness gate (3.3), so each sub-parity efficiency below is invisible to a correctness-only evaluator; root-cause labels (RC0–RC4, defined in 5) annotate each finding so RQ1 magnitudes can be read against RQ2 causes.
1 summarizes library efficiency (%) for all kernels in the suite, broken down by DSL and kernel category (tuned suite profile, as ¿tbl:tab:summary?). The key finding is that the performance gap is not uniform: Triton is broadly competitive for element-wise and normalization kernels (LayerNorm 90.2%, element-wise \(\sim\)69–96%; the 873.0% RMSNorm outlier is a fusion artifact) but trails on convolution (28.9%) and, more mildly, on large square GEMM (59.7%); TileLang is competitive across GEMM, convolution, and element-wise shapes but collapses on normalization and the softmax and index-returning reductions (LayerNorm 0.33%, softmax 0.9%, argmax 5.9%). RQ3 (6) shows that reduction and normalization gaps are authoring artifacts, whereas the convolution and large-GEMM gaps persist as genuine residuals.
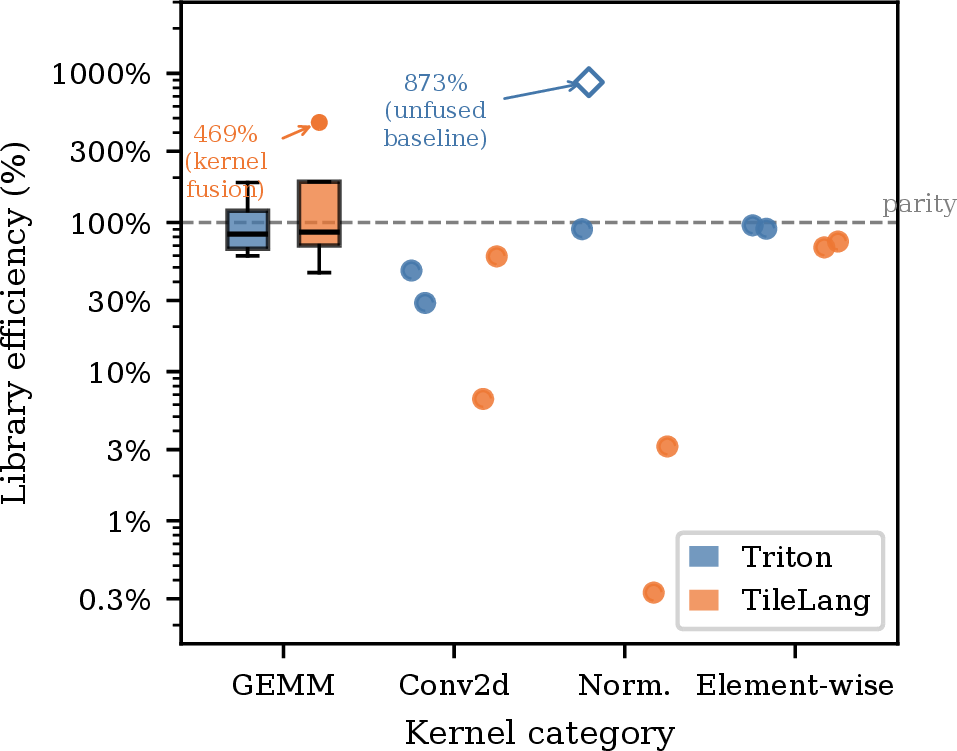
Figure 1: Library efficiency (%) of Triton and TileLang kernels vs.cuBLAS/cuDNN on the A100, by category (log scale; dashed line = parity; tuned suite profile as ¿tbl:tab:summary?). GEMM shows IQR boxes; other categories
per-kernel dots. \(\diamond\) 873.0% (Triton, Norm.) is rms_norm, an unfair-baseline artifact; 468.5% (TileLang, GEMM) is fused_linear_activation, a genuine fusion advantage ([sec:eval:gemm]). Attention excluded: the Triton (tiled FlashAttention-2 [11]) and TileLang (untiled \(O(n^2)\)) kernels are algorithmically different..
Finding: On the A100, Triton holds 59.7–97.9% of cuBLAS on GEMM and TileLang 78.1–94.2%; both DSLs are weakest at \(16384^2\) and near parity on the batched shape (¿tbl:tab:summary?, 1).
The extremes differ by shape rather than by DSL (¿tbl:tab:summary?): both DSLs are weakest on the \(16384^2\) square matmul (Triton 59.7%, TileLang 78.1%) and strongest on the \(128\times2048^2\) batched shape (97.9%/94.2%), while a fused linear-plus-activation kernel pushes TileLang to \(468.5\%\). 5 attributes Triton’s \(16384^2\) gap to missing autotune configurations (RC2a) compounded by absent cache blocking for the \({\approx}1.6\) GB working set, which leaves the kernel DRAM-bound where cuBLAS stays cache-resident (RC2b). The fusion win reflects kernel design, not a compiler artifact—the single launch avoids PyTorch’s intermediate allocation—and says nothing about shapes with no second operation to fuse. The pattern holds on the GH200 (Triton 56–170%, TileLang 60–163%; ¿tbl:tab:summary?): batched and fused shapes reach or exceed parity while \(16384^2\) stays the weakest shape on both architectures (Triton \({\sim}60\%\)/\(56\%\)), so the large-square-GEMM residual is a general tuning and cache-blocking gap (RC2a, RC2b), not A100-specific.
Finding: Both DSLs trail cuDNN on convolution, but unevenly: Triton 13.3–47.4% and TileLang 43.6–59.3% across \(1\times1\)–\(7\times7\) filters at the large shape. Both collapse to \(\le\)5.5% on depthwise convolution, which lowers to 512 per-group GEMM launches—per-launch JIT overhead plus absent strided-access vectorization (RC1).
¿tbl:tab:summary? reports the convolution efficiencies, with Triton falling monotonically from 47.4% (\(1\times1\)) to 13.3% (\(7\times7\)) as the gap widens on the
Winograd-ineligible larger filters (5). Nsight Compute shows the conv gap is occupancy- and coalescing-bound (RC1 + RC2), not a register-spill problem: n_spills = 0 at every filter size for both DSLs. On the
GH200, Triton convolution stays comparably weak (12.1% at \(3\times3\), \(\le\)9.8% at the larger filters), while TileLang convolution is competitive on both architectures (A100 43.6–59.3%,
GH200 32.9–71.7%; ¿tbl:tab:summary?). The persistent residual is therefore the Triton convolution gap, which holds on both architectures.
Finding: Triton normalization kernels match or substantially outperform PyTorch’s eager paths; TileLang normalization collapses to 0.3–3.2% of PyTorch throughput at the tested size (\(8192 \times 8192\)), with LayerNorm 299\(\times\) slower.
¿tbl:tab:summary? reports normalization category medians. On the A100, Triton layer_norm reaches 90.2% of PyTorch throughput at \(8192^2\); TileLang LayerNorm runs \(299\times\) slower (\(97.0\) ms vs.\(0.324\) ms in the tuned suite profile; the untuned kernel that 6 repairs is slower
still at 364 ms under locked clocks). The TileLang collapse persists on the GH200 (\(329\times\) in the suite profile), confirmed within noise by clock-locked re-timing (4.2). [sec:analysis:jit] attributes this collapse to serialized memory-latency stalls under T.serial reduction loops.
Finding: Hardware-agnostic heuristic tuning of the block-tile grid yields \(\Delta\approx0\)pp for both DSLs on every kernel—default and tuned latencies are near-identical, and the convolution gap is unchanged (28.9%).
Re-evaluating all 22 kernels with heuristically tuned configurations for both DSLs changed nothing (\(\Delta = 0\)pp on every row, convolution included): the gaps are insensitive to block-tile shape. For convolution the limitation is structural code generation, which no tile shape repairs (RC1, RC3); for large GEMM the effective lever lies outside this grid entirely, in the scheduling dimensions that the expanded search below sweeps (RC2a).
The tension with the matmul speedup of 6.4 is a search-space distinction, not a shape distinction: the 12-config grid varies only the block-\(M\)/\(N\)/\(K\) tile dimensions, while the expanded search additionally sweeps GROUP_SIZE_M (the “L2-swizzle” of RC2a), num_warps, and num_stages. That search
recovers Triton from 59.7% to 81.9% at \(16384^2\) and from 71.5% to 77.3% at \(4096^2\); the optimal configuration is simply absent from the default grid (RC2a).
The most striking asymmetry is TileLang’s normalization collapse: \(299\times\) on large LayerNorm (compounding RC0 deficiencies, [sec:analysis:jit]), persisting across architectures (\(329\times\) on the GH200). The A100 and GH200 give a consistent picture (¿tbl:tab:summary?): TileLang’s overall
median is \(\sim\)68% on the A100 and \(\sim\)67% on the GH200, and the two gaps that survive on both architectures are the TileLang normalization collapse and the Triton
convolution residual (28.9% at \(3\times3\) on the A100, \(\le\)13% on the GH200), not a fixed per-DSL ranking. Competitiveness still cannot be read off one GPU at the per-kernel
level: 6 shows an optimized logsumexp kernel that is fast on the A100 but register-spills on the GH200.
Within the element-wise and reduction category, most kernels cluster near the per-DSL medians in ¿tbl:tab:summary?; the notable Triton outlier is the index-returning reduction argmax (25.5%), while fusion or baseline-path
cases (leaky_relu, cross_entropy, matrix_transpose, linear+act) exceed 100% and are not vendor-library speedups. Per-kernel efficiencies for all 22 benchmarked kernels appear in 5.
5 Root Causes of the Hidden Gap (RQ2)↩︎
This section answers RQ2: for the kernels that pass existing correctness benchmarks (4.1) yet lag the vendor library by the margins in 4, what causes the hidden gap? We separate the causes by where the fix belongs: user-space authoring (RC0a), compiler code generation (RC0b, RC1, RC2a, RC3), and library maturity—the tuning and algorithm selection a mature vendor library provides (RC2b, RC4).
5.0.0.1 RC0: TileLang Normalization and Reduction Deficiencies
RC0 has two mechanisms, separated by where the fix lives: RC0a is a user-space authoring choice; RC0b is a compiler-codegen deficiency.
5.0.0.2 RC0a: TileLang Reduction Authoring (T.serial \(\to\)
T.reduce)
The original TileLang normalization kernels reduce over the normalized dimension with T.serial loops, serializing the accumulation with no inter-thread parallelism; the parallel alternative is T.reduce (2).
None
Figure 2: RC0a fix: T.serial\(\to\)T.reduce in TileLang LayerNorm (mean pass; variance identical). With native-dtype I/O this recovers \(1347\times\)
on the A100 (locked clocks; 6.2)..
The cost is exposed memory latency, not barriers: warp_stall_long_scoreboard drops from 59.56 cycles to \({\approx}0\) under the fix while warp_stall_barrier is already \({\approx}0\) in both kernels; the GH200 shows the same signature (barrier \({=}0\), long-scoreboard \({=}49.95\), plus a \(45.1\)/\(34.4\) GB local-load/store spill, RC3). The T.reduce rewrite removes this latency source; with the native-dtype I/O fix, LayerNorm drops from 364 ms to 0.270 ms (\(1347\times\), 6.2).
5.0.0.3 RC0b: Absent Vectorized Loads (Compiler Codegen)
TileLang’s compiled normalization kernels also fetch 16-bit bfloat16 elements individually instead of issuing 128-bit LDG.128 loads, flooding the memory controller with discrete transactions; NCU confirms the scalar granularity for
LayerNorm (50% bytes/sector at one sector per request, DRAM throughput 59.2%). Unlike RC0a, this deficiency requires a compiler-codegen fix.
5.0.0.4 RC1: Absent Vectorization of Strided Memory Accesses
Ampere reaches peak bandwidth only via 128-bit vector loads (LDG.128); Hopper’s Tensor Memory Accelerator similarly requires aligned, contiguous descriptors. For GEMM, Triton emits vectorized loads because the layout is row-major and tiles
are 16-byte aligned.
Convolution breaks this in two ways: each output gathers a \((K_H\times K_W)\) window strided across the innermost NCHW dimension (PyTorch’s default), breaking LDG.128 alignment; and for \(K_H\times K_W>1\) Triton’s alias analysis cannot prove successive spatial-loop iterations are aligned, so it conservatively emits scalar 32-bit loads. The consequence is a cascade noted in the community [16]: un-vectorized loads prevent cp.async from firing, so the software pipeline cannot overlap data movement with computation and
the kernel stalls on global-memory latency at every tile boundary.
NCU confirms the absent vectorization on the A100: Triton conv2d achieves a load efficiency of only 12.55% bytes/sector at 16.4 sectors per request, versus the cp.async-staged matmul path.2
5.0.0.5 RC2a: Configurations Absent From the Default Grid
Triton’s auto-tuner sweeps a programmer-specified configuration list {(BLOCK_M, BLOCK_N, BLOCK_K, num_stages, num_warps)}; the reference GEMM tutorial’s list achieves near-cuBLAS
performance on common shapes [14] but omits the L2-swizzle and large-shape configurations needed at scale.
The \(16384^2\) matmul is the clearest case ([sec:eval:gemm]): 59.7% of cuBLAS at a shape absent from standard tutorial lists versus 97.9% on a well-populated batched GEMM, and the expanded scheduling-parameter search of [sec:eval:tuning] recovers it to 81.9%—the missing configurations, not an exhausted budget, bound default performance.
5.0.0.6 RC2b: L2 Cache Residency
For the \(16384^2\) matmul, the combined A, B, C footprint (\({\approx}1.6\) GB) vastly exceeds the A100’s 40 MB L2 cache; cuBLAS employs hardware-specific cache-blocking (via
cuBLASLt’s plan selector) while Triton’s generic tl.dot compilation lacks equivalent heuristics, producing the \({\approx}1.7\times\) latency penalty observed (\(33.5\) ms vs.\(56.1\) ms). NCU confirms the residency divide: Triton reaches only a 49.4% L2 hit rate (DRAM-bound, 85.9% throughput) whereas cuBLAS holds 80.5% at 28.8%.
Convolution adds filter-size degrees of freedom that default lists do not cover for \(5\times5\)/\(7\times7\), and TileLang’s ahead-of-time num_stages cannot adapt to the
register pressure large filters create.
5.0.0.7 RC3: Register Spill Collapses Occupancy (TileLang LayerNorm, Not Convolution)
Each SM on the A100 exposes a 65,536-register file: a 128-thread block at 64 registers per thread fills it, preventing a second resident block and eliminating pipeline interleaving. A natural hypothesis is that large-filter convolution hits this wall;
NCU refutes it: Triton conv2d reports n_spills = 0 at every tested filter (\(1\times1\) through \(7\times7\)), even though register usage rises with \(K^2\) (up to 224 regs/thread at large shapes). The spill is instead TileLang-LayerNorm-specific: the large LayerNorm kernel uses 254 registers per thread, drops to 12.4% achieved occupancy, and spills 51.5 GB of local-load plus
34.4 GB of local-store traffic (A100; the GH200 mirrors it at 45.1/34.4 GB). This register pressure—not any convolution effect—is what collapses occupancy below the level required for latency hiding.
5.0.0.8 RC4: Absence of Algorithm-Level Diversity
cuDNN selects Winograd for \(3\times3\) filters when arithmetic reduction dominates (Winograd \(F(2,3)\) cuts multiply-accumulates \({\approx}2.25\times\)), but neither Triton nor TileLang exposes the transformation as a schedulable primitive. Isolating this effect on the A100 bounds its size: a deterministic A/B comparison of cuDNN on \(3\times3\) stride-1 convolution differs by only 0.03% (a ratio of 0.9997), so absent Winograd selection accounts for at most \({\approx}2\)–\(3\%\) of the gap. Moreover, the gap does not track Winograd eligibility: the eligible \(3\times3\) stride-1 filter (28.5%) is no better than the ineligible stride-2 case (32.1%), and the deepest gaps fall on \(5\times5\) (17.8%) and \(7\times7\) (13.1%), so the residual is general cuDNN implicit-GEMM tuning, not algorithm selection.
| Root cause | Affected kernels | Contribution | Diagnostic counter |
|---|---|---|---|
| RC0a: T.serial instead of T.reduce | All TileLang reductions, norm | \(1347\times\) (LayerNorm, A100) | warp_stall_long_scoreboard (barrier \({\approx}0\)) |
| RC0b: Absent vectorized loads / dtype cast | TileLang norm | — | l1tex bytes/sector |
| RC1: Strided access, scalar LD | Conv2d (\(K > 1\)), Triton | \(2.2\times\) with RC2 | Load bytes/sector eff.(12.55%) |
| RC2a: Auto-tuning mismatch | Matmul, Conv2d, Depthwise | \(1.37\times\) (Matmul) | TFLOPS vs.swept configs |
| RC2b: L2 cache residency | Matmul \(\geq 16384^2\) | — | L2 hit rate, DRAM throughput |
| RC3: TileLang LayerNorm spill | TileLang LayerNorm (large) | — | local_op spill / occupancy (A100: 51.5 GB ld, 254 regs, 12.4% occ) |
| RC4: No Winograd | Conv2d \(3\times3\) | \({\approx}2\)–\(3\%\) | SM utilization delta |
Answer to RQ2: The hidden gap has no single cause but a small, fix-locus-separated taxonomy of them. The most dramatic gaps—normalization and reduction collapses of up to \(1347\times\)—are user-space authoring artifacts (RC0a). A second tier is compiler code generation: absent vectorization (RC0b, RC1), default-grid tuning coverage (RC2a), and register spill (RC3). The remainder is library maturity (RC2b, RC4), which bounds what any current DSL kernel reaches. Each cause has a distinct counter signature (1), making the taxonomy a diagnostic checklist.
6 Guidance Without a Comprehensive Benchmark (RQ3)↩︎
This section answers RQ3: absent a comprehensive benchmark, can lightweight evaluation heuristics and a small set of recurring optimization patterns reliably flag performance-poor DSL kernels and guide their repair? RQ1 showed that correctness gates admit slow kernels and that a comprehensive benchmark is infeasible; RQ2 explained why the gaps arise. We distill that evidence into a two-part evaluation heuristic for deciding whether a kernel is efficient (6.1) and the optimization patterns that repair the gaps it flags (6.2 onward). The optimization campaigns (3.4) ran on a separate development GPU; their kernels are re-timed here on the A100 and GH200. The central result is a clean dichotomy: most dramatic gaps are authoring artifacts that one dominant pattern fully repairs, a minority are genuine residuals that survive best-effort optimization, and the heuristic tells the two apart without a ground-truth benchmark.
6.1 Evaluation Heuristics: Is This Kernel Efficient?↩︎
We propose two complementary checks a developer can apply without a curated benchmark.
6.1.0.1 A comparability screen (pragmatic, baseline-relative)
An efficient DSL kernel should (i) come within a small factor of the vendor/PyTorch baseline on representative shapes, (ii) be at least at parity—ideally faster—at large input sizes where launch and framework overheads amortize, and (iii) show no catastrophic per-shape collapse. This screen is cheap and catches gross failures: the idiomatic TileLang LayerNorm that runs more than \(300\times\) slower (4.2) fails it immediately. Its limitation is circularity: PyTorch is both the baseline and the de-facto definition of “good,” so the screen cannot certify a kernel that merely matches an already-slow baseline, and it can credit a kernel that beats an unfused eager path for the wrong reason (the RMSNorm \(873\%\) “win” in ¿tbl:tab:summary?, a fusion artifact); it is a screen, not a certificate.
6.1.0.2 A roofline anchor (baseline-independent)
To break that circularity we anchor quality to the hardware rather than to PyTorch: for a kernel whose essential work is \(W\) (bytes moved if memory-bound, FLOPs if compute-bound) and whose optimized time is \(t\), the achieved roofline fraction is \(\rho = W / (t \cdot P)\), where \(P\) is the relevant hardware peak [10]. TritonBench reports an analogous achieved-peak metric [12]; we use it as a decision signal, not a leaderboard score: a kernel near the roof is efficient regardless of what the library does. ¿tbl:tab:roofline? reports \(\rho\) for the optimized kernels on the A100 (clock-locked) and the GH200 (unlocked), alongside their PyTorch-relative efficiency \(E_\text{lib}\) and the cliff—the naive-to-optimized speedup that measures how much authoring headroom each kernel hid. The anchor does two things the comparability screen cannot. First, it confirms the genuine residuals are genuinely far from the hardware: optimized Triton Conv2d reaches only \(\rho=0.16\) and index-returning argmax only \(\rho=0.10\) on the GH200, so their shortfall is real headroom, not merely a fast baseline. Second, it de-inflates baseline-relative outliers: the RMSNorm “\(13\times\) win” over PyTorch sits at \(\rho=0.69\)—efficient, but hardly beyond what the hardware allows. On the GH200, the recovered normalization and reduction family lands at \(\rho=0.41\)–\(0.87\), while the residual convolution and argmax kernels sit at \(\rho\le0.28\) even after best-effort optimization; the A100 mirrors the split (\(\rho=0.42\)–\(0.89\) recovered, \(\le0.34\) residual), so the classification is architecture-independent. The cliff column shows the two signals measure different axes: LayerNorm hid a \(1541\times\) authoring cliff on the GH200 (\(380\times\) on the A100) that the dominant pattern fully recovers, whereas Conv2d’s \(8.2\times\) cliff still leaves it at \(\rho=0.28\), a structural ceiling. We present the two checks together because neither suffices alone, and they disagree exactly in a judgment band near \(\rho\approx0.5\): Softmax and Matmul both achieve \(\rho=0.47\) on the GH200, yet Softmax is at parity (\(E_\text{lib}=0.87\)) while Matmul trails cuBLAS (\(E_\text{lib}=0.68\))—only the two checks together make the call.
4pt
@llrrrrrr@llrrrrrr@ & & & & & & &
(lr)3-5(lr)6-8(lr)11-13(lr)14-16 Kernel (DSL) & Bound & \(\rho\) & \(E_\text{lib}\) & Cliff & \(\rho\) & \(E_\text{lib}\) & Cliff & Kernel (DSL) & Bound & \(\rho\) & \(E_\text{lib}\) & Cliff &
\(\rho\) & \(E_\text{lib}\) & Cliff
&
LayerNorm (TL) & mem & 0.67 & 1.25 & \(380\times\) & 0.59 & 1.20 & \(1541\times\) & Matmul (Tr) & comp & 0.56 & 0.78 & \(1.1\times\) & 0.47 & 0.68 & \(1.3\times\)
RMSNorm (TL) & mem & 0.70 & 10.2 & \(325\times\) & 0.69 & 13.0 & \(1520\times\) & Conv2d (TL) & comp & 0.34 & 0.60 & \(6.4\times\) & 0.28 & 0.63 & \(8.2\times\)
MeanReduction (TL) & mem & 0.89 & 1.04 & \(13.7\times\) & 0.87 & 0.97 & \(13.9\times\) & Conv2d (Tr) & comp & 0.24 & 0.42 & \(1.5\times\) & 0.16 & 0.34 & \(2.5\times\)
BatchedMatmul (TL) & mem & 0.82 & 0.94 & \(23.9\times\) & 0.86 & 1.11 & \(20.2\times\) & Argmax (TL) & mem & 0.15 & 0.27 & \(4.5\times\) & 0.10 & 0.22 & \(3.8\times\)
MaxReduction (Tr) & mem & 0.69 & 1.13 & \(8.8\times\) & 0.59 & 1.20 & \(6.4\times\) & & & & & & & &
MaxReduction (TL) & mem & 0.42 & 0.68 & \(12.8\times\) & 0.41 & 0.84 & \(16.2\times\) & & & & & & & &
LogSoftmax (TL) & mem & 0.55\(^\S\) & 0.71\(^\S\) & —\(^\S\) & 0.58 & 0.90 & \(5.2\times\) &
& & & & & & &
Softmax (TL) & mem & 0.55\(^\S\) & 0.86\(^\S\) & —\(^\S\) & 0.47 & 0.87 & \(4.0\times^\ddagger\)
& & & & & & & &
TL = TileLang, Tr = Triton. \(^\ddagger\) The naive Softmax falls back to torch.softmax at this shape, so its cliff is not a pure authoring comparison; the optimized \(\rho\) and \(E_\text{lib}\) are unaffected. \(^\S\) A100 Softmax/LogSoftmax report the streaming variant ([sec:sec:mitig:summary]); the in-tree full-row-cache variant collapses occupancy (\(\rho{=}0.006\)/\(0.028\)), so its cliff does not transfer and is omitted. logsumexp (omitted) register-spills on sm_90 but not sm_80 (A100: \(0\) spill, \(93\) regs, \(E_\text{lib}{=}582\%\))—an sm_90-specific RC3 residual; see [sec:mitig:other] [tbl:tab:mitigation].
6.2 Normalization Kernels: Correcting RC0↩︎
Finding: Two user-space fixes—T.serial\(\to\)T.reduce (dominant, RC0a) and native bf16/fp16 I/O without intermediate .float() casts—bring TileLang LayerNorm to \(124\%\) and RMSNorm to \(990\%\) of PyTorch on the A100 (\(1347\times\)/\(1157\times\) over the unoptimized baseline),
confirming RC0 as the primary, user-correctable cause of the normalization deficit.
The dominant fix replaces the T.serial loop with a single T.reduce (subsequent iterations confirmed the loop structure, not thread configuration, was the bottleneck); native bfloat16 I/O, removing intermediate
.float() casts, then brings LayerNorm from 364 ms to 0.270 ms and RMSNorm to 0.254 ms (the latter exceeds 100% because the fixed kernel fuses the scaling pass PyTorch’s eager two-pass path does not)—near the \(\approx\)0.18 ms bandwidth floor for an \(8192^2\) bfloat16 tensor. This is not a new technique; the contribution is showing RC0 fully explains the anomaly and is user-correctable without
algorithmic change (the RC0b codegen deficiency is sidestepped, not fixed). The 18-iteration LayerNorm search trajectory is in 13.5.
6.3 Convolution: Partial Recovery via Implicit GEMM↩︎
Finding: Restructuring Conv2d as an FP16 Tensor-Core implicit GEMM with aligned padding (RC1) and an expanded autotune space (RC2) reaches 36–77% of cuDNN across \(1\times1\)–\(7\times7\) on the A100—narrowing but not closing the gap.
The restructuring unfolds the convolution into an on-the-fly implicit GEMM [21] that FP16 Tensor Cores accelerate, with 16-byte input
padding enabling LDG.128 loads (RC1) and an expanded autotune space (smaller BLOCK_K, more pipeline stages) covering configurations absent from the default list (RC2). Of the residual \(\approx\)20% gap, absent Winograd selection contributes only \(\approx\)2–3% (a 0.03% deterministic-vs-non-deterministic delta for \(3\times3\) stride-1); the
remainder reflects general cuDNN implicit-GEMM tuning—kernel selection, split-K, shared-memory tile sizing—that the single-lowering DSL kernel does not match (RC4). Per-filter optimized efficiencies range from 77.4% at \(1\times1\) to 36.1% at \(7\times7\) (all correct); closing this tuning gap and adding in-DSL Winograd support are future work. The depthwise variant (\(\le\)5.5%
in 4) is outside this rewrite’s scope: its grouped lowering degenerates into 512 per-group GEMM launches whose cost is launch- and code-generation-bound (RC1), and none of our patterns repair it. We flag it as the
clearest open convolution gap.
6.4 GEMM and Reduction Kernels↩︎
Beyond the normalization kernels, we optimized the GEMM kernel and the full TileLang reduction/softmax family to test how broadly—and how completely—the RQ1 gaps recover.
Square matmul (Triton, FP16). Adding @triton.autotune with an expanded set of tile configurations and a GROUP_SIZE_M L2 cache swizzle (which reorders output tiles to improve L2 data reuse across the \(M\)-dimension) reduces latency from 1.08 ms to 0.79 ms (\(1.37\times\), \(E_\text{lib} = 77\%\)) on a \(4096\times4096\) matmul,
re-timed on the A100; the same expanded search recovers \(E_\text{lib}\) from \(59.7\%\) to \(81.9\%\) (\(1.37\times\)) at
the RQ1 \(16384^2\) shape. Further iterations (persistent kernel, max_num_imprecise_acc) converged without gain, so the expanded configuration set and L2 swizzle are the effective ceiling—confirming RC2: the
gain is a property of the expanded search space ([sec:eval:tuning]), not of a different problem shape. (¿tbl:tab:roofline? also lists
optimized TileLang Conv2d and BatchedMatmul kernels from the same protocol (3.4); their campaigns are omitted for space.)
Reduction and softmax family (TileLang). The same RC0 fix—replacing T.serial reduction loops with native T.reduce and streaming the reduction dimension in tiles (an online, max-rescaled pass for the softmax
variants) rather than materializing the full row in a fragment—generalizes across the entire TileLang reduction and normalization family on the A100 (2). Every catastrophically slow kernel recovers to
PyTorch-comparable or better: max_reduction, mean_reduction, and logsumexp exceed PyTorch (\(132\%\), \(99\%\), \(582\%\)), and softmax and log_softmax reach \(86\%\) and \(71\%\)—all numerically correct, with \(4\)–\(29\times\) speedups over the idiomatic kernels. The lone within-A100 exception is index-returning argmax: tiled shared-memory bulk loads and native FP16 I/O (addressing RC0
and RC1) improve it \(5.2\times\) (11.97 ms to 2.31 ms), yet it stops at \(27\%\) because torch.argmax (0.62 ms) is already well tuned—and the value-only reduction over
the identical shape (max_reduction) reaches \(132\%\), isolating the residual to the index pass. Re-timing the same optimized kernels on the GH200 confirms the pattern transfers (LayerNorm \(120\%\), the rest of the family \(84\)–\(1303\%\); 2 ¿tbl:tab:roofline?), with one instructive exception:
logsumexp, whose A100-tuned wide fp32 fragment register-spills on sm_90 (255 registers, \({\sim}280\) GB of local-memory spill traffic, \(12\%\) occupancy by Nsight
Compute), collapsing to \(1.0\%\). The spill is an RC3-class effect, not the RC0 reduction idiom: retuning the fragment width recovers it only to \(63\%\), so on the GH200
logsumexp is a genuine residual—an “optimized” kernel validated on one GPU that is \(100\times\) off on another with no correctness signal, precisely the evaluation gap a single-target benchmark cannot
close.
6.5 Summary and Remaining Gap↩︎
2 summarizes the per-category results (A100, with GH200 efficiency); they separate into two kinds—the central result of RQ3. The TileLang normalization and reduction family are authoring artifacts: the
RC0 fix recovers every family kernel to PyTorch-comparable or better, closing gaps as large as \(300\times\), with GH200 logsumexp the lone exception—so even a fixed kernel carries a per-target tuning that must
be re-validated. The genuine residuals—Conv2d (\(42\%\)), large square GEMM (\(77\%\)), and index-returning Argmax (\(27\%\))—survive best-effort
optimization because cuBLAS, cuDNN, and torch.argmax are themselves well-tuned on the data-center A100; of the Conv2d gap only \({\approx}2\)–\(3\%\) is absent Winograd
selection (RC4).
6.5.0.1 Cross-architecture portability is itself an authoring concern
A correct, hand-optimized DSL kernel can pass on one GPU yet collapse on another, so single-GPU or single-shape benchmarking cannot certify it. logsumexp is one direction (fast on the A100, register-spilling on the GH200); the
in-tree TileLang Softmax is the other, purely an authoring choice: it caches the entire row in shared memory, so its per-block footprint erodes A100 occupancy—\(20\times\) slower than PyTorch at \(N{=}8192\) and \(111\times\) at \(N{=}32768\), while numerically correct—yet the identical kernel hits parity on the GH200, whose larger shared-memory budget
hides the defect. The streaming variant (tiling the reduction over fixed \(4\) KB blocks) holds parity across the sweep (\(\rho{=}0.55\), ¿tbl:tab:roofline?), so “stream the
reduction; do not cache the full row” is a portable authoring pattern.
| A100-SXM4 (ms) | \(E_\text{lib}\) | |||||
|---|---|---|---|---|---|---|
| 2-4(lr)5-6 Kernel | PyTorch | Before | After | A100 | GH200 | Root cause |
| Triton | ||||||
| Matmul | 0.607 | 1.081 | 0.788 | 77.0% | 68% | RC2 |
| Conv2d | 3.44 | 17.86 | 8.12 | 42.4% | 34% | RC1+RC2 |
| TileLang | ||||||
| LayerNorm | 0.335 | 364 | 0.270 | 124% | 120% | RC0 |
| RMSNorm | 2.52 | 294 | 0.254 | 990%\(^\dagger\) | 1303%\(^\dagger\) | RC0 |
| Softmax | 0.539 | 2.86 | 0.626 | 86.1% | 87% | RC0 |
| LogSoftmax | 0.442 | 2.65 | 0.624 | 70.8% | 90% | RC0 |
| MaxReduction | 0.560 | 11.97 | 0.418 | 131.6% | 84% | RC0 |
| MeanReduction | 0.768 | 10.65 | 0.766 | 99.5% | 97% | RC0 |
| LogSumExp | 2.40 | 4.18 | 0.412 | 581.7% | 1.0%\(^\ddagger\) | RC0/RC3 |
| Argmax | 0.622 | 11.97 | 2.306 | 27.0% | 22% | RC0+RC1 |
All 2 mitigations are re-timed on the A100 under locked clocks (matmul: the \(4096^2\) autotune value, reconciled with \(16384^2\) in 6.4) and revalidate against the same per-dtype tolerances (5/5 pass, 0 edge-case crashes).
7 Discussion↩︎
Our results recast DSL kernel performance as an evaluation problem: the largest gaps hide behind correctness-only gates, most are repairable authoring artifacts, and the remainder marks where compilers and libraries genuinely differ. We draw out implications for DSL and compiler developers, practitioners, and benchmark designers, then state the study’s limitations and threats to validity.
7.1 Implications for DSL Developers↩︎
Our results point to three compiler-side directions, each tagged by the root cause it addresses. Vectorize convolution accesses (RC1): extend Triton’s alias/layout analysis to emit wide LDG.128 loads for strided spatial
patterns—a code-generation fix, not an API change. Make auto-tuning shape-aware (RC2): RC2a is user-space-fixable today by expanding the configuration list (6), but the residual RC2b calls for search
adaptive to operator shape, as sketch-based methods like Ansor [22] demonstrate for irregular operators. Tuning at the deployment shape is
itself costly (\(211\) s vs.sub-second, 4.1), reinforcing that exhaustive tuned coverage is infeasible and the heuristics of 6 are the practical
screen. Support algorithmic alternatives (RC4): exposing Winograd as a schedulable primitive would let the compiler choose execution strategy by filter shape, though the benefit is small (\(\approx\)2–3%).
7.2 Implications for Practitioners and Benchmark Designers↩︎
Performance depends strongly on operator class. Triton is near parity on element-wise and normalization workloads, a favorable programmability trade-off; GEMM carries a cost that may be acceptable when fusion or customization is required; convolution is the weakest category for both DSLs and must be validated against a library baseline, not treated as a drop-in replacement.
The root-cause taxonomy guides debugging. For TileLang reductions and normalization, replace T.serial with T.reduce (RC0a) and inspect register spill (RC3); for convolution, check LDG.128
vectorization (RC1) and whether the tuning space is under-populated (RC2a) or needs a broader strategy (RC2b); Winograd (RC4) contributes only \(\approx\)2–3%. This checklist mirrors [sec:analysis] [sec:mitigation].
Benchmarks should gate on performance, not just correctness. The passes-but-slow result (4.2) yields a concrete recommendation: a benchmark that reports speedup without gating on performance certifies the wrong property. A baseline-independent roofline check (6.1) is a practical acceptance criterion that needs no curated fast reference and would have flagged every passes-but-slow kernel in our study.
7.3 Limitations and Threats to Validity↩︎
Kernel authorship (construct validity). All TileLang suite kernels are our re-implementations (3.1), so the representativeness of the naive kernels—including the headline \(300\times\) LayerNorm—is a threat: a different author might not write the T.serial idiom. Two observations bound it: the same idiom, written independently across the whole reduction and normalization family,
produces the same class of gap; and the in-tree TileLang softmax—authored upstream, not by us—exhibits the same passes-but-slow failure mode (full-row caching, up to \(111\times\) slower while numerically correct; 6.5), so the phenomenon is not an artifact of our authorship.
Baselines and measurement (construct and internal validity). Library efficiency is measured against the strongest library path we could exercise (library-backed PyTorch calls, cudnnFind selection, a large cuBLAS workspace,
algorithms recorded); a stronger unexercised baseline would only widen the gaps. Locked-clock re-timing over 100 runs shows 0.0–0.9% run-to-run relative standard deviation and NCU counters are stable within 2% across five runs, so the gaps lie far outside
measurement variation. Auto-tuning at small shapes can pick configurations arbitrary at deployment shapes; the three affected kernels were re-tuned at the deployment shape (10).
Operator and hardware scope (external validity). We evaluate forward-pass kernels only; backward kernels may expose bottlenecks not captured here. Our primary measurements span the A100 (Ampere, sm_80) and GH200 (Grace Hopper, sm_90), with cross-architecture replay on the A100-PCIE-40GB and H100-80GB-HBM3 confirming the gaps generalize across form factors and GPU families (11). The results characterize NVIDIA datacenter platforms; ROCm and Intel XPU backends are future work.
Heuristic assumptions and conclusion validity. The roofline anchor depends on an essential-work model and an assumed hardware peak; mis-estimating either shifts \(\rho\) (and the two checks disagree near \(\rho\approx0.5\), 6.1), so we use \(\rho\) as a decision signal, not a precise figure. Our root-cause claims combine measurements, counters, and targeted mitigations, which strengthen the causal reading but do not rule out unisolated factors. The 22-kernel suite is a diagnostic probe, not a proposed benchmark—a central claim of this work is that a comprehensive benchmark is infeasible. Finally, both DSLs are evolving; measurements reflect the pinned versions in 3.7, and our released suite supports re-evaluation.
8 Related Work↩︎
8.1 GPU Kernel DSLs and Performance Tooling↩︎
Halide [23] introduced the separation of algorithm from schedule, a principle that informs TVM [24] and TileLang [7]; Triton [14] instead infers shared-memory layout, synchronization, and pipelining from an implicit tile abstraction, and its torch.compile integration [8] has made it the most widely deployed GPU DSL. ThunderKittens [25] instead exposes warp-level tile operations as a thin C++ header library; we characterize performance at the DSL level. TVM’s auto-scheduler Ansor [22] shows that hierarchical program search outperforms template-guided auto-tuning for irregular shapes such as convolution—consistent with RC2 in 5—and MLIR-based pipelines [26], [27] generate near-peak GEMM and fused-attention code within compiler infrastructure.
TritonForge [18] proposes a profiling-guided LLM loop for automated Triton kernel optimization; its finding that coalescing failures and low occupancy dominate kernel-level inefficiency is consistent with RC1 and RC3; it automates fix generation, whereas we characterize systematically across a taxonomy. The vendor libraries themselves—cuDNN [4], cuBLAS [3], and CUTLASS [17]—are extensively engineered, but systematic DSL-versus-library comparisons at this scale and granularity are absent from the literature.
8.2 Benchmarking GPU Software↩︎
The benchmarks closest to our setting evaluate DSL and LLM-generated kernels. TritonBench [12] evaluates Triton kernel generation by LLMs, measuring functional correctness and GPU efficiency as a fraction of hardware peak— a roofline-anchored metric that predates and motivates the anchor we adopt in 6.1, and which we build on rather than introduce. KernelBench [9] is the de-facto benchmark for LLM kernel generation, but it gates on correctness alone and reports speedup only as an outcome. Its single reward-hacking guard flags only implausibly fast kernels (motivated by real incidents of generators exploiting evaluation harnesses to fake speedups [28]), so a merely slow kernel is never rejected. Both benchmarks evaluate only a narrow slice of the (DSL, data type, shape, hardware) space, and MLPerf Inference [29] benchmarks end-to-end throughput while treating the kernel stack as a black box. We do not propose another benchmark: we show the prevailing ones admit performance-poor kernels (4), characterize the hidden gap with hardware counters, and distill heuristics and optimization patterns that guide development without one.
8.3 Efficiency-Aware Evaluation of Generated Code↩︎
A parallel line of software-engineering work makes the correct-but-slow argument for CPU code. EvalPerf [30], Mercury [31], EffiBench [32], and
ENAMEL [33] show that LLM-generated solutions that pass functional tests can be far less efficient than expert code, and each scores efficiency
directly (differential performance, runtime-percentile, and eff@k metrics). These benchmarks target sequential CPU programs, where a canonical reference and input generator suffice; GPU kernels have no canonical reference beyond the vendor
library they may be designed to out-specialize, efficiency depends on a combinatorially infeasible (data type \(\times\) shape \(\times\) architecture) space (4), and we attribute each gap to a fix locus rather than scoring it. Classic performance-bug studies [34], [35] document defects that pass functional tests while degrading performance, and the test-oracle literature [36] frames our observation precisely: a correctness oracle alone is an inadequate oracle for replacement quality.
9 Conclusion↩︎
We studied how to evaluate DSL GPU kernels: can a developer or an automated generator tell whether a correct Triton or TileLang kernel is performant? The benchmarks practitioners rely on gate only on correctness—a naive but idiomatic TileLang kernel passes KernelBench while running more than \(300\times\) slower than PyTorch—and a comprehensive benchmark is combinatorially infeasible, so we characterized the hidden gap across 22 kernels in five operator categories and distilled it into practical guidance.
Most of the gap is an authoring artifact: correcting a single TileLang idiom (T.serial\(\to\)T.reduce with native-dtype I/O) recovers the normalization and reduction family to
library-comparable performance or better on both GPUs, with two diagnosed exceptions—index-returning argmax (27%) and, on the GH200 only, logsumexp (register spill). The remainder—convolution and large GEMM—is a genuine
residual where even a best-effort DSL kernel trails cuDNN/cuBLAS. We separate causes by fix locus and validate two lightweight heuristics—a comparability screen and a roofline anchor—that together tell efficient kernels from poor ones.
A correct DSL kernel is not yet a fast one, and existing benchmarks do not close that gap; until they do, the heuristics and optimization patterns here give developers—and the kernel-generating tools increasingly producing DSL code—a practical way to judge and improve kernel quality.
10 Threats to Validity↩︎
Construct validity. Our primary metric, library efficiency, measures DSL performance relative to the strongest library baseline we were able to exercise for each kernel. Because cuBLAS and cuDNN select among multiple internal
algorithms, any failure to invoke their best-performing configuration would make the DSL appear closer to library performance than it actually is. To reduce this risk, we use library-backed PyTorch paths consistent with standard practice, invoke
cudnnFind for convolution, record the selected algorithms, and allow cuBLAS to use a large workspace. We report under default cuDNN flags (no explicit cudnn.benchmark toggle, no NHWC conversion); convolutions run in the
PyTorch-default NCHW layout, and algorithm-selection variance is bounded by cudnnFind defaults.
Internal validity. Profiling-based analysis may be affected by measurement noise and tool overhead. We mitigate this threat by separating end-to-end timing from counter collection, using repeated runs for both, and verifying that key Nsight Compute measurements remain stable across repetitions. All experiments are executed in isolation on a fixed software and hardware setup to reduce confounding effects from concurrent workloads or environmental variation. Locked-clock re-timing (graphics 1215 MHz / memory 1215 MHz) over 100 runs shows run-to-run relative std-dev of 0.0–0.9% on near-parity kernels, so the reported gaps lie far outside measurement variation rather than being artifacts of frequency variation.
Auto-tuning shape sensitivity. Our auto-tuning sweep selects each kernel’s configuration by timing the candidate grid at a fixed per-kernel shape that, for several kernels, is smaller than the large deployment shape used for
benchmarking. At the smaller shape the candidates often fall within measurement noise, so the selected configuration can be effectively arbitrary and is occasionally slower than the implementation’s hardcoded default at the deployment shape (we observed
Triton mean_reduction at \(+136\%\) and batched_matmul at \(+54\%\) relative to the default). We re-tuned the kernels where this occurred
(batched_matmul, mean_reduction, and attention in Triton) at the deployment shape, restoring configurations at or below the default (\(1.3\)–\(3.0\times\) faster than the small-shape selection); this touches only those auto-tuned rows and does not affect the reported root causes or heuristics.
External validity. Our study covers 22 kernels across five operator categories, but it does not represent the full design space of GPU workloads. In particular, the evaluated configurations emphasize common deep learning operators and shapes rather than uncommon cases such as highly dilated convolutions, extreme group counts, or very small batches. Conv2d is evaluated across 1\(\times\)1, 3\(\times\)3, 5\(\times\)5, 7\(\times\)7, depthwise, and strided variants. In addition, our primary measurements span two architectures—the A100-SXM4-40GB (Ampere, sm_80) and the GH200 (Grace Hopper, sm_90)—with further cross-architecture replay on the A100-PCIE-40GB (same sm_80, a form-factor robustness check) and H100-80GB-HBM3 (a cross-family generalization check); results on other vendor backends may still differ.
Conclusion validity. Our root-cause claims are based on a combination of performance measurements, hardware-counter evidence, and targeted mitigations. Although the mitigation results strengthen the causal interpretation, they do not rule out additional compiler or runtime factors that were not isolated in this study. The conclusions should therefore be read as evidence-supported explanations for the observed gaps, rather than as an exhaustive account of all possible causes.
The suite is a probe, not a proposed benchmark. Our 22-kernel suite is deliberately not offered as a comprehensive performance benchmark—a central claim of this work (4) is that such a benchmark is combinatorially infeasible to build and maintain. The suite instead functions as a diagnostic probe: it is large enough to expose the evaluation gap (correct kernels that existing benchmarks admit yet run far below the library), to root-cause that gap across operator classes, and to validate the proposed heuristics, but it is not intended to certify any kernel as production-ready. The contribution is the evaluation methodology—the passes-but-slow demonstration, the authoring/code-generation/library-maturity taxonomy, and the comparability-plus-roofline heuristics—rather than the suite’s size.
Heuristic assumptions. The roofline anchor depends on an essential-work model (bytes moved or FLOPs) and an assumed hardware peak for each kernel; mis-estimating either shifts the achieved fraction \(\rho\), and the two checks disagree in a judgment band near \(\rho\approx0.5\) (6.1). We therefore use \(\rho\) as a decision signal alongside the comparability screen rather than as a precise efficiency figure, and we record the peak assumptions with each measurement (¿tbl:tab:roofline?). The suite magnitude is measured on the A100 and the evaluation-gap and roofline results on the GH200—two primary architectures carrying complementary evidence—with per-architecture magnitudes reported where they differ.
11 Cross-Architecture Generalization↩︎
The main-paper tables report results on the two primary architectures (A100-SXM4 and GH200). As a robustness check, we replay the kernel suite and the root-cause taxonomy along an A100-SXM4 / A100-PCIE / H100 axis: the A100-SXM4 serves as the anchor,
the A100-PCIE-40GB is a same-architecture (sm_80) form-factor control, and the H100-80GB-HBM3 is a cross-family (sm_90) control. The GH200 primary results remain in the main-paper tables.
3 shows the per-category library-efficiency distribution on the GH200, parallel to 1 in the main paper. The GH200 profile is consistent with the A100: TileLang convolution is competitive on both (GH200 small-shape 8.3% and large-shape 59.9%; A100 7.2% and 59.0%), while TileLang normalization remains collapsed on both (LayerNorm 0.3%). This confirms that the normalization gap is an authoring artifact independent of architecture, while the residual convolution gap is the Triton arm, which holds on both architectures (5).

Figure 3: Library efficiency (%) of Triton and TileLang kernels relative to cuBLAS/cuDNN on the NVIDIA GH200-480GB, by kernel category (log scale; dashed line = 100% parity). Same layout as 1: GEMM shows IQR
boxes; other categories show per-kernel dots. \(\diamond\) 1082% (Triton, Norm.) marks rms_norm: unfair-baseline artifact, not a DSL win. TileLang Conv2d is competitive on both (GH200 59.9% large; A100 \(\sim\)59%); TileLang Norm.remains collapsed (0.3%). Attention excluded ([sec:eval:gemm])..
| Triton | TileLang | |||||
|---|---|---|---|---|---|---|
| 2-4(lr)5-7 Category | SXM4 | PCIE | H100 | SXM4 | PCIE | H100 |
| GEMM | 77.3% | 75.5% | 68.4% | 69.4% | 60.3% | 69.2% |
| Convolution | 31.6% | 38.0% | 37.7% | 9.5% | 11.1% | 7.8% |
| Normalization | 121.5% | 137.3% | 130.5% | 1.0% | 0.8% | 0.9% |
| Element-wise/Reduction | 65.3% | 73.0% | 72.9% | 51.0% | 55.3% | 60.9% |
| Triton \(E_\text{lib}\) | Triton | |||
|---|---|---|---|---|
| 2-4 Filter | SXM4 | PCIE | H100 | \(n_\text{spills}\) |
| \(1\times1\) | 28.7% | 37.0% | 24.7% | 0 |
| \(3\times3\) | 19.3% | 24.4% | 11.4% | 0 |
| \(5\times5\) | 13.7% | 16.9% | 13.4% | 0 |
| \(7\times7\) | 9.8% | 12.5% | 15.7% | 0 |
12 Per-Kernel Library Efficiency↩︎
5 lists \(E_\text{lib} = t_\text{PyTorch} / t_\text{DSL}\) for each kernel at the large input shape on the A100-SXM4, tuned configurations. Values below 100% indicate the DSL is slower
than the library baseline. Four near-parity element-wise kernels (leaky_relu, swiglu, logsumexp, cross_entropy) exceeded 100% on both DSLs at the large shape and are omitted from this table; their
main-paper medians appear in ¿tbl:tab:summary?. With those four, the table accounts for all 22 suite kernels.
| Kernel | Input shape | Triton | TileLang |
|---|---|---|---|
| GEMM | |||
| matmul | \(16384\!\times\!16384\) FP16 | 59.7% | 78.1% |
| batched_matmul | \(128\!\times\!2048\!\times\!2048\) FP16 | 97.9% | 94.2% |
| linear_activation | \((1,2048,4096)\) FP16 | 185.5% | 468.5%\(^{\dagger}\) |
| Attention (excluded from main comparison; see [sec:eval:gemm]) | |||
| attention | QKV \((8,32,2048,128)\) FP32 | 7691%\(^{\ddagger}\) | 54.3% |
| Convolution | |||
| conv2d | \(32\!\times\!256\!\times\!128^2\), \(3\!\times\!3\) FP16 | 28.6% | 59.0% |
| Normalization | |||
| layer_norm | \(8192\!\times\!8192\) BF16 | 90.2% | 0.3% |
| rms_norm | \(8192\!\times\!8192\) FP16 | 873%\(^{\S}\) | 3.2% |
| Element-wise / Reduction | |||
| add | 64M FP16 | 90.8% | 74.5% |
| mul | 64M FP16 | 69.5% | 67.1% |
| relu | \(16384\!\times\!16384\) FP16 | 95.7% | 68.1% |
| softmax | \((4096,32768)\) FP16 | 117.2% | 0.9% |
| log_softmax | \((4096,32768)\) FP16 | 45.3% | 3.6% |
| argmax | \((8192,32768)\) FP16 | 25.5% | 5.9% |
| max_reduction | \((8192,32768)\) FP16 | 109.6% | 67.2% |
| mean_reduction | \((8192,32768)\) FP32 | 92.7% | 97.4% |
| matrix_transpose | \(16384\!\times\!16384\) FP16 | 342.8%\(^{\|}\) | 67.4% |
| embedding | \((131072,1024)\) idx FP16 | 447.9%\(^{\P}\) | 57.9% |
| index_select | \((65536,2048)\) idx FP16 | 59.2% | 56.6% |

13 Reproducibility Details↩︎
13.1 Kernel Suite Provenance↩︎
13.1.0.1 Selection criteria
We narrow the candidates from TritonBench [12] and the TileLang example repository [7] using four criteria applied in order. (i) Forward-pass only: backward and gradient kernels are excluded, as they are governed by different access patterns and reduction structures. (ii) Stable library baseline: each kernel must admit a well-defined cuBLAS, cuDNN, or PyTorch eager reference that computes the same function, making library efficiency a meaningful quantity. (iii) Five-category coverage: we retain kernels that populate the five operator categories (GEMM, attention, convolution, normalization, element-wise/reduction) rather than over-sampling any single class. (iv) Canonical operators: kernels with sparse inputs or runtime-dependent output shapes are excluded for lacking a stable baseline.
13.1.0.2 Per-kernel provenance
6 lists all 22 kernels. Triton implementations are drawn from TritonBench except layer_norm, which follows the TorchInductor reference implementation. All TileLang implementations are our re-implementations
of the same operators. PyTorch implementations are cuBLAS, cuDNN, or PyTorch-eager baselines as described in 13.2.
| Kernel | Category | Triton Source | TileLang Source |
|---|---|---|---|
| matmul | GEMM | TritonBench | Custom |
| batched_matmul | GEMM | TritonBench | Custom |
| linear_activation | GEMM | TritonBench | Custom |
| attention | Attention | TritonBench | Custom |
| conv2d | Convolution | TritonBench | Custom |
| layer_norm | Normalization | TorchInductor ref. | Custom |
| rms_norm | Normalization | TritonBench | Custom |
| add | EW / Red. | TritonBench | Custom |
| mul | EW / Red. | TritonBench | Custom |
| relu | EW / Red. | TritonBench | Custom |
| leaky_relu | EW / Red. | TritonBench | Custom |
| softmax | EW / Red. | TritonBench | Custom |
| log_softmax | EW / Red. | TritonBench | Custom |
| logsumexp | EW / Red. | TritonBench | Custom |
| swiglu | EW / Red. | TritonBench | Custom |
| argmax | EW / Red. | TritonBench | Custom |
| max_reduction | EW / Red. | TritonBench | Custom |
| mean_reduction | EW / Red. | TritonBench | Custom |
| cross_entropy | EW / Red. | TritonBench | Custom |
| matrix_transpose | EW / Red. | TritonBench | Custom |
| index_select | EW / Red. | TritonBench | Custom |
| embedding | EW / Red. | TritonBench | Custom |

13.2 Baseline Specifications↩︎
GEMM baselines use cuBLAS via torch.matmul. Convolution baselines use PyTorch nn.Conv2d with default NCHW memory layout under standard cuDNN algorithm selection. Normalization baselines use F.layer_norm and
F.rms_norm. Element-wise and reduction baselines use standard PyTorch eager execution. For attention, we use PyTorch scaled dot-product attention with the FlashAttention backend enabled through enable_flash_sdp(True).
13.2.0.1 GEMM notation and exclusions
Per-shape GEMM latencies appear in 5; \(16384^2\) denotes a square \(16384\times16384\) FP16 GEMM and \(64\times128^2\) a
batched GEMM of batch 64 over \(128\times128\) matrices. FP32 TileLang GEMM is excluded: T.gemm silently lowers to TF32, making FP32 results a precision artifact rather than a logic error (3.3). ¿tbl:tab:summary? reports the category medians; the \(16384^2\) Triton gap to 59.7% reflects an under-populated auto-tune search space (RC2), while TileLang
reaches 78.1% on that shape via an explicit schedule.
13.3 Measurement Protocol↩︎
13.3.0.1 End-to-end timing
We measure host-synchronized GPU execution time using time.perf_counter() bracketed by torch.cuda.synchronize() calls. Each measurement uses 10 warm-up iterations followed by 100 timed iterations; we report the median. Results
reflect GPU-side execution only, excluding host-side dispatch overhead, and each workload runs in isolation.
13.3.0.2 Clock-lock settings
On the A100-SXM4-40GB, we pin graphics and memory clocks to 1215 MHz and 1215 MHz respectively via nvidia-smi --lock-gpu-clocks and --lock-memory-clocks. The nominal maximum is 1410 MHz, but that setting power-caps under the
400 W board limit and causes clock throttling; 1215 MHz is stable and yields run-to-run relative standard deviation of 0.0–0.9% across 100-iteration timing windows. On the GH200, clocks are locked at 1320 MHz (graphics) and 2619 MHz (memory).
13.3.0.3 Nsight Compute counter definitions
We collect the following seven counters per kernel; each is gathered from a single ncu execution and verified within 2% across five repeats.
Global-load efficiency — fraction of global memory transactions that serve requested bytes (1.0 = perfectly coalesced).
Sectors per request — average number of L1/L2 cache sectors accessed per memory instruction; lower values indicate better coalescing.
Registers per thread — register file allocation per thread; high values increase occupancy pressure and can trigger spill.
Register spills — bytes spilled from the register file to thread-local memory (L1/L2/DRAM); non-zero values denote register-pressure-induced latency.
Long-scoreboard stall cycles — warp stall cycles waiting for L2 or DRAM data; the dominant stall for memory-bound kernels.
Barrier stall cycles — warp stall cycles at thread-block synchronization barriers (
__syncthreads/bar.sync).L2 sector hit rate — fraction of L2 cache sector accesses that hit; low rates indicate DRAM pressure.
13.3.0.4 KernelBench evaluator harness
For the passes-but-slow demonstration (4.2), we invoke KernelBench’s eval_kernel_against_ref function, which (i) overrides the candidate kernel’s get_inputs and
get_init_inputs with those of the reference implementation so input shapes cannot be altered by the candidate, (ii) checks output equivalence on randomized inputs at the same per-dtype tolerances as our correctness suite (3.3), and (iii) emits a warning only if the candidate’s throughput exceeds \(10\times\) the reference—a speedup-only guard that admits any slowdown. We record pass/fail and measure
slowdown separately using our clock-locked timing harness.
13.4 Full Hardware and Software Stack↩︎
13.4.0.1 Hardware
13.4.0.2 Software stack
| Package | Version |
|---|---|
| PyTorch | 2.8.0+cu128 |
| Triton | 3.4.0 |
| TileLang | 0.1.6.post1 |
| cuDNN | bundled with PyTorch |
| Nsight Compute | 2026.2.0 |
All experiments use default cuDNN algorithm selection flags and pre-warm the Triton auto-tuner before measurement. A requirements.txt pinning this framework stack is distributed with the artifact; the pinned PyTorch wheel bundles its own
CUDA runtime and cuDNN.
13.5 Optimization Trajectory: TileLang LayerNorm↩︎
To illustrate the correctness-gated iterative protocol of 3.4, 8 lists the full 18-iteration search for the TileLang LayerNorm kernel of 6.2. Two edits dominate: iteration 1 replaces the manual T.serial reduction with a single T.reduce (RC0), and iteration 14 switches to native bfloat16 I/O, removing the intermediate
.float() casts. The intervening iterations confirm that thread count, tiling, and reduction algebra are second-order once the kernel is bandwidth-bound, and two configurations fail to compile—evidence that the search is genuine rather than a
curated path. Runtimes are on the separate development GPU (6); the selected final kernel is re-timed on the A100-SXM4 in 2.
| Iter | Change | Runtime (ms) | \(E_\text{lib}\) |
|---|---|---|---|
| base | T.serial reduction | 1090 | 0.08% |
| 1 | Replace T.serial with T.reduce | 5.24 | 17.1% |
| 2 | Register copy, 256 threads | 5.22 | 17.2% |
| 3 | 2D block_M\({=}4\), reduce_sum dim 1 | — | — |
| 4 | 2D T.copy fix, reduce_sum dim 1 | 5.22 | 17.2% |
| 5 | 512 threads | 5.22 | 17.2% |
| 6 | fp16 I/O, fp32 accumulate | 3.02 | 29.5% |
| 7 | 2D merged \(E[x^2]{-}E[x]^2\) | — | — |
| 8 | 1024 threads, fp16 I/O | 3.02 | 29.6% |
| 9 | Tiled reduction block_N\({=}1024\) | 2.99 | 29.9% |
| 10 | Two-pass tiled (sum\({+}\)sq in pass 1) | 3.00 | 29.8% |
| 11 | \(E[x^2]{-}E[x]^2\), single load | 3.02 | 29.6% |
| 12 | Disable warp-specialized pass_configs | 3.02 | 29.6% |
| 13 | Store \(x{-}\mu\) in fp16 to save registers | 3.02 | 29.6% |
| 14 | Native bfloat16 I/O, no cast | 0.893 | 99.8% |
| 15\(^\dagger\) | out_idx output allocation | 0.891 | 100.0% |
| 16 | Full fp32 row_copy (more regs) | 0.905 | 98.5% |
| 17 | Restore iter-15 configuration | 0.893 | 99.8% |
| 18 | 128 threads | 0.895 | 99.6% |
4pt
References↩︎
The LayerNorm slowdowns quoted in this paper differ only in GPU, kernel variant, and comparison target—A100 vs.PyTorch: \(299\times\) (tuned idiomatic, 97.0 ms); A100 naive\(\to\)optimized: \(380\times\) (tuned) and \(1347\times\) (untuned, 364\(\to\)0.270 ms, locked; 2); GH200 vs.PyTorch: \(323\times\) (locked), \(329\times\) (suite profile), \(1293\times\) (worst-case variant, unlocked); GH200 naive\(\to\)optimized: \(1541\times\) (worst-case; ¿tbl:tab:roofline?).↩︎
Triton matmul and cuBLAS read 0% on this load counter because their
cp.async/LDGSTSstaging bypasses theLDGinstruction the counter tracks.↩︎