A Clustering-Based Framework for Identifying Suspicious Trading Patterns in Capital Market
July 05, 2026
Abstract
Market manipulation is the dubious practice of manipulating stock prices in order to make a quick profit, which truly degrades confidence on trading platforms. We implemented an unsupervised fraud-detection toolkit that begins with K-Means++ clustering to address this issue. A dataset of roughly one million financial transactions from 2012 to 2024 is used. In order to identify fraudulent trades and categorize them using market practice heuristic thresholds, the study suggests a clustering-based pipeline. The method highlights 2.02% of trades as suspicious where 51.10% clearly indicate spoofing, 0.10% indicate pump and dump, 0.55% indicate insider trading, 1.43% indicate a fake breakout, and 46.83% are unclassified. Despite the lack of ground truth, the model’s performance is confirmed by a Silhouette Score of 0.561.
Manipulation, Stock Market, Detection, Price, Visualization.
1 Introduction↩︎
Every nation’s infrastructure is extremely dependent on the state of its economy. An essential component of the nation’s economic growth is the stock market. As new products and trends shape the market, stock markets are evolving. The idea of a stock market is slowly gaining momentum in Bangladesh. Despite improvements in financial literacy, DSE participation is still low. Growth is still low because of investor mistrust, anticipated dangers, and previous market fraud incidents[1]. Due to its isolation from international markets the DSE has limited growth especially in times of crisis like COVID-19 [2]. The Dhaka Stock Exchange shows chronic volatility clustering due to severe volatility of the Bangladeshi stock market. Macroeconomic factors such as inflation, interest rates, currency rates, and external shocks had a significant impact on it [3]. Investor trust has been damage and long-term economic progress has been hampered by problems including insider trading and manipulation[4].
Because they rely on labeled data and predefined patterns, traditional regulatory and supervised machine learning approaches frequently fail to identify complex fraudulent activities in financial markets [5]. K-Means clustering has demonstrated promise in fraud detection by rapidly classifying regular and suspicious transactions [6]. A lightweight, unsupervised, clustering-based fraud detection framework that can adaptively identify suspicious trading behaviors from evolving market data is critically needed.This study develops a generic pipeline capable of detecting potential market manipulation and manipulative behaviors in historical stock trading data.
The main contributions of this research include -
We propose a scalable unsupervised Stock Market Manipulation Detection (SMMD) framework that integrates clustering-based structural anomaly detection with behavioral financial heuristics.
We extract nine technical indicators using 30-day rolling windows to capture temporal patterns indicative of abnormal trading behavior.
K-Means outperforms DBSCAN, OPTICS, and hierarchical clustering in accuracy (0.987), silhouette score (0.965), and scalability, making it highly effective for detecting sparse fraudulent trading patterns [7].The proposed KMeans clustering algorithm marks outliers as potential indicators of suspicious activity and natural clusters of regular trading patterns.
We provide interpretable fraud-type categorization aligned with real-world manipulation patterns.
We present an adaptive percentile-based risk categorization approach and a symbol-level suspicion rating system.
To minimize false positives, we develop a hybrid anomaly filtering system that combines percentile-based behavioral criteria with distance-based outlier detection.
2 Literature Review↩︎
Traditional supervised learning models have been widely used for fraud detection, but their effectiveness is confined by the need for enormous volumes of labeled data and inability to identify key fraud patterns. Currently, more researchers are focusing
on unsupervised learning methods that could overcome these issues, especially clustering algorithms, which enable anomaly detection in unlabeled information.
Zengyi et al. [6] performed actual transaction data analysis in the identification of financial fraud using the K-means unsupervised clustering technique. Principal
Component Analysis was used for the simplification of data and the identification of key elements useful in fraud detection.
SimCLR and its usage were introduced by Xuan Li et al. in 2024 [8]. SimCLR identifies transaction patterns and identifies unusual transaction activities without requiring supervision. The authors conducted an experiment on an eBay transaction data set which contained all sorts of actions. The research used various ways of data preparation and an exclusive technique which uses SimCLR contrastive learning.
To be able to detect anomalies within stock price time series data, Wenjie, Ruofan, and Bofan (2020) [9] designed a deep learning model that incorporated Conv1D and LSTM. Conv1D enabled it to divide data into 30-day chunks. Subsequent LSTM layers enabled it to detect long-term trends. The model also incorporated three dense layers for forecasting.
Li et al. (2025) [10] developed an ensemble machine learning framework to identify unusual trading by APAC investors in U.S. markets. It removed the error rates by 34.7% and obtained an AUC-ROC of 0.971 using data from approximately 847,000 accounts across twelve APAC economies.The study emphasizes the significance of incorporating behavioral economics and advanced machine learning into RegTech. To detect fintech fraud Darwish et al. (2025) [11] presented a multi-stage hybrid methodology. To solve class imbalance, they used rule-based filtering, K-means clustering, Artificial Bee Colony (ABC) optimization, and KNN classification with ABC-sampling.On e-commerce datasets, it obtained 95.0% accuracy.It reduces false positives and improves robustness in fraud detection using unbalanced data.
3 Research Methodology↩︎
An unsupervised learning model is proposed to detect the manipulated stocks of daily stock data from 2012 to 2024. Necessary steps have been taken to preprocess the data.
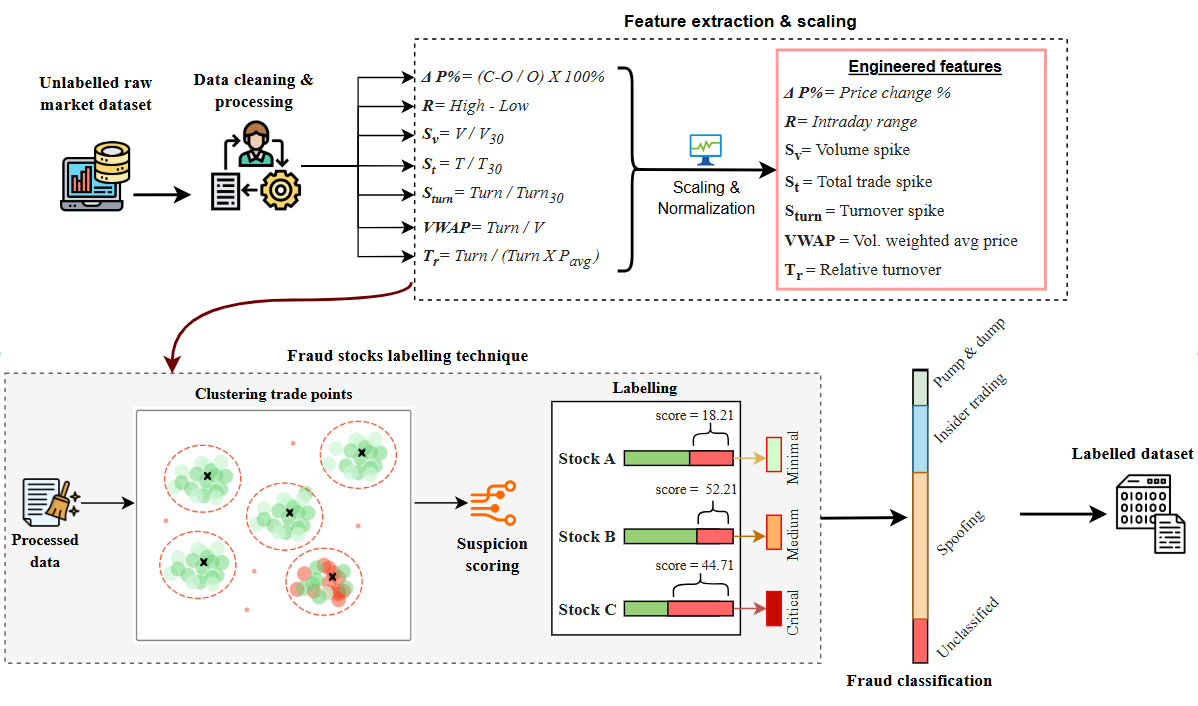
Fig. 1 outlines our study’s process.
3.1 Data Preprocessing↩︎
To ensure the quality and reliability of the stock market dataset, a series of preprocessing steps were implemented:
The "Date" field was converted to the right datetime format, and duplicate, erroneous, and incomplete entries were eliminated from the data.
Dropna() was used to eliminate missing values in the rows, leaving a clean dataset with 1,019,783 rows.
3.2 Feature Engineering↩︎
To enhance the model’s ability to detect suspicious trading patterns, multiple features were engineered from the cleaned stock dataset. Nine new features were developed using a 30-day rolling frame to capture trading trends and detect anomalies. Infinite division values were substituted with NaNs, then replaced with default values.Before being employed in anomaly detection clustering, all features were standardized.
3.3 Feature Scaling↩︎
In machine learning, feature scaling is a method for normalizing independent variables or features to a specific range[12]. After cleaning all features were consistent. Then, we standardized the selected features with StandardScaler, which gives a mean of 0 and a standard deviation of 1. This phase guarantees that all features contribute equally to the clustering procedure by increasing model performance and stability. The pseudocode for Algorithm 2 outlines a six-phase unsupervised pipeline to detect anomalous trading patterns in daily stock data spanning 2012–2024. The definitions of all the variables used in the pseudocode are provided in Table 1.
3.4 Model Training↩︎
Clustering is an unsupervised classification method that divides a set of multidimensional data into clusters based on a predetermined criterion [13].
3.4.1 K-means++ Clustering Algorithm↩︎
K-means++ is a popular variant of K-means for minimizing the Sum of Squared Euclidean Distances (SSEDM). K-means++ iteratively selects initial cluster centres in a way that spreads them out, allowing the algorithm to converge faster and avoid poor local minima [14].
3.4.2 Clustering with K-Means++ using the Elbow Method↩︎
To establish a k value, which is applied to cluster the datasets into k sets, we used the elbow approach to calculate the number of clusters. From the plot, we can see a significant decrease in inertia from k = 2 to 6.
Fig. 3 shows the elbow method used for optimal k clusters.
3.4.3 K-Means++ Algorithm Implementation Steps↩︎
This whole algorithm operates in the following steps [15]:
In order to find the value of k we used the technique of Elbow. The value of k is chosen where the reduction in inertia slows down.
The initial location of the centroid is random. For each observation, the closest centroid in Euclidean distance is assigned. Then the center of mass is found for each of the k groups.
The process is stopped when there is less than a certain fixed distance between the two centers of mass. Otherwise, the process is repeated.
3.5 Proposed Algorithm: Stock Market Manipulation Detection (SMMD)↩︎

| Symbol | Description |
|---|---|
| \(C, O, H, L\) | Daily closing, opening, high, and low prices |
| \(V, T, Turn\) | Trading volume, number of trades, and turnover (monetary value) |
| \(\Delta P\%\) | Percentage price change: \(\frac{C - O}{O} \times 100\) |
| \(R\) | Intraday price range: \(H - L\) |
| \(V_{30}, T_{30}\) | 30-day rolling average of volume and number of trades |
| \(\sigma_{30}\) | 30-day rolling standard deviation of closing price (volatility) |
| \(S_V, S_T, S_{Turn}\) | Spike ratios: \(V/V_{30}\), \(T/T_{30}\), \(Turn/Turn_{30}\) |
| \(VWAP\) | Volume-weighted average price: \(Turn / V\) |
| \(P_{avg}\) | Average of open and close: \((O + C)/2\) |
| \(X, X_s\) | Feature matrix and its standardized version |
| \(k, M\) | Number of clusters (\(k=5\)) and fitted K-Means model |
| \(d_i\) | Euclidean distance of point \(i\) to its cluster center |
| \(t_d, t_V, t_T\) | 95th percentile thresholds for distance and spike features |
| \(Score\) | Suspicion score: percentage of flagged days per stock |
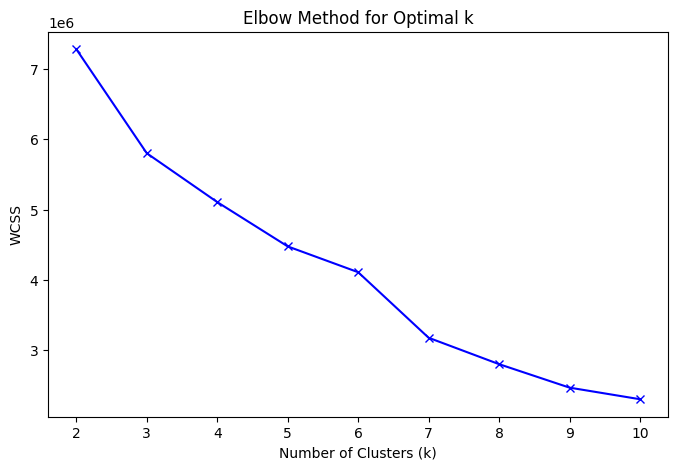
Figure 3: Elbow Method for Optimal k.
3.6 Model Evaluation↩︎
Silhouette Score: Silhouette analysis mainly checks how close each item in the cluster is to items in other clusters. The score value ranges from -1 to +1. A score value of +1 indicates that objects are well-clustered, whereas a score value of -1 shows that the objects are not correctly clustered[16].
\[\begin{array}{l} \text{ For a single sample } i \text{ : }\\ s(i)=\frac{b(i)-a(i)}{\max \{a(i), b(i)\}} \end{array}\] Where:
a(i) = average distance between i and all other points in the same cluster.
b(i) = average distance between i and all points reside in any other cluster.
4 Result and Discussion↩︎
4.1 Anomaly Detection Results↩︎
Outliers were spotted by calculating how far each trade was from its cluster’s center.The top 5% farthest labeled as structural outliers. To detect suspicious trades, behavioral thresholds such as volume spikes, transaction count, turnover which is above the 95th percentile [17],and price fluctuations greater than 10% were observed. Only a trade that is distant from a cluster and exhibited at least one of the following behaviors would be considered suspicious. Lastly,the suspicious trade is processed by a fraud detection scoring system.
4.2 Suspicious Symbol Scoring↩︎
The suspicion score for stocks is calculated by combining fraud frequency and anomaly severity.The Frequency indicates if the unusual activity happen frequently and the Severity determines how extreme the unusual trades are.The formula is defined in the equation 2 :
\[\label{eq:placeholder95label} \text{Suspicion score} = \alpha \left( \frac{F}{T} \times 100 \right) + (1-\alpha) \bigl( PR(D) \bigr)\tag{1}\]
where:
F = Number of flagged trades.
T = Total number of stock trades.
PR(D) = Percentile rank of the anomaly distance.
\(\alpha\) = Weight parameter for frequency.
\(1-\alpha\) = Weight parameter for severity.
4.3 Risk Categorization Method↩︎
The next stage of the study is to classify stocks into various risk levels after calculating each stock’s final suspicion score. Table 2 shows the risk category and its percentile range.
| Risk Category | Percentile Range |
|---|---|
| Critical Risk | \(\geq 90^{th}\) |
| High Risk | \(75^{th} - 90^{th}\) |
| Medium Risk | \(50^{th} - 75^{th}\) |
| Low Risk | \(25^{th} - 50^{th}\) |
| Minimal Risk | \(\leq 25^{th}\) |
4.4 Fraud Type Classification↩︎
The flagged trades were examined and sorted into six fraud categories. Fig. 5 shows fraud pattern breakdown of top 20 suspicious stocks.
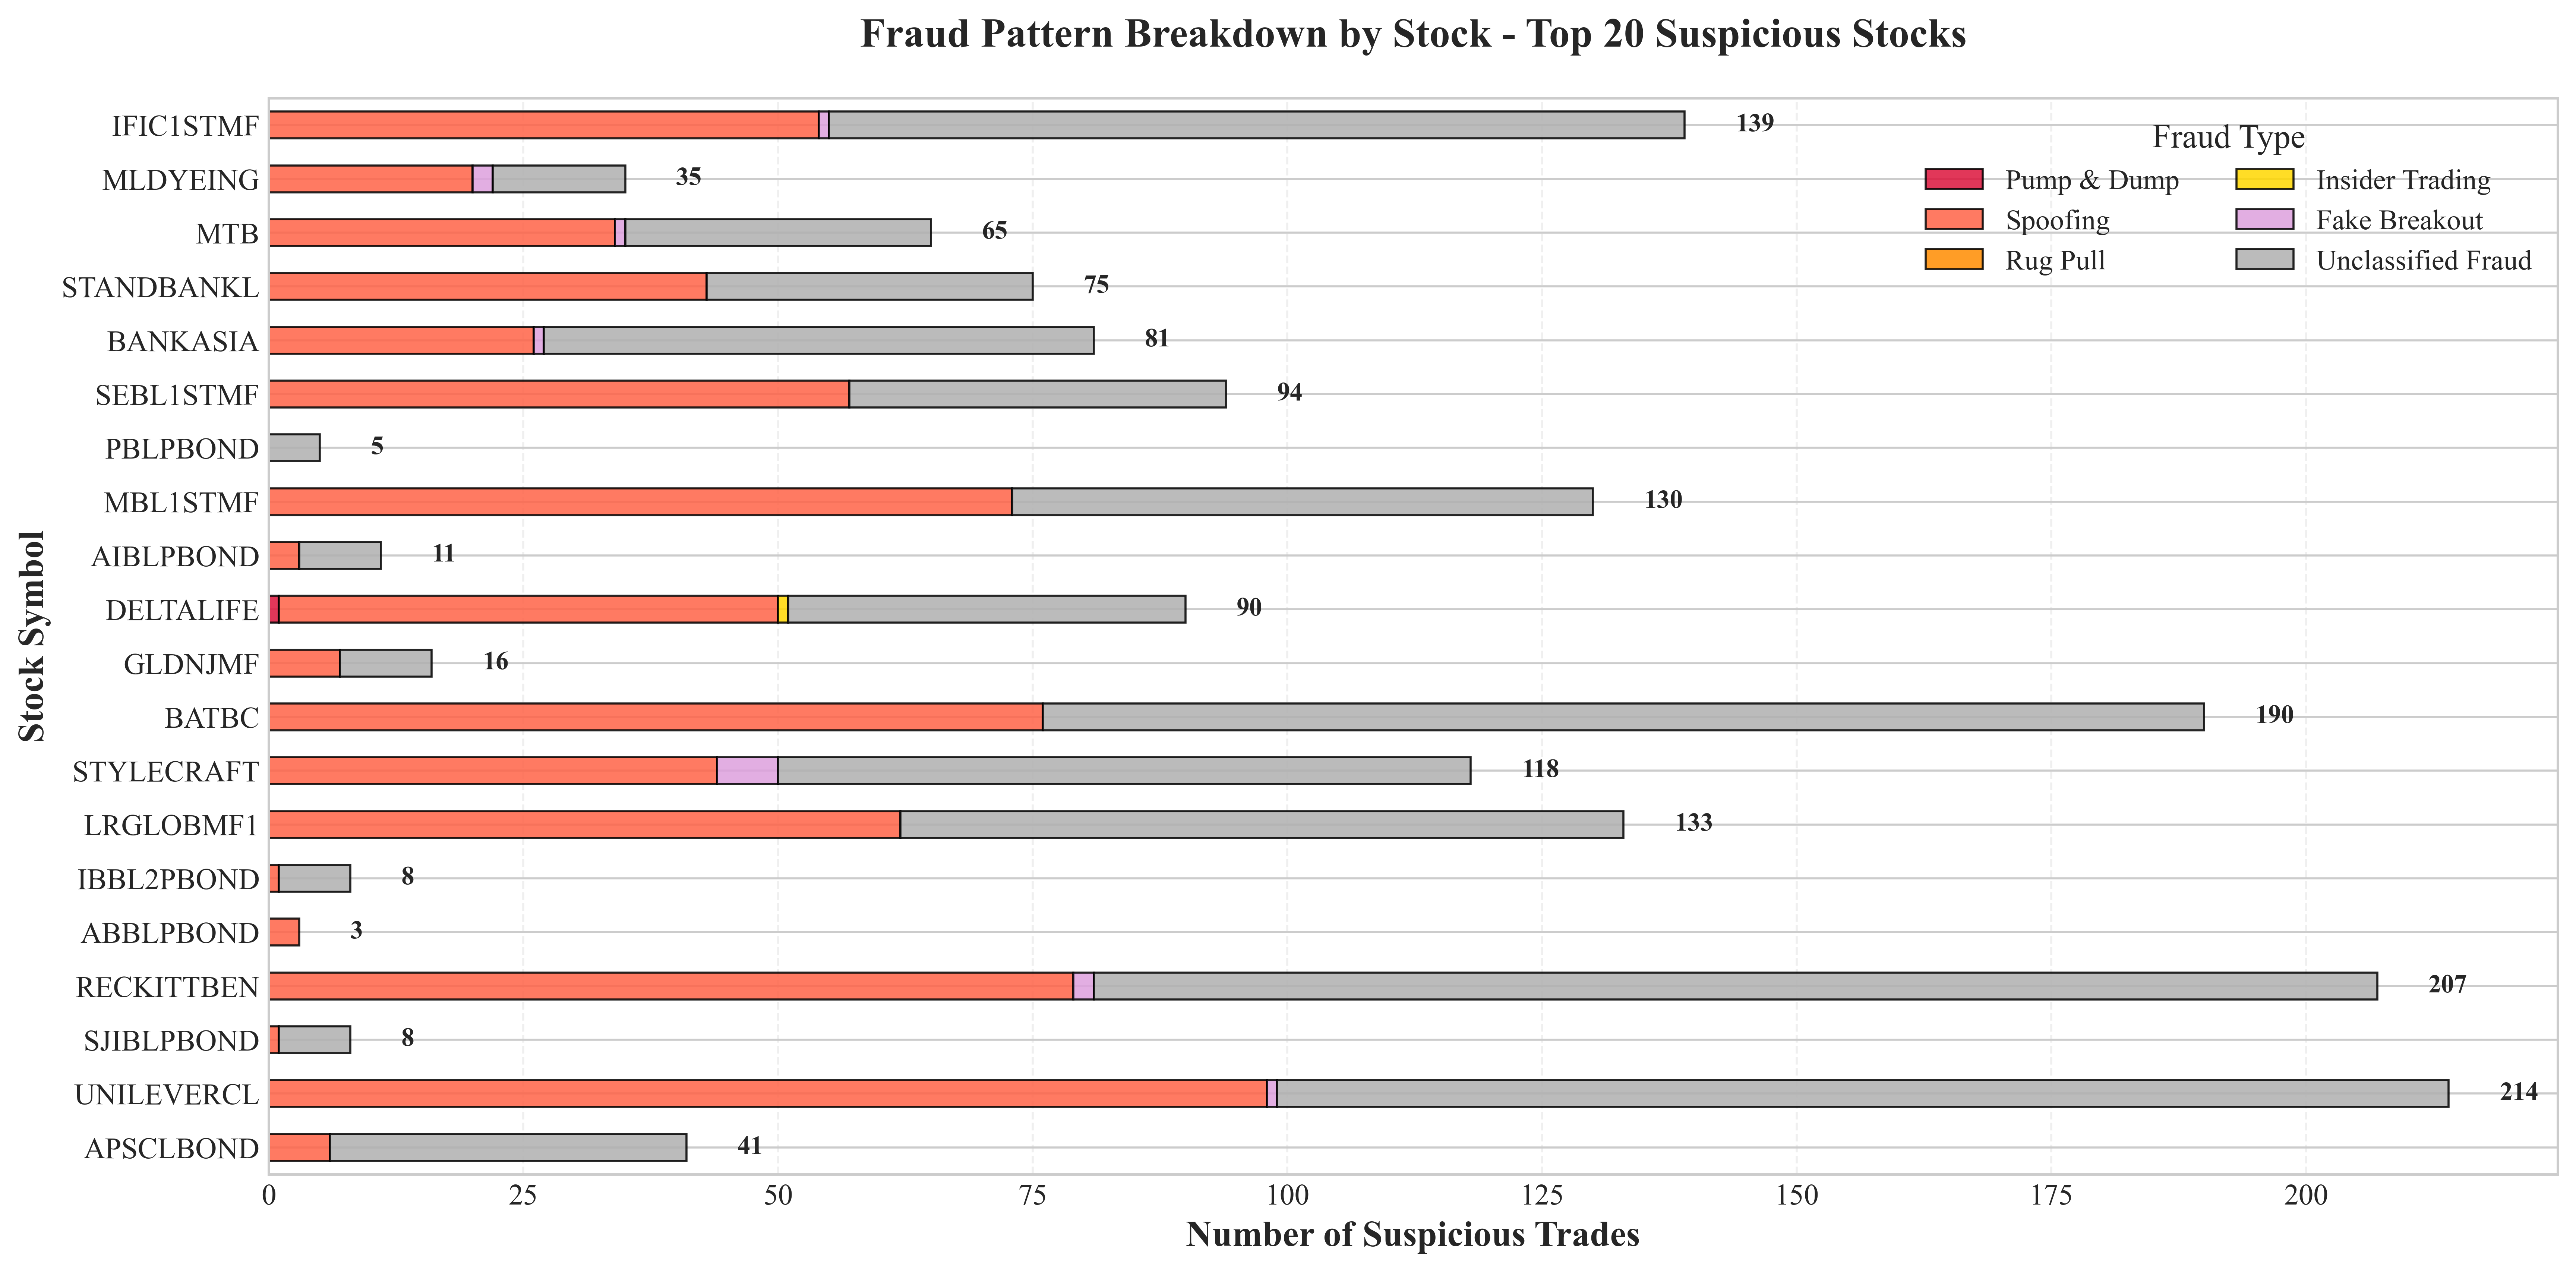
Figure 5: Fraud Pattern Breakdown of Top 20 Suspicious Stocks.
Pump & Dump: A stock’s price quickly rises by over 10% [18] along with high trading volume, and then the price falls again within five days.
Spoofing: High order or transaction volume with minor price fluctuation [19].
Rug Pull: A sharp rise in both price and volume was followed by a steep decline [20].
Insider Trading:A sharp increase of more than ten percent on a low-volume spike of less than one point, which suggests possible insider trading.
Fake Breakout: The price increased over 10% with high volatility, but reversed within a week.
Unclassified Fraud: If none of the above fits, we toss the odd data point into unclassified.
4.5 Fraud Type Classification Criteria↩︎
Based on observable features, heuristic rules classified suspicious trading behavior to match real-world fraud patterns. . The Table 3 shows the particular criteria used to classify flagged trades as known fraud types.
| Fraud Type | Price (%) | Vol. Spike | Trades Spike | Range | Lookahead |
|---|---|---|---|---|---|
| Pump & Dump | \(+10 \rightarrow -10\) | \(>95^{th}\) pct | – | – | 5 days |
| Spoofing | \(<5\) | \(>95^{th}\) pct | \(>95^{th}\) pct | – | Same day |
| Rug Pull | \(+10 \rightarrow -10\) | \(>95^{th} \rightarrow <0.5\times\) | – | – | 5 days |
| Insider Trading | \(>10\) | \(<1.0\times\) | – | – | Same day |
| Fake Breakout | \(>10\) (reversal) | – | – | \(>90^{th}\) pct | 5 days |
| Unclassified | Any | \(>95^{th}\) pct | \(>95^{th}\) pct | – | N/A |
em
4.6 Visualization of fraud trades↩︎
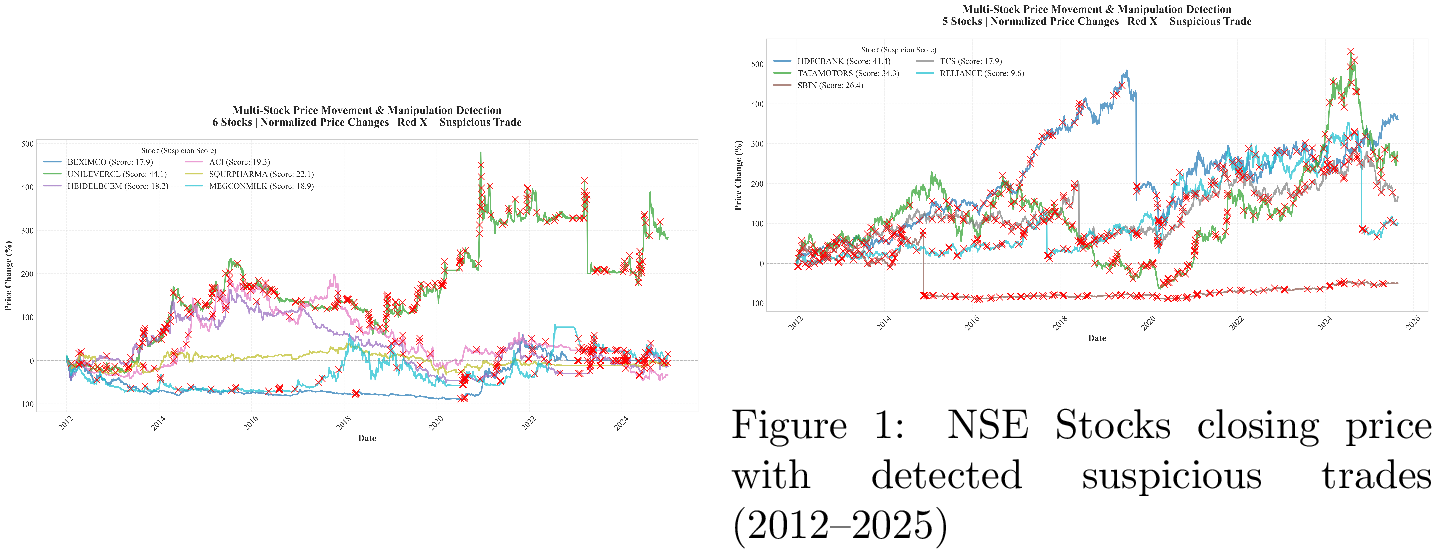
Each stock’s closing price is plotted alongside red markers that indicate suspicious trades in the visualization. According to their Suspicion Scores, stocks like UNILEVERCL (44.1%), SQURPHARMA (22.1%), ACI (19.3%), HEIDELBCEM (18.2%), MEGCONMILK (18.9%), and BEXIMCO (17.9%) display a variety of anomalous density. To understand when these suspicious trades happened, a chart of flagged trades marked by red ‘×’ symbols. Fig. 4 depicts some random 6 suspicious stocks of DSE. Our proposed manipulation detection system is applied on the NSE (National stock market of India) dataset to test its effectiveness in a global market context in Fig. [fig:nse] .
4.7 Model Evaluation↩︎
The assessment of the clustering-based anomaly detection system relied primarily on the Silhouette Score which served as the main indicator of model performance.
The obtained scores of 0.561 and 0.292 show well-defined and separated clusters for both exchanges.
4.8 Result Summary↩︎
The Clustering Model performed effectively by achieving a silhouette score of 0.561. 2.02% of deals were reported as suspicious which indicates a suitable detection rate for identifying anomalies in DSE financial data.Spoofing was the most frequent containing 51.1% cases while other types of fraud were less frequent.This approach should work with datasets from around the globe which remain unlabeled dataset. It worked well even in Bangladesh’s unstable trading conditions.
5 Conclusion↩︎
The system detects, visualizes, and interprets unusual trading behavior in real-world market data. This checked more than one million trades from the Dhaka Stock Exchange with the help of rules and grouping, yielding a varying verification rate of 2.02%
with a silhouette score of 0.561. It performs well on noisy and irregular data.It works well on global data and help label trading dataset that isn’t structured.
The lack of confirmed ground-truth data in the study is a disadvantage.In addition,the thresholds could not adapt well to highly dynamic marketplaces. While calculating suspicion scores, the 60/40 weight distribution is a heuristic that may need to be
adjusted for other trading environments.The system emphasizes classifying anomalous stock returns rather than precise classification. Advanced clustering techniques like DBSCAN/HDBSCAN and scalable real-time processing are the indications of future
enhancements.The system may become more effective and flexible for market analysts and regulators by ensuring stability and market transparency in global markets.