Beyond Gradient-Based Attacks: Adversarial Robustness and Explainability Stability in Cybersecurity Classifiers
July 02, 2026
Abstract
Adversarial attacks on cybersecurity classifiers pose a dual threat: degrading predictions and destabilising the SHAP-based explanations that security analysts rely on to understand and triage alerts. We extend our prior MLP conference study to Random Forest and XGBoost across four tabular security datasets (phishing URLs, UNSW-NB15, NF-ToN-IoT, HIKARI-2021), evaluating five attacks including three black-box methods applicable to non-differentiable tree models. We introduce the Explainability Stability Index (ESI), a scalar metric computed from TreeSHAP attribution drift under adversarial perturbation, reported on the same \([0,1]\) scale as the Robustness Index (RI). A key finding is that gradient-based black-box attacks (ZOO) produce degenerate results against XGBoost (apparent RI \(\approx\) 0.98) due to piecewise-constant prediction surfaces, while score-based Square Attack reveals genuine vulnerability (RI \(\approx\) 0.36). These degenerate perturbations still drive substantial attribution drift: XGBoost ESI \(\approx\) 0.06–0.16 despite near-perfect ZOO robustness, versus 0.14–0.29 for RF, showing that prediction robustness and explanation stability are distinct axes requiring joint measurement. A two-axis framework (gradient dependence, query efficiency) explains the observed attack ranking and yields practical guidance for tree ensemble evaluation. A step-size ablation explains a counterintuitive PGD anomaly on z-score normalised tabular data. Code and results are publicly available [1].
1 Introduction↩︎
Machine learning classifiers are widely deployed in cybersecurity pipelines for phishing URL detection, network intrusion detection, and IoT anomaly detection, where both accurate predictions and trustworthy explanations are required for operational use. Adversarial attacks, which apply small deliberate perturbations to inputs to cause misclassification, pose a dual threat: they degrade prediction accuracy and simultaneously destabilise the SHAP-based explanations that security analysts rely on to understand model decisions.
Prior work on adversarial robustness has focused almost exclusively on image classifiers and gradient-based attacks [2], [3], with limited attention to the structured tabular data characteristic of network security [4], [5]. A further gap is that most studies evaluate a single model family—typically deep neural networks—and a single attack class, providing an incomplete picture of cross-model robustness. Our conference paper [6] addressed the tabular-data gap for MLP classifiers, introducing the Robustness Index (RI) and characterising SHAP attribution drift under FGSM and PGD. Reviewer feedback on that work called for tree-based classifiers, additional attack methods, and a rigorous explanation of the PGD \(<\) FGSM anomaly observed in the results.
This extended study addresses all three requests and adds further contributions. Specifically, we make the following new contributions beyond [6]:
Tree ensemble evaluation. RF and XGBoost are evaluated alongside the MLP, representing the model family widely deployed in production cybersecurity systems [7].
Black-box attack framework. Three black-box attacks—ZOO, Square Attack, and HopSkipJump—are implemented and evaluated, enabling attack of non-differentiable tree models.
Explainability Stability Index (ESI). A new scalar metric computed from TreeSHAP drift, reported on the same \([0,1]\) scale as RI.
Third and fourth datasets. NF-ToN-IoT (IoT NetFlow intrusion detection) and HIKARI-2021 [8] (encrypted TLS/HTTPS traffic) are added as two new evaluation domains, providing cross-domain validation.
ZOO degeneracy finding. ZOO produces near-degenerate results on XGBoost (RI \(\approx\) 0.98–0.99) due to its piecewise-constant prediction surface, while Square Attack reveals genuine vulnerability (RI \(\approx\) 0.36), exposing a methodological risk in attack-method selection.
PGD step-size ablation. A controlled ablation confirms the PGD \(<\) FGSM anomaly is a hyperparameter sensitivity artifact on z-score normalised tabular data.
Feature-level attribution drift. Per-feature TreeSHAP drift heatmaps show which feature types drive explanation instability and why XGBoost’s additive boosting structure produces higher drift than Random Forest averaging.
Attack-method selection guidance. A two-axis framework (gradient dependence, query efficiency) explains the observed attack ranking and yields practical recommendations for tree ensemble evaluation.
The remainder of this paper is structured as follows. 2 reviews related work. 3 defines the threat model and metrics (RI, ESI). 4 describes the five attack methods. 5 details the experimental setup. 6 summarises the base MLP study from [6]. 7 presents the tree model extension. 8 covers the NF-ToN-IoT dataset. 9 presents HIKARI-2021 as cross-domain validation. 10 presents the PGD ablation. 11 discusses attack realism, ESI implications, and attack-method selection guidance (11.3). 12 discusses limitations and directions for future work. 13 concludes.
2 Related Work↩︎
2.0.0.1 Adversarial robustness.
The vulnerability of neural classifiers to small, deliberately crafted input perturbations was first characterised through the fast gradient sign method (FGSM) [2] and later strengthened into the projected gradient descent (PGD) attack, which Madry et al. [3] framed as a saddle-point optimisation underpinning adversarial training. The Carlini–Wagner formulation [9] demonstrated that many early defences offered only superficial robustness, and theoretical analyses related vulnerability to the geometry of decision boundaries and to the curvature of the loss surface [10]. More recently, AutoAttack [11] combined parameter-free white- and black-box attacks into a standardised ensemble for reliable robustness evaluation, exposing inflated robustness claims across the literature. Cohen et al. [12] introduced randomised smoothing for certified probabilistic robustness guarantees. A persistent limitation of this body of work is its concentration on image classification, where \(\ell_p\) perturbation budgets correspond to perceptually meaningful constraints; the transfer of these assumptions to tabular and structured security data is rarely examined.
2.0.0.2 Black-box attacks.
When gradients are unavailable, as is the case for tree ensembles, attacks must operate through queries to the model. ZOO [13] estimates gradients via finite differences, Square Attack [14] performs query-efficient random search within an \(\ell_\infty\) ball, and HopSkipJump [15] relies only on the model’s hard-label decisions. These methods differ sharply in query budget and in the perturbation structure they induce, which motivates evaluating them jointly rather than relying on a single attack.
2.0.0.3 Adversarial attacks in cybersecurity.
Evasion attacks against machine-learning detectors were studied early by Biggio et al. [16] and elaborated for malware and intrusion detection [4], [17]. Yang et al. [5] studied defence strategies for cybersecurity DNNs. Apruzzese et al. [7] argue that much of this literature adopts threat models imported from computer vision that are unrealistic for network security, where an attacker faces strict feature-validity and protocol constraints. This critique motivates our focus on feature realism and multiple attack families.
2.0.0.4 Explainability and its stability.
Post-hoc attribution methods such as SHAP [18], its tree-specialised variant TreeSHAP [19], and LIME [20] are now standard for interpreting security classifiers, yet their reliability under perturbation is contested. Slack et al. [21] showed that SHAP and LIME explanations can be deliberately manipulated. Evaluation frameworks such as OpenXAI [22] formalise relative input and output stability (RIS/ROS), but these quantify the faithfulness and local Lipschitz behaviour of explanations rather than their behaviour under an adversary. Alvarez-Melis and Jaakkola [23] introduced sensitivity and infidelity measures that probe explanation stability against random or local input changes. Warnecke et al. [24] evaluated SHAP, LIME, and gradient-based attribution methods specifically for security classifiers, finding that explanation quality—measured by faithfulness criteria such as completeness and correctness—varies substantially across explanation methods and model types. ESI differs: it measures attribution drift under adversarial perturbations of increasing magnitude, tying explanation stability to the same threat model as RI rather than to generic noise or model-internal faithfulness.
2.0.0.5 Tree ensemble robustness.
Despite the wide use of random forests and gradient-boosted trees in operational security pipelines [7], robustness research remains overwhelmingly focused on neural networks. Certified-robustness work [12] and robust training objectives [5], [25] target differentiable models, and the comparatively few studies of tree-ensemble robustness rarely evaluate black-box attacks across multiple security datasets or pair robustness with explanation stability. Our extension addresses this gap by systematically attacking RF and XGBoost across four datasets and jointly reporting RI and ESI.
3 Problem Formulation and Metrics↩︎
3.1 Threat Model↩︎
We consider an attacker with access to a trained classifier \(f: \mathcal{X} \rightarrow \mathcal{Y}\) who seeks to cause misclassification by adding a perturbation \(\delta\) bounded in the \(L_\infty\) norm: \(\|\delta\|_\infty \leq \varepsilon\). For white-box attacks (FGSM, PGD), the attacker has access to model gradients. For black-box attacks (ZOO, Square Attack, HopSkipJump), the attacker has access only to model predictions or prediction probabilities. We focus on evasion attacks at inference time; poisoning and model-extraction attacks are out of scope.
3.2 Robustness Index (RI)↩︎
The Robustness Index, introduced in [6], summarises accuracy degradation over the perturbation budget \(\varepsilon\) as a single scalar:
\[\mathrm{RI} = \frac{1}{\varepsilon_{\max}} \int_0^{\varepsilon_{\max}} \mathrm{Acc}(\varepsilon)\, d\varepsilon \label{eq:ri}\tag{1}\]
where \(\mathrm{Acc}(\varepsilon)\) is the classifier accuracy under attack at perturbation budget \(\varepsilon\). RI lies in \([0, 1]\); higher values indicate greater robustness. In practice the integral is approximated via the trapezoidal rule over a grid of \(\varepsilon\) values.
3.3 Explainability Stability Index (ESI)↩︎
We introduce ESI as the explanation-domain analogue of RI. Let \(\phi_i(\mathbf{x})\) denote the SHAP attribution of feature \(i\) for input \(\mathbf{x}\). The per-feature attribution drift at perturbation budget \(\varepsilon\) is:
\[\Delta\Phi_i(\varepsilon) = \mathbb{E}\!\left[\,\left|\phi_i(\mathbf{x}_{\mathrm{adv}}) - \phi_i(\mathbf{x})\right|\,\right] \label{eq:drift}\tag{2}\]
where the expectation is over the test set and \(\mathbf{x}_{\mathrm{adv}}\) is the adversarial example at budget \(\varepsilon\). The mean drift across all features is \(\bar{D}(\varepsilon) = \frac{1}{d}\sum_i \Delta\Phi_i(\varepsilon)\). ESI is then:
\[\mathrm{ESI} = 1 - \frac{1}{\varepsilon_{\max}} \int_0^{\varepsilon_{\max}} \frac{\bar{D}(\varepsilon)}{\bar{D}(\varepsilon_{\max})}\, d\varepsilon \label{eq:esi}\tag{3}\]
Normalising by \(\bar{D}(\varepsilon_{\max})\) maps ESI to \([0,1]\) when drift is monotonically non-decreasing in \(\varepsilon\)—an assumption we verify empirically (drift heatmaps in [fig:shap-heatmap-phish,fig:treeshap-rf-phish] show consistently non-decreasing mean drift). Under this assumption ESI = 1 when inputs are unperturbed and approaches 0 when drift saturates at all budgets. Note that ESI is a relative measure: it captures the shape of the drift trajectory normalised to its own endpoint, not absolute drift magnitude. Two models with very different absolute drift can share a similar ESI if their drift curves have the same shape, so ESI is best interpreted as a within-model stability profile across \(\varepsilon\) rather than a cross-model magnitude comparison.
For tree models, SHAP values are computed via the interventional-expectation variant of TreeSHAP [19], which gives exact Shapley values under the interventional conditional; for the MLP, KernelSHAP is used. Because TreeSHAP operates in log-odds units for XGBoost classifiers and in probability units for Random Forest, raw drift values \(\Delta\Phi_i\) are not directly comparable across the two tree families; ESI mitigates this by normalising each model’s drift by its own maximum, but the caveat applies equally here. Cross-model ESI comparisons (MLP vs.trees) should be treated as indicative rather than precise.
4 Attack Methods↩︎
4.0.0.1 FGSM.
The Fast Gradient Sign Method [2] computes a single-step perturbation in the direction of the loss gradient: \(\mathbf{x}_{\mathrm{adv}} = \mathbf{x} + \varepsilon\,\mathrm{sign} (\nabla_\mathbf{x}\mathcal{L}(f(\mathbf{x}), y))\).
4.0.0.2 PGD.
Projected Gradient Descent [3] iterates FGSM with step size \(\alpha\) and projects back to the \(L_\infty\) ball after each step. We use 10 steps with \(\alpha=0.01\) (default) and vary \(\alpha\) in the ablation of 10.
4.0.0.3 ZOO.
ZOO [13] approximates the gradient via forward finite differences: \(\hat{g}_j = (\mathcal{L}(\mathbf{x} + \delta_j \mathbf{e}_j, y) - \mathcal{L}(\mathbf{x}, y)) / \delta_j\), then applies a coordinate-wise sign step to form the perturbation direction. It requires only black-box loss access. On piecewise-constant XGBoost surfaces the finite-difference estimates are near-zero within leaves regardless of perturbation direction, reducing the signed update to effectively random noise—this is the mechanism behind the observed degeneracy.
4.0.0.4 Square Attack.
Square Attack [14] is a score-based method that applies random square-shaped perturbations, accepting updates that increase the adversarial loss. We use 150 queries with initial perturbation probability \(p_{\mathrm{init}} = 0.5\).
4.0.0.5 HopSkipJump.
HopSkipJump [15] is a decision-based attack requiring only predicted class labels. It alternates between a binary search to find the decision boundary and a gradient estimation step via Monte Carlo sampling. We use 8 iterations with 20 gradient samples.
5 Experimental Setup↩︎
5.0.0.1 Datasets.
Four tabular cybersecurity datasets are used. Phishing URL [26]: 10,000 samples, 48 binary/ternary URL-structure features,
balanced classes. UNSW-NB15 [27]: we use the official UNSW_NB15_training-set.csv partition (82,332 records), which
contains 45 columns; we drop attack_cat (multi-class label not used) and encode the three string-typed fields (proto, service, state) with LabelEncoder, yielding 43 numeric features and a
binary label target. The full UNSW-NB15 corpus comprises 175,341 records across all partitions; we use only the training partition and apply an 80/20 train/test split. NF-ToN-IoT [28]: 1,157,994 NetFlow v2 records, 10 features; we sample 20,000 benign and 20,000 attack flows using stratified batch streaming to avoid loading the full
file into memory. HIKARI-2021 [8]: 555,278 bidirectional network flows (517,582 benign, 37,696 attack) capturing TLS/HTTPS
encrypted traffic. The dataset contains 88 columns; we drop network identifiers (uid, originh, responh), IP/MAC address columns, timestamps, and traffic_category (a multi-class label), yielding 83 numeric
features and a binary Label target. We sample 10,000 benign and 10,000 attack flows for balanced evaluation. All features are z-score normalised using training-set statistics.
5.0.0.2 Models.
We evaluate three classifiers: an MLP with two hidden layers (64, 32 units, ReLU, Adam, 20 epochs), a Random Forest, and XGBoost (learning rate 0.05). Tree model depth and capacity are tuned per dataset: on Phishing and UNSW-NB15, RF uses 200 trees at
max depth 12 and XGBoost uses 200 trees at max depth 6 with subsample and column-subsample rates of 0.8; on NF-ToN-IoT and HIKARI-2021, RF uses 100 trees at max depth 8 and XGBoost uses 100 trees at max depth 5 without subsampling. All models use fixed
random seeds for reproducibility. SHAP attributions for tree models use TreeSHAP [19] (interventional variant; see 3). For the MLP, KernelSHAP is used with a background dataset of 100 training samples and nsamples = 200 integration samples per explanation. The MLP is not evaluated on NF-ToN-IoT or HIKARI-2021; the
gradient-based white-box attacks (FGSM, PGD) require the full test set for reliable RI estimation, and the larger test splits combined with CPU-only evaluation made this computationally infeasible within our budget. Black-box attacks (ZOO, Square,
HopSkipJump) are applied only to the tree models and not to the MLP, because the MLP supports exact gradient computation, making white-box attacks strictly stronger and the relevant comparison for neural networks; black-box attacks on a model whose
gradients are accessible would be an artificially restricted threat model.
5.0.0.3 Attack evaluation protocol.
We use \(\varepsilon_{\max} = 0.30\). On z-score normalised features (mean 0, std 1), this corresponds to a maximum perturbation of 0.3 standard deviations per feature—large enough to stress-test classifier boundaries and expose RI differences between attack methods, yet small enough that most features remain within one standard deviation of their clean values. The accuracy curves in 6 show that Square Attack accuracy has largely plateaued by \(\varepsilon = 0.30\); extending to larger budgets would not materially change the RI ranking. Note that RI values are comparable only at the same \(\varepsilon_{\max}\); comparisons with studies using different budgets require re-normalisation. Perturbation budgets \(\varepsilon \in \{0, 0.033, 0.067, \ldots, 0.30\}\) (10 values). FGSM and PGD are applied to the MLP on the full test set. Black-box attacks (ZOO, Square Attack, HopSkipJump) are applied to RF and XGBoost on a stratified subsample of 300 test examples (120 for HopSkipJump, which is query-intensive). Per-sample query budgets: ZOO evaluates \(d+1\) finite-difference calls per coordinate descent step with 20 steps (i.e.\(20(d+1)\) loss queries per \(\varepsilon\) value, where \(d\) is the feature count); Square Attack uses 150 total queries; HopSkipJump uses 8 binary-search iterations with 20 gradient samples each. These budgets are not query-matched across methods; ZOO’s weaker performance on XGBoost should therefore be compared against the budget-matched interpretation in 12. ESI is computed on a separate stratified 256-sample subset drawn from the same test split; the RI and ESI evaluation subsets are distinct but drawn from the same held-out data. All RI and ESI values are single-run point estimates under fixed random seeds. We do not report confidence intervals across seeds; see 12 for discussion of this limitation.
6 Base Study: MLP under White-Box Attacks↩︎
Our prior conference work [6] established the baseline of this study: a multilayer perceptron (MLP) trained on the Phishing URL and UNSW-NB15 datasets and subjected to white-box FGSM and PGD attacks. The MLP attains a clean accuracy of \(0.857\) on Phishing and \(0.774\) on UNSW-NB15. Under attack its robustness degrades substantially, with FGSM proving more damaging than PGD at matched maximum perturbation: \(\mathrm{RI}_{\mathrm{FGSM}}=0.610\) versus \(\mathrm{RI}_{\mathrm{PGD}}=0.725\) on Phishing, and \(\mathrm{RI}_{\mathrm{FGSM}}=0.692\) versus \(\mathrm{RI}_{\mathrm{PGD}}=0.733\) on UNSW-NB15. The single-step FGSM, by saturating every feature to the perturbation boundary, induces larger accuracy loss than iterative PGD at the same budget—an effect we examine in the ablation of 10.
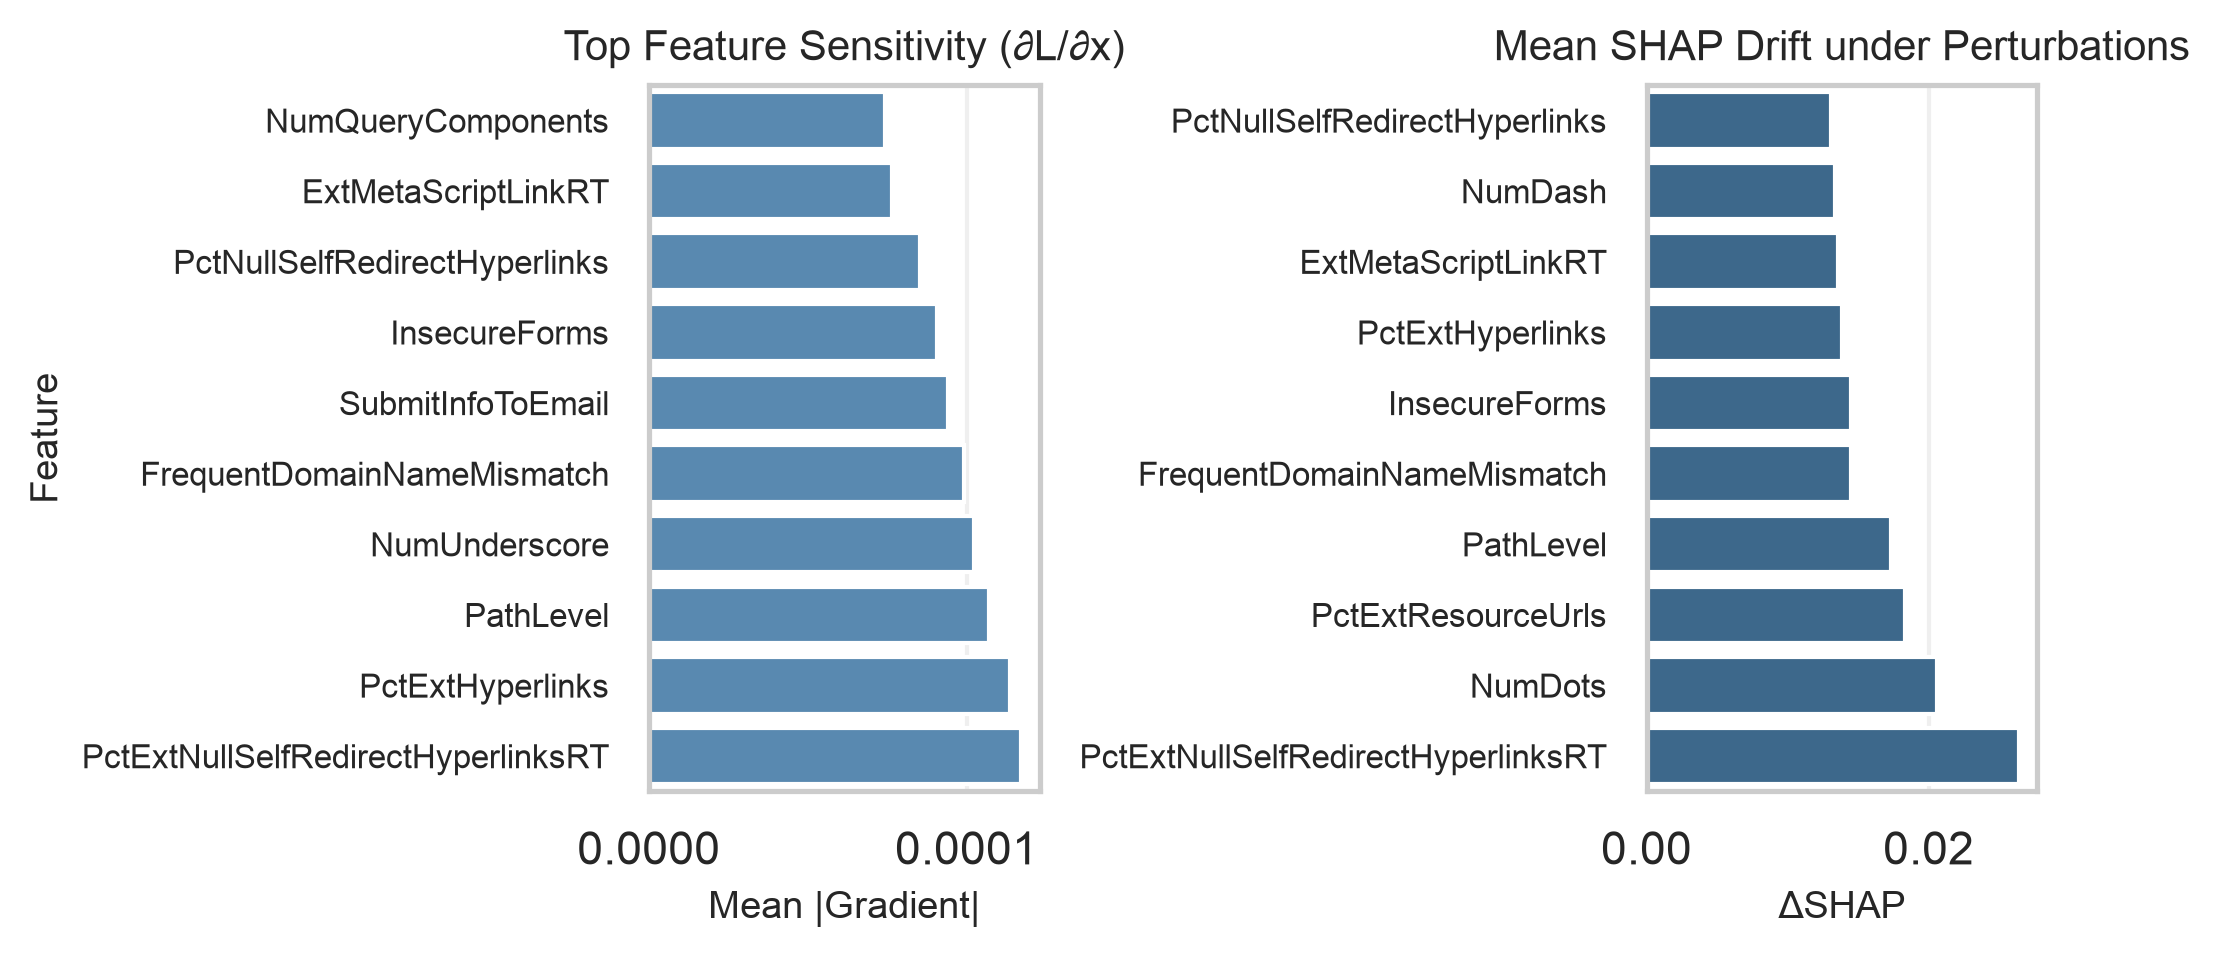
Because the MLP is differentiable, we can directly couple its gradient sensitivity to its explanation drift. 1 contrasts, on a per-feature basis, the input-gradient magnitude (left) with the measured SHAP drift under perturbation (right) for the Phishing classifier. The two panels are strongly aligned: features that the model relies on most heavily in its gradient also exhibit the largest attribution instability, indicating that the directions an attacker would exploit are precisely the directions along which explanations are least trustworthy.
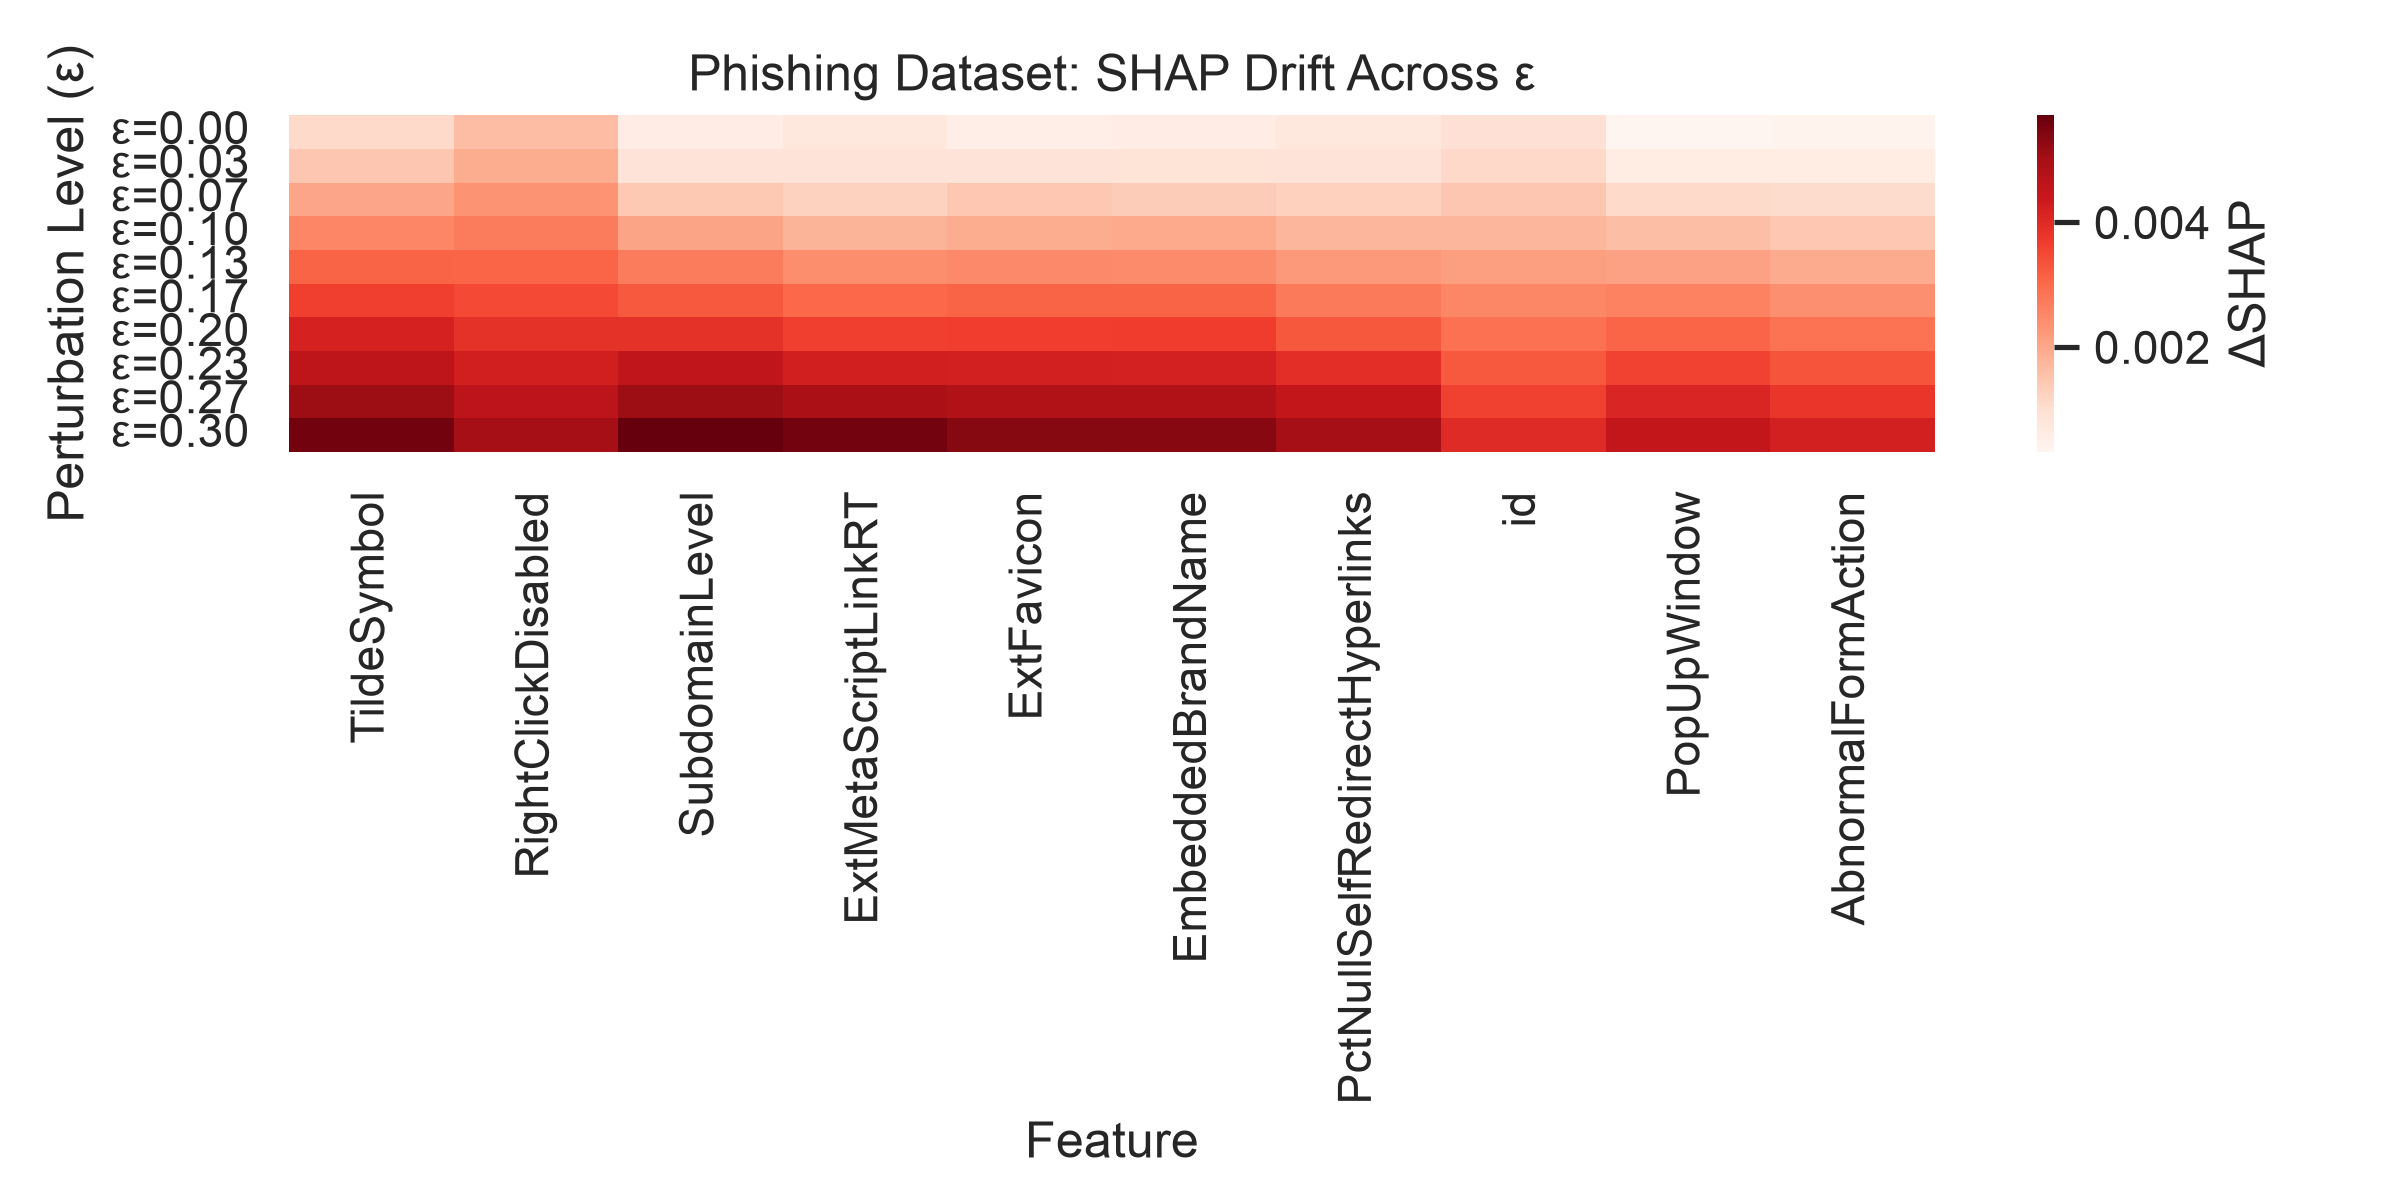
2 resolves this drift across the full perturbation range. Rows correspond to increasing attack magnitude \(\varepsilon\), columns to individual features, and colour intensity to
the normalised change in SHAP value relative to the clean input. Drift grows monotonically with \(\varepsilon\) and concentrates in a small subset of features. URL-structure features such as
PctExtNullSelfRedirectHyperlinks and UrlLengthRT show the highest drift on Phishing; on UNSW-NB15 the most drift-prone features are dttl and ct_dst_sport_ltm. Even modest perturbations can reorder the
model’s apparent reasoning while leaving its prediction nominally correct.
Adversarial training recovers part of the lost robustness. Augmenting the training set with FGSM examples (\(\varepsilon=0.05\), \(20\%\) adversarial ratio) raises RI by roughly \(0.08\)–\(0.12\) at a cost of \(2\)–\(4\%\) clean accuracy on both datasets. 3 plots the baseline and adversarially trained accuracy-vs-\(\varepsilon\) curves; the hardened model degrades more gracefully as \(\varepsilon\) increases. The same qualitative pattern holds on UNSW-NB15, where the larger and more heterogeneous feature space yields somewhat smaller robustness gains.

7 Tree Ensemble Extension: Black-Box Attacks and ESI↩︎
7.1 Results: Phishing and UNSW-NB15↩︎
Table 1 presents RI and ESI for all models, datasets, and attack methods.
| Dataset | Model | Clean | Robustness Index (RI) | ESI | ||||
|---|---|---|---|---|---|---|---|---|
| 4-7 | Acc | FGSM/ZOO\(^\dagger\) | PGD | Square | HSJ | |||
| Phishing | MLP | 0.857 | 0.610 | 0.725 | — | — | — | |
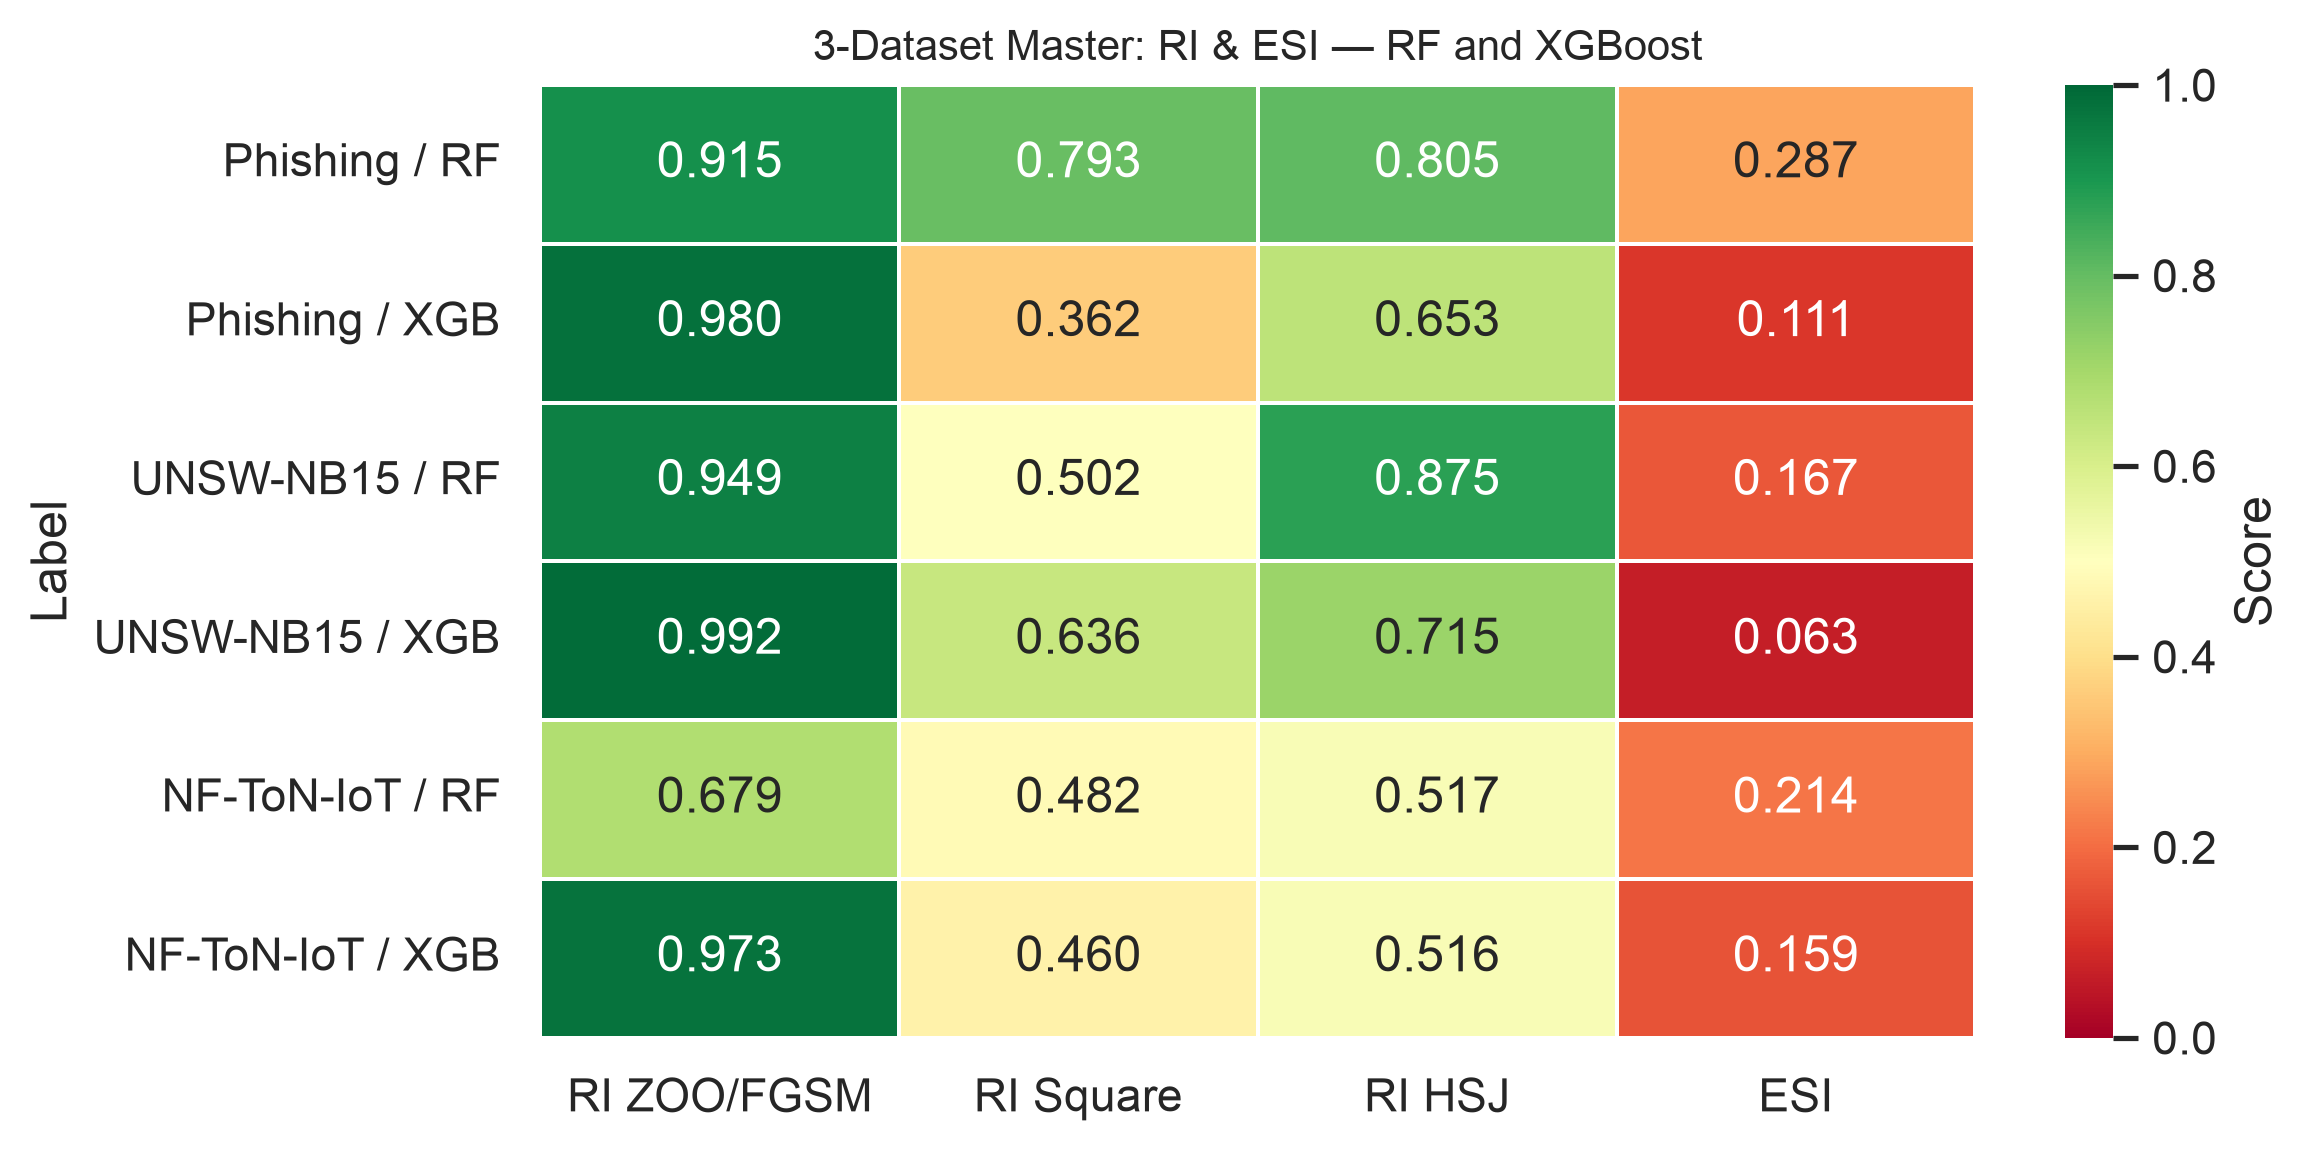
| RF | 0.977 | 0.915 | — | 0.793 | 0.805 | 0.287 | ||
| XGB | 0.981 | 0.980 | — | 0.362 | 0.653 | 0.111 | ||
| UNSW-NB15 | MLP | 0.774 | 0.692 | 0.733 | — | — | — | |
| RF | 0.964 | 0.806 | — | 0.184 | 0.844 | 0.142 | ||
| XGB | 0.974 | 0.886 | — | 0.299 | 0.806 | 0.068 | ||
| NF-ToN-IoT | MLP | — | — | — | — | — | — | |
| RF | 0.998 | 0.679 | — | 0.482 | 0.517 | 0.214 | ||
| XGB | 0.998 | 0.973 | — | 0.460 | 0.516 | 0.159 | ||
| HIKARI-2021 | RF | 0.998 | 0.654 | — | 0.492 | 0.619 | 0.140 | |
| XGB | 0.999 | 0.997 | — | 0.438 | 0.894 | 0.056 | ||
7.1.0.1 ZOO degeneracy on XGBoost.
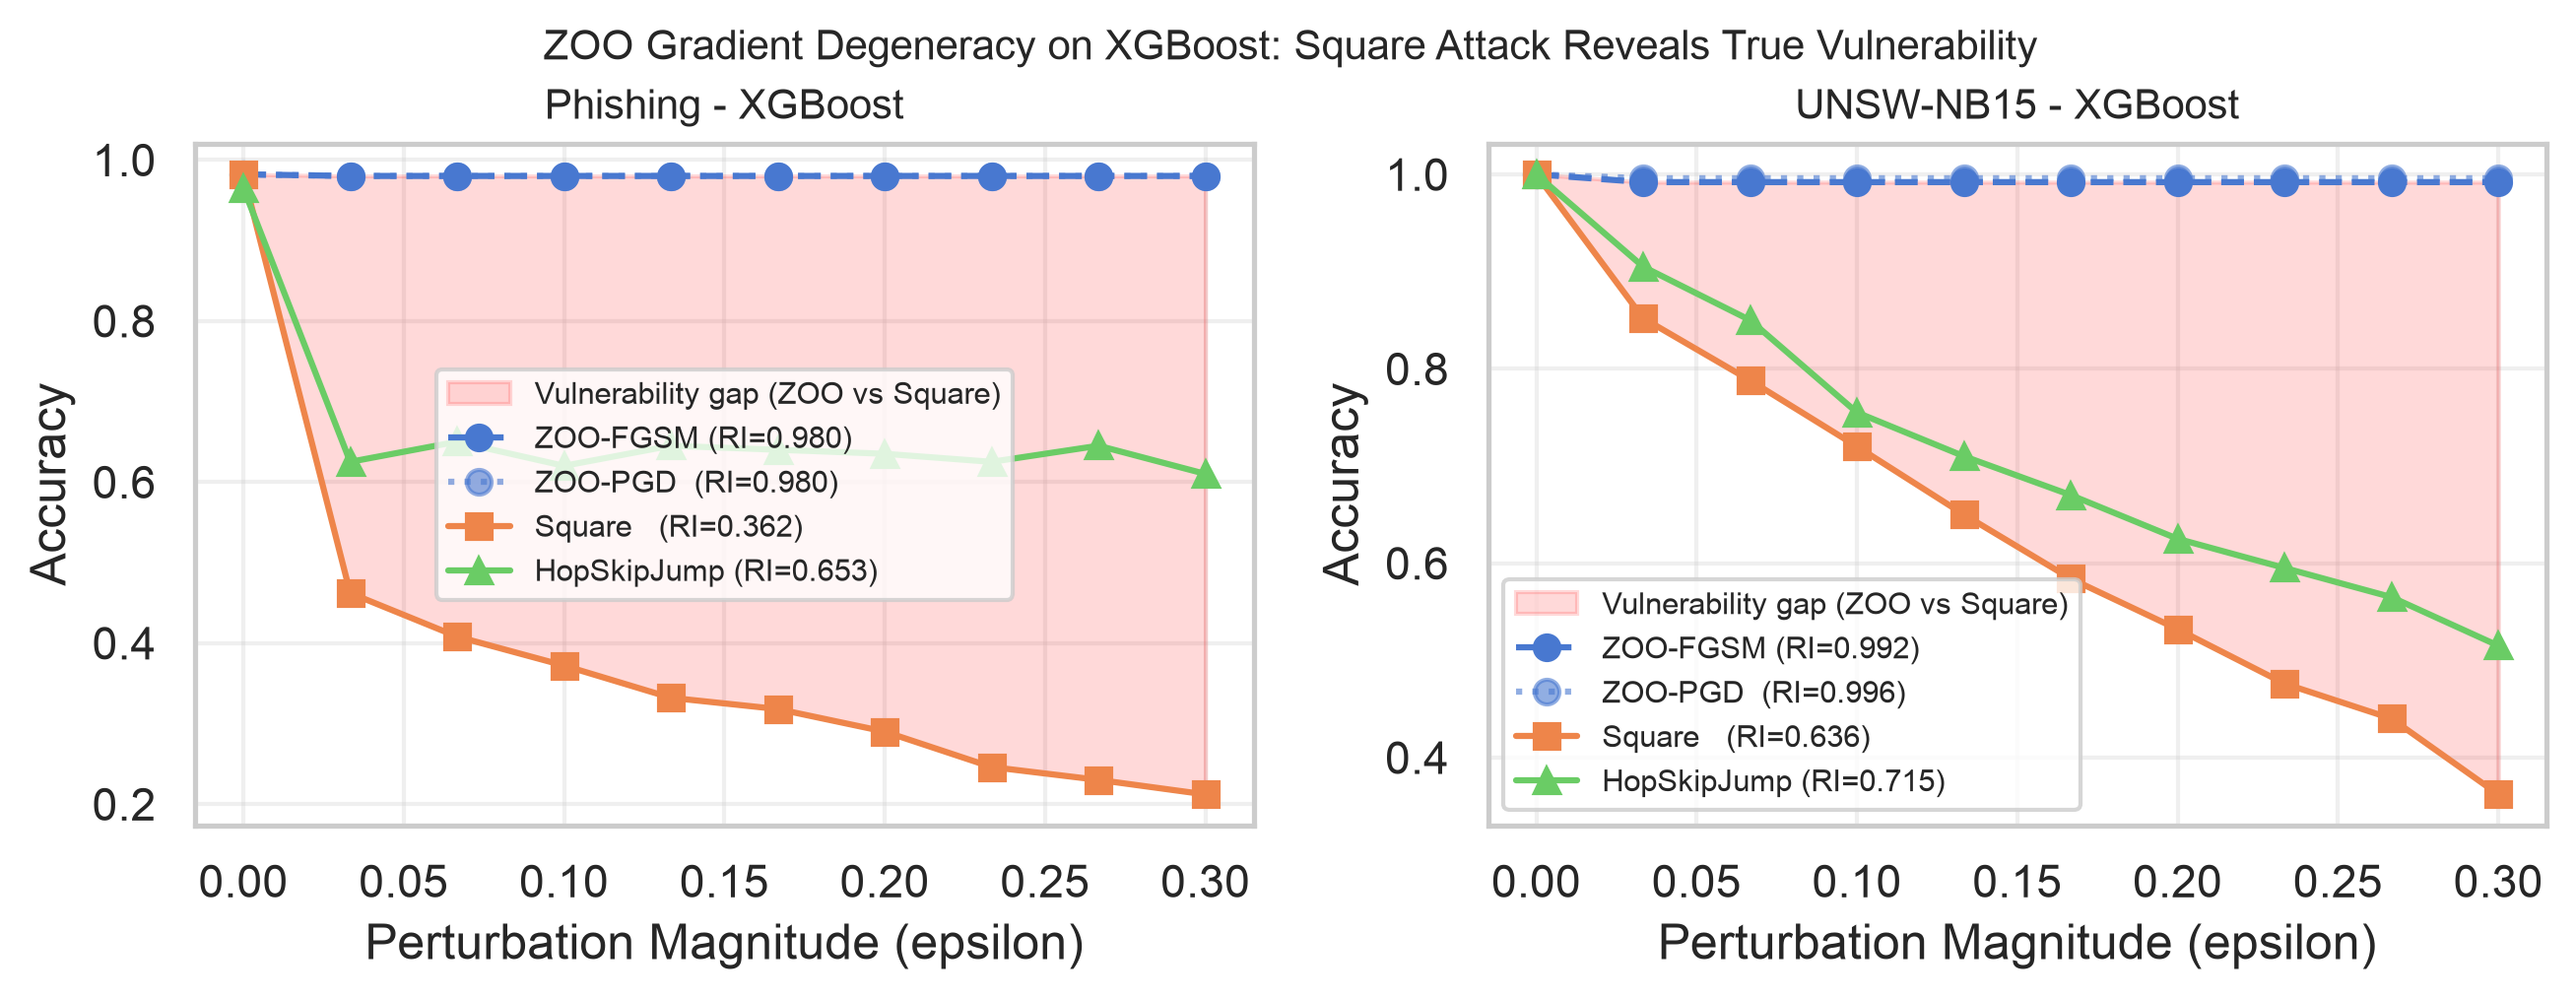
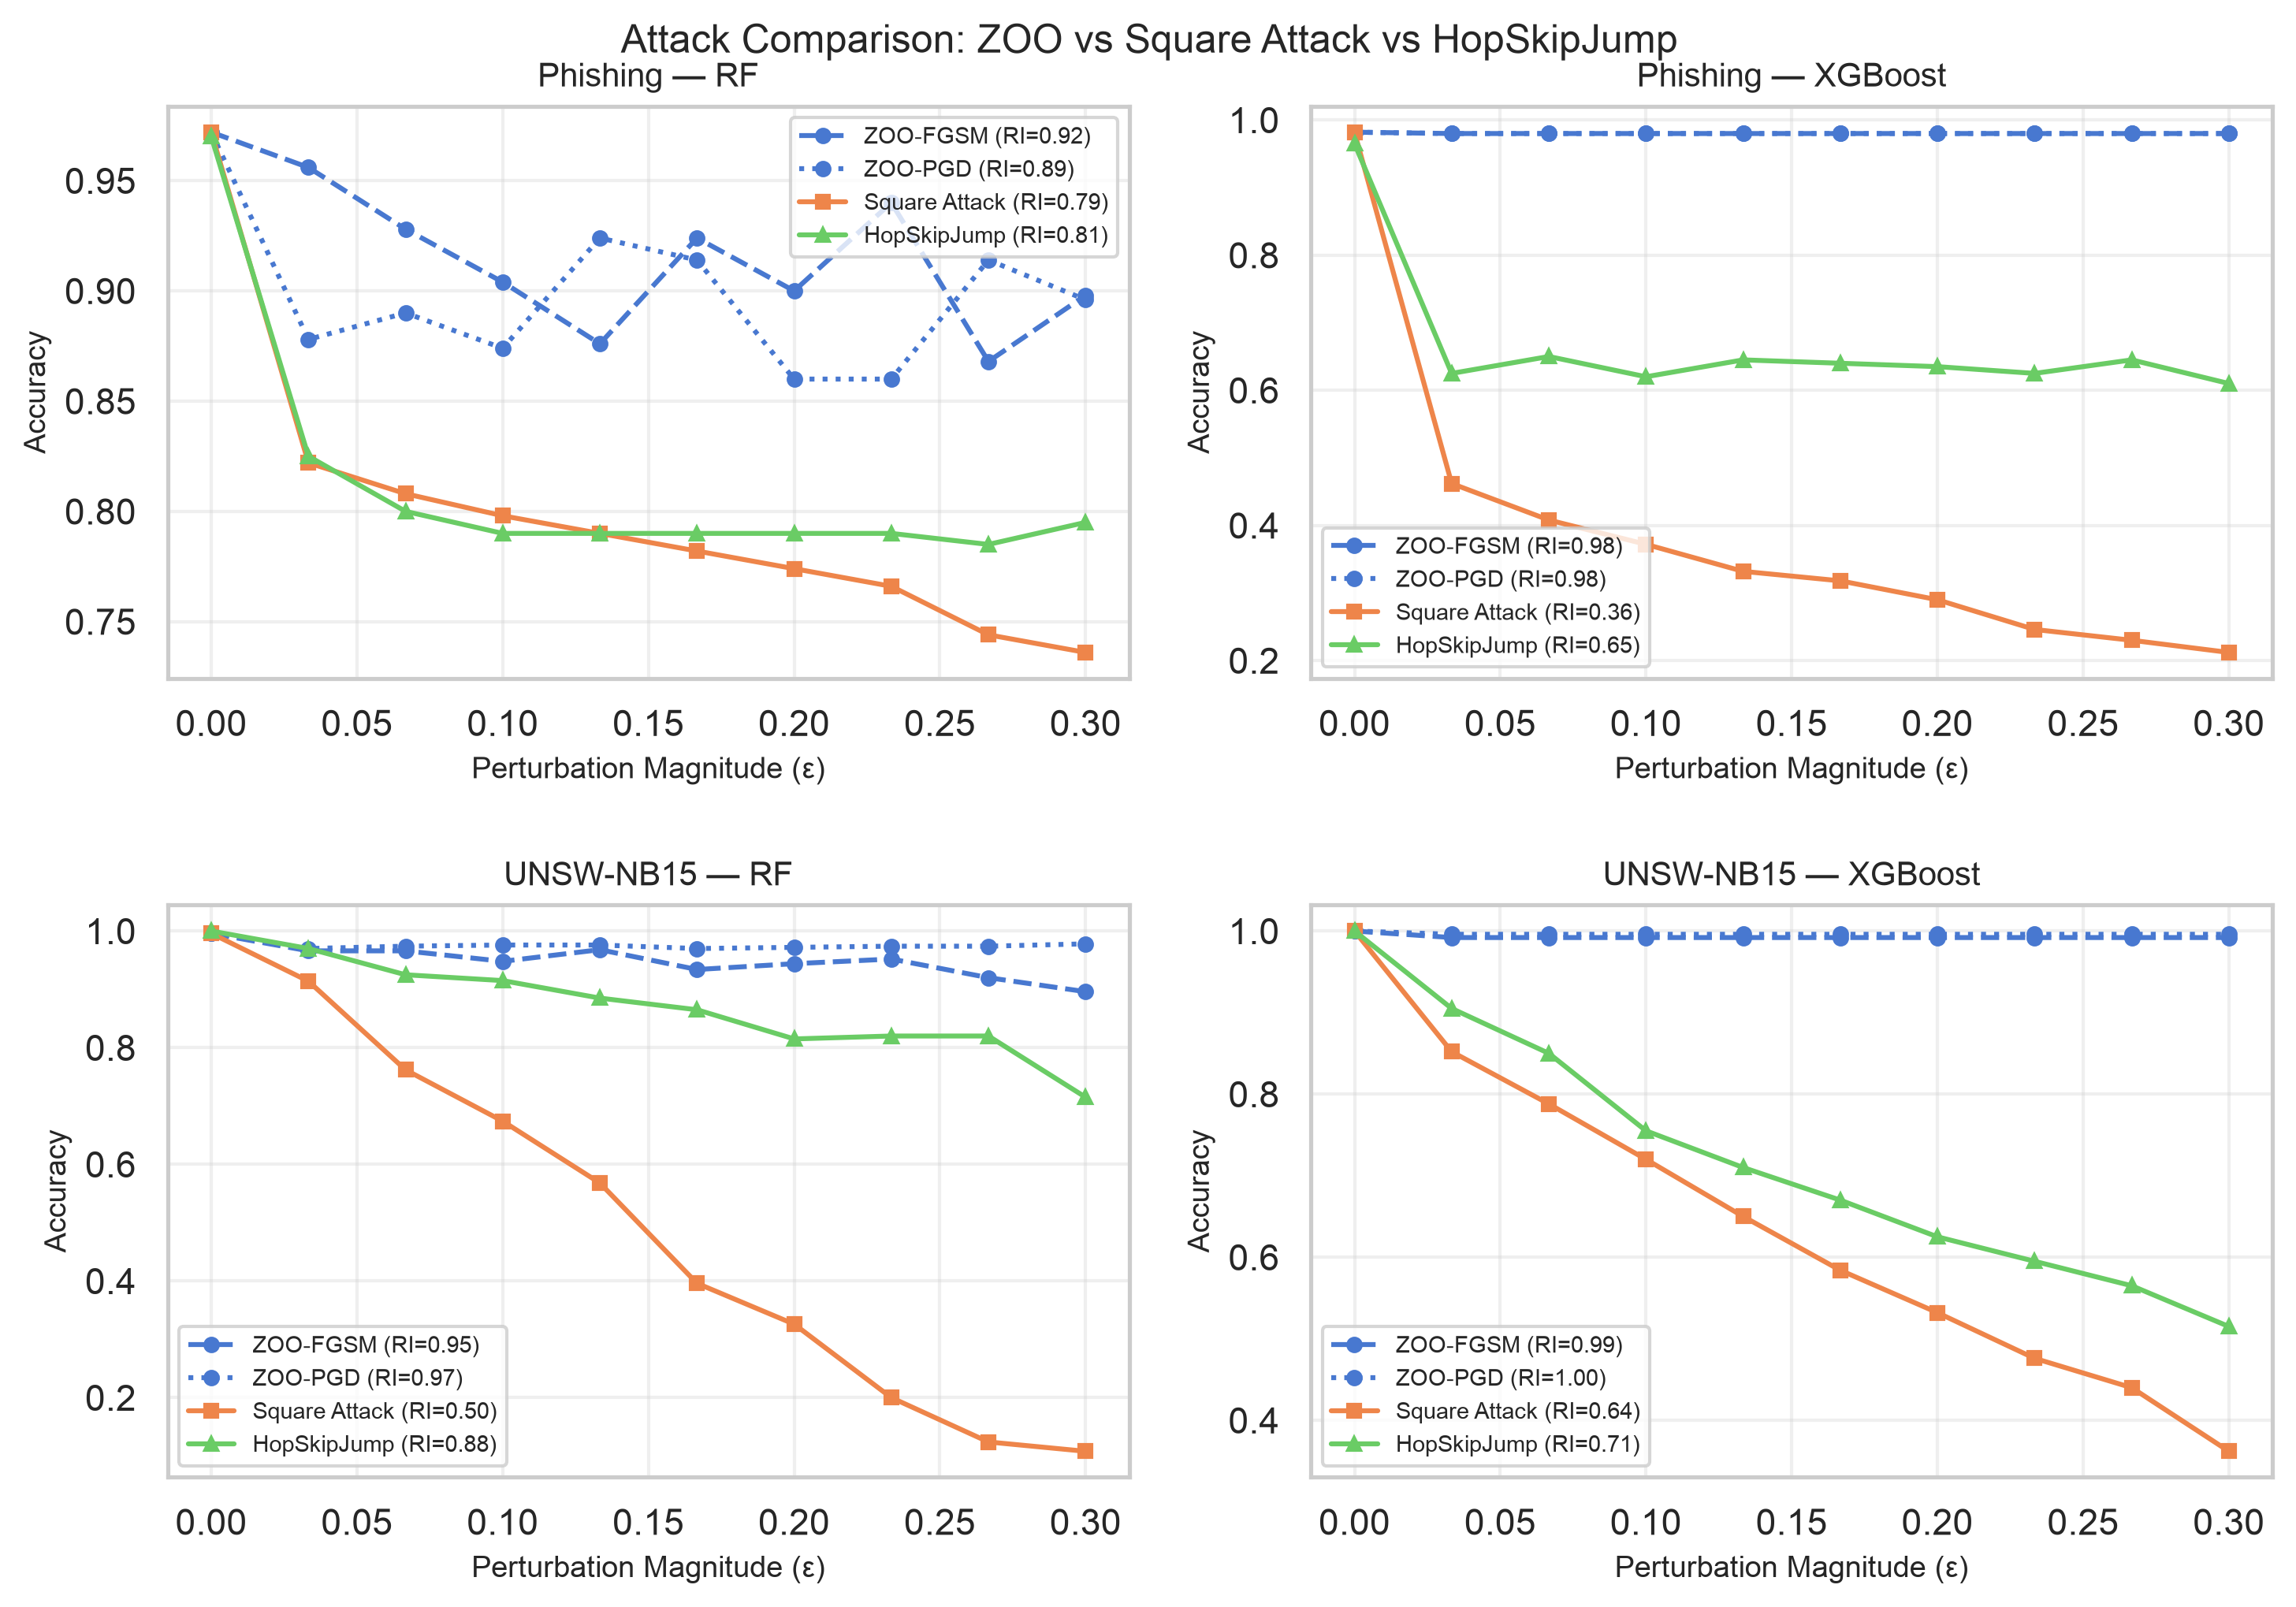
ZOO yields RI = 0.980 (Phishing) and 0.886 (UNSW-NB15) for XGBoost—both substantially above the corresponding Square Attack values (0.362 and 0.299). On Phishing, ZOO RI virtually matches clean accuracy (\(0.981\)), indicating near-complete degeneracy: XGBoost’s piecewise-constant prediction surface causes finite-difference gradient estimates to be near-zero within tree leaves, leaving the perturbation direction essentially random (5). On UNSW-NB15 there is genuine ZOO degradation (\(0.974 \to 0.886\)), yet the ZOO–Square gap of \(0.587\) confirms systematic underestimation of vulnerability. The degeneracy does not fully occur for Random Forest, whose ensemble averaging produces smoother boundaries; ZOO achieves RI = 0.915 (Phishing) and 0.806 (UNSW-NB15) against RF.
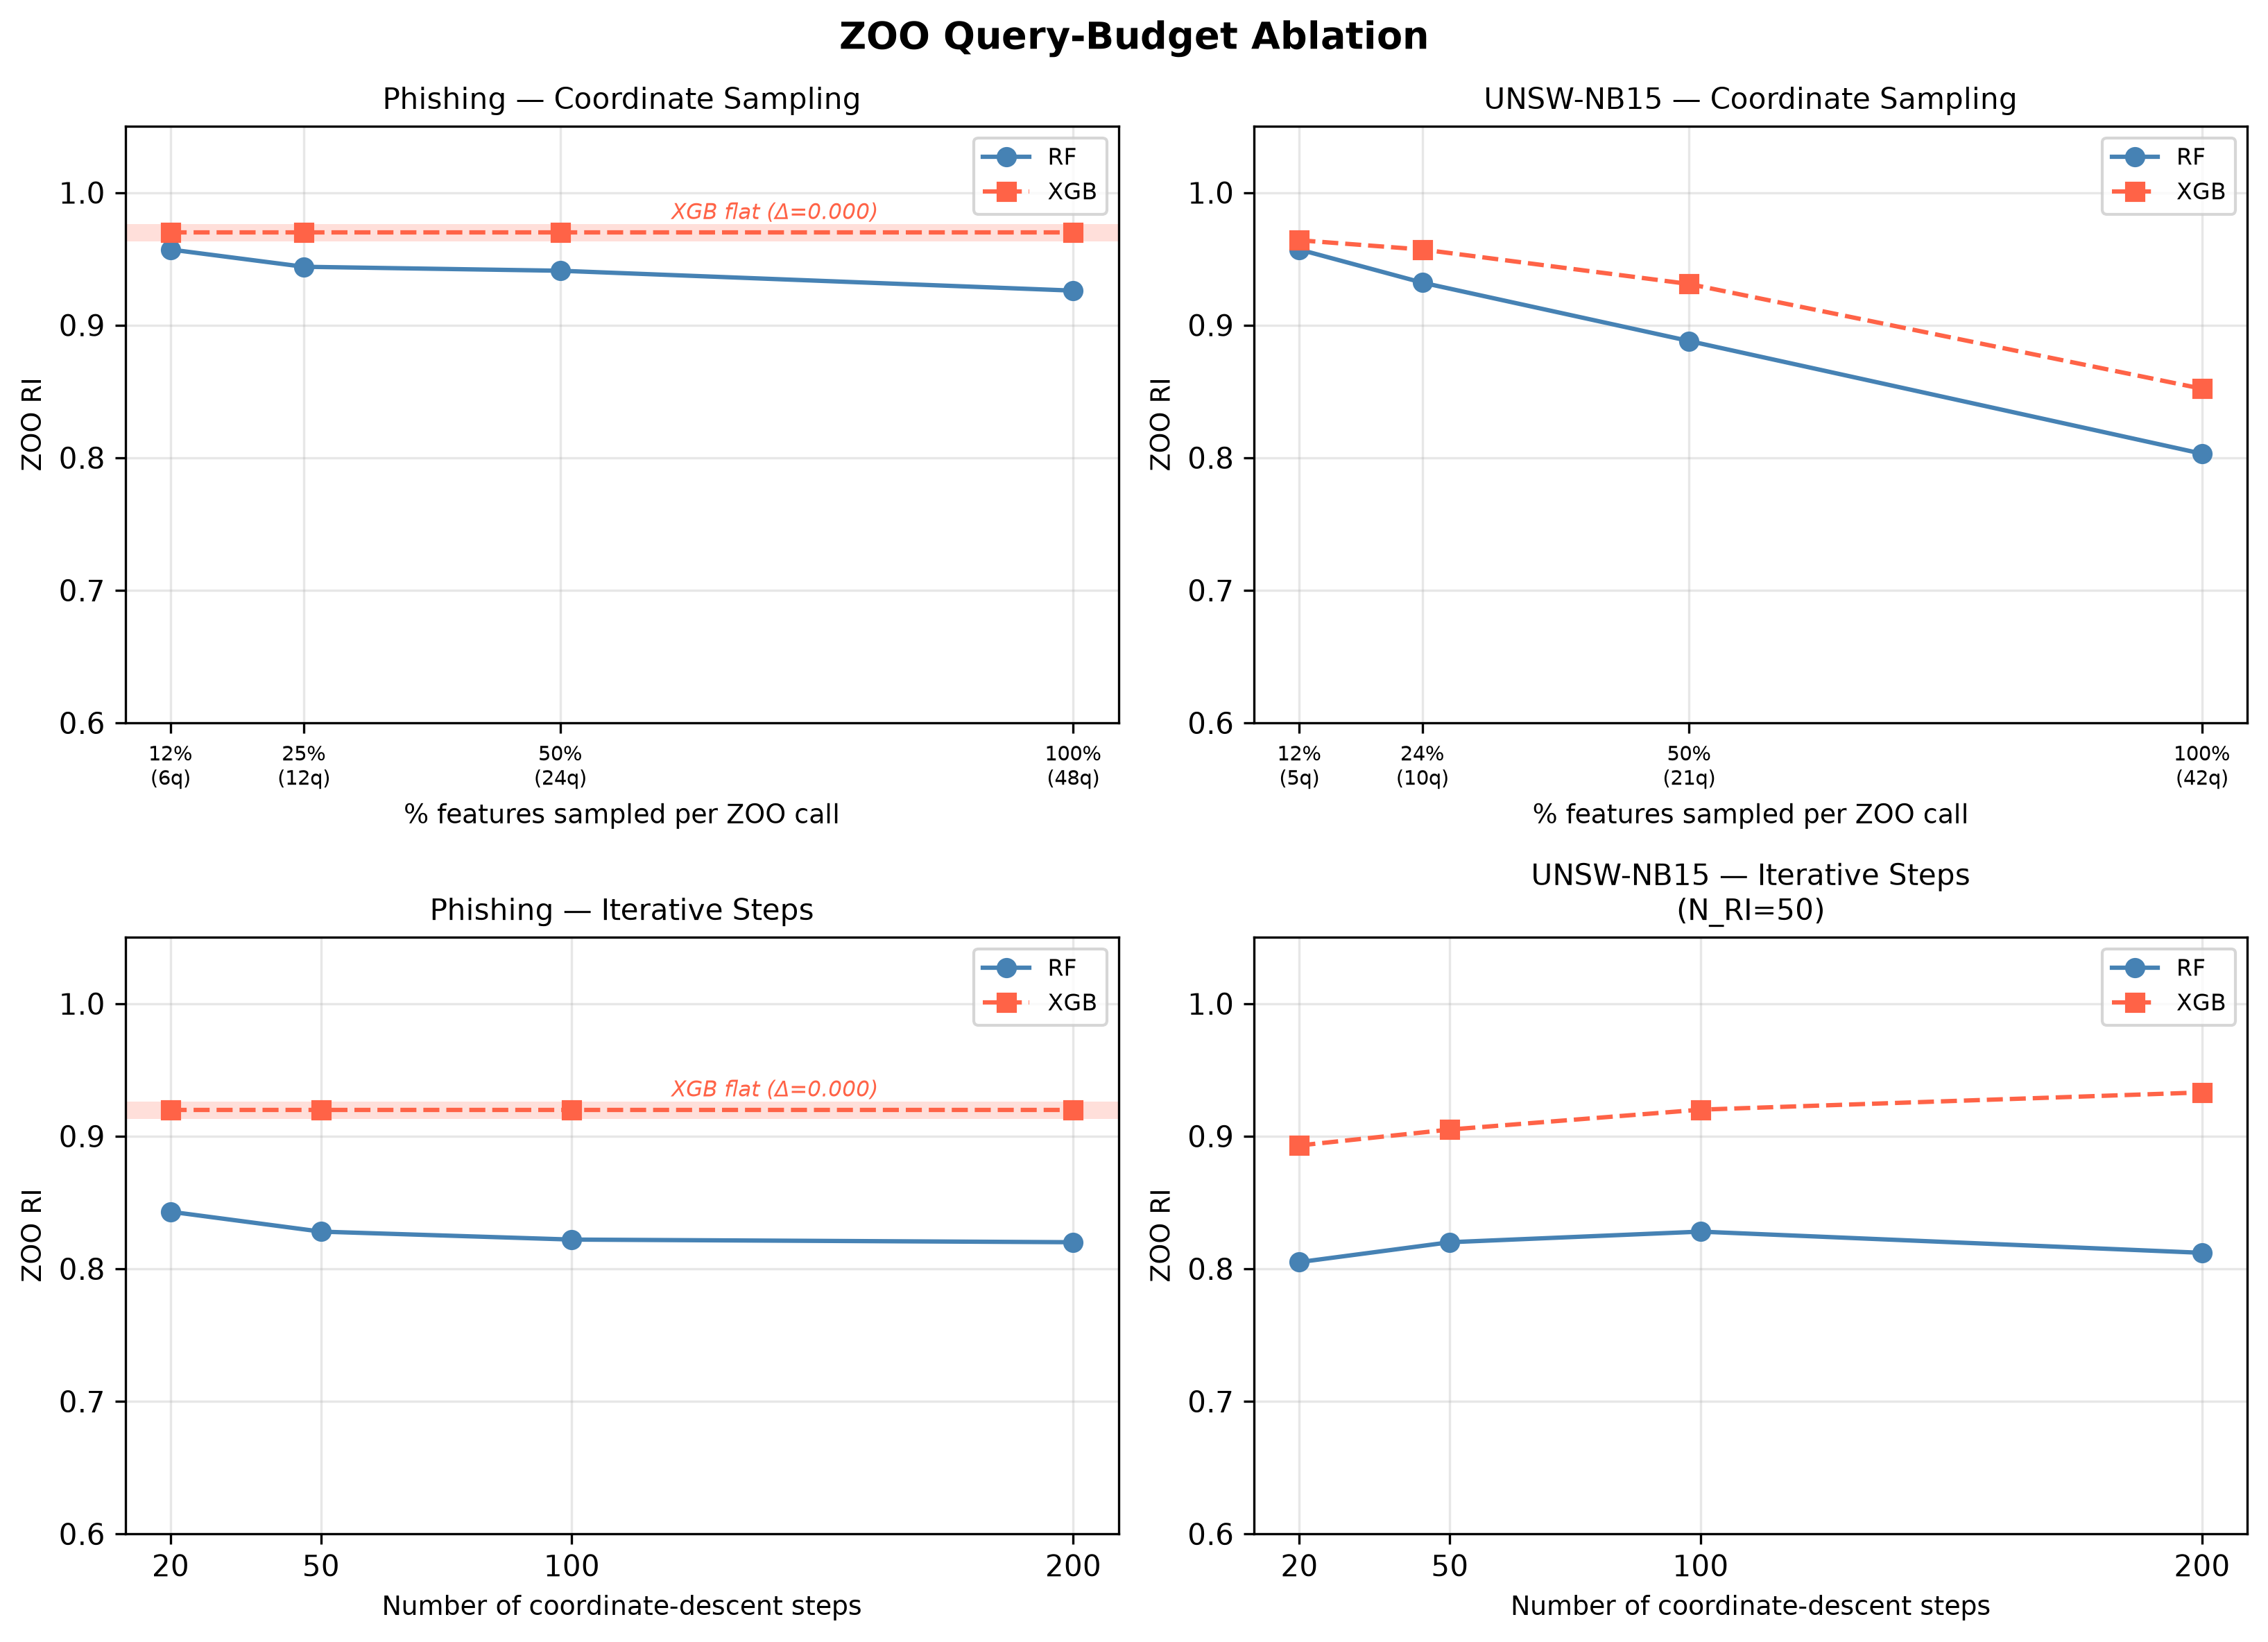
7.1.0.2 ZOO budget ablation.
Two ablations test whether degeneracy is a budget artefact or intrinsic to the piecewise-constant surface (4). Coordinate-sampling: ZOO is given 12%, 25%, 50%, and 100% of features per call (6–48 queries on Phishing; 5–42 on UNSW-NB15). Iterative-step: the full feature gradient is re-estimated after each sign step, for 20, 50, 100, and 200 steps. On Phishing, XGBoost RI remains flat at \(0.970\) across the full coordinate-sampling range (\(\Delta = 0.000\)) and at \(0.920\) across all iterative-step counts (\(\Delta = 0.000\)). RF RI decreases monotonically in both ablations (coordinate: \(0.957 \to 0.926\); iterative: \(0.843 \to 0.820\)), confirming ZOO strengthens on smoother surfaces given more queries. On UNSW-NB15, XGBoost shows a modest decline under coordinate sampling (\(0.964 \to 0.852\)) consistent with partial degeneracy—some features cross leaf boundaries here—but the gap above Square Attack RI (\(0.299\)) is \(0.553\), and no systematic decline appears under iterative refinement. XGBoost ZOO degeneracy is therefore intrinsic to the piecewise-constant prediction surface: quadrupling the query budget or \(10\times\) more iterative refinement does not recover the attack.
7.1.0.3 Square Attack reveals true vulnerability.
Under Square Attack, XGBoost RI drops to 0.362 (Phishing) and 0.299 (UNSW-NB15), yielding ZOO–Square gaps of 0.618 and 0.587 respectively. Random Forest RI drops to 0.793 (Phishing) and 0.184 (UNSW-NB15); on UNSW-NB15 RF accuracy collapses to near zero above \(\varepsilon=0.167\)—both model families are far more vulnerable under Square Attack on this dataset than on Phishing. The UNSW-NB15 feature space, with its mix of categorical and continuous network-flow attributes, admits denser adversarial neighbourhoods that Square Attack exploits more efficiently for both models. 6 shows the accuracy–\(\varepsilon\) curves for all attack methods. This demonstrates that attack-method selection is not model-agnostic: a study using only ZOO would incorrectly conclude that XGBoost is highly robust.
7.1.0.4 HopSkipJump: boundary-based attack.
HopSkipJump (HSJ) uses only hard-label decisions and avoids finite-difference gradient estimation, so it does not suffer ZOO degeneracy. Correspondingly, HSJ RI for XGBoost drops to 0.653 (Phishing) and 0.806 (UNSW-NB15), well below ZOO’s inflated values—confirming that the ZOO failure is specific to gradient estimation rather than to query-based attacks in general. Square Attack is nevertheless stronger than HSJ on XGBoost: RI gaps of 0.29 (Phishing) and 0.51 (UNSW-NB15), because HSJ’s 8-iteration, 20-sample Monte Carlo boundary search is query-constrained in 48- and 42-dimensional feature spaces. Against RF, HSJ and Square Attack are within 0.01 on Phishing (0.805 vs.), but on UNSW-NB15 Square Attack is dramatically stronger (0.184 vs. for HSJ), suggesting that score-based random search navigates the RF decision boundary in this feature space more effectively than boundary-directed binary search at the given query budget. HSJ was evaluated on 120 samples versus 300 for other attacks due to its query cost, so RI values are not strictly comparable in magnitude across methods; the ordering claims above hold directionally but the precise gaps should be interpreted with that caveat.
7.1.0.5 Prediction robustness vs.explanation stability.
Although XGBoost’s RI under ZOO appears high (an artefact of ZOO degeneracy rather than genuine robustness), its ESI is consistently the lowest of the three models across all datasets (0.056–0.111 vs.RF’s 0.140–0.287; all values are point estimates from a single evaluation run). The same ZOO perturbations that fail to cross XGBoost’s decision boundaries still cause substantial attribution drift: an attack too weak to fool the classifier can still mislead the explanation—with direct implications for SOC analysts who rely on SHAP attributions to triage alerts. 7 visualises RI and ESI side-by-side across all conditions; note that the ZOO RI column for XGBoost reflects the degeneracy artefact and should be read against the Square Attack RI column for a fair robustness comparison.
7.2 Feature-Level TreeSHAP Drift↩︎
The aggregate ESI scores summarise explanation stability in a single number, but they obscure which features drive the instability. To unpack this we compute per-feature TreeSHAP [19] drift on the Phishing dataset, our most extensively studied case, for both tree models. [fig:treeshap-rf-phish,fig:treeshap-xgb-phish] present these as heatmaps over increasing perturbation magnitude, mirroring the MLP analysis of 6.
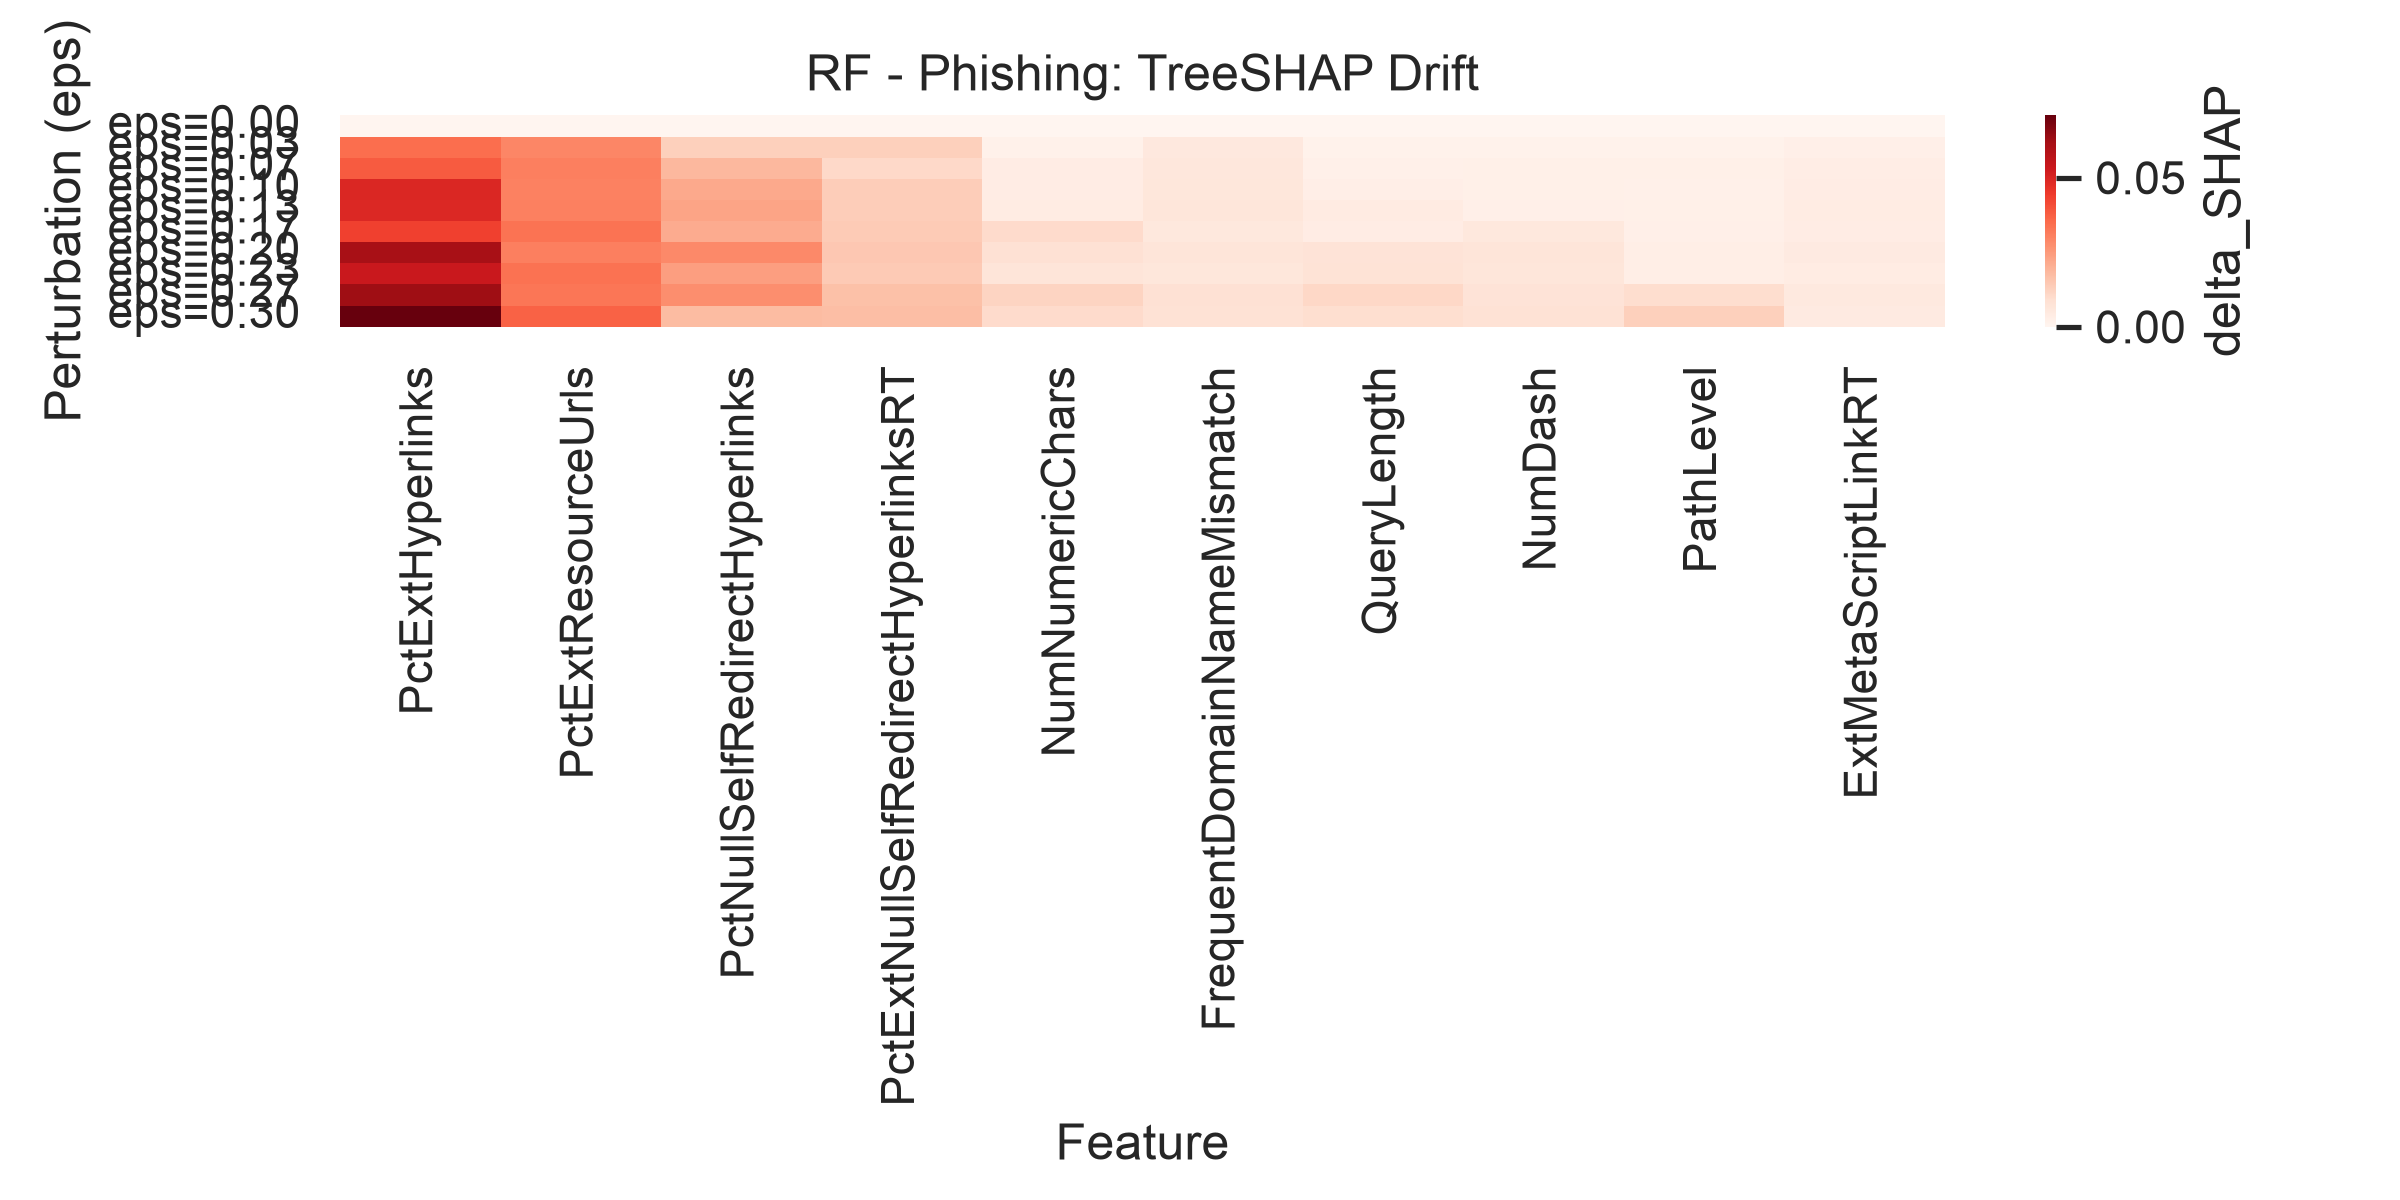
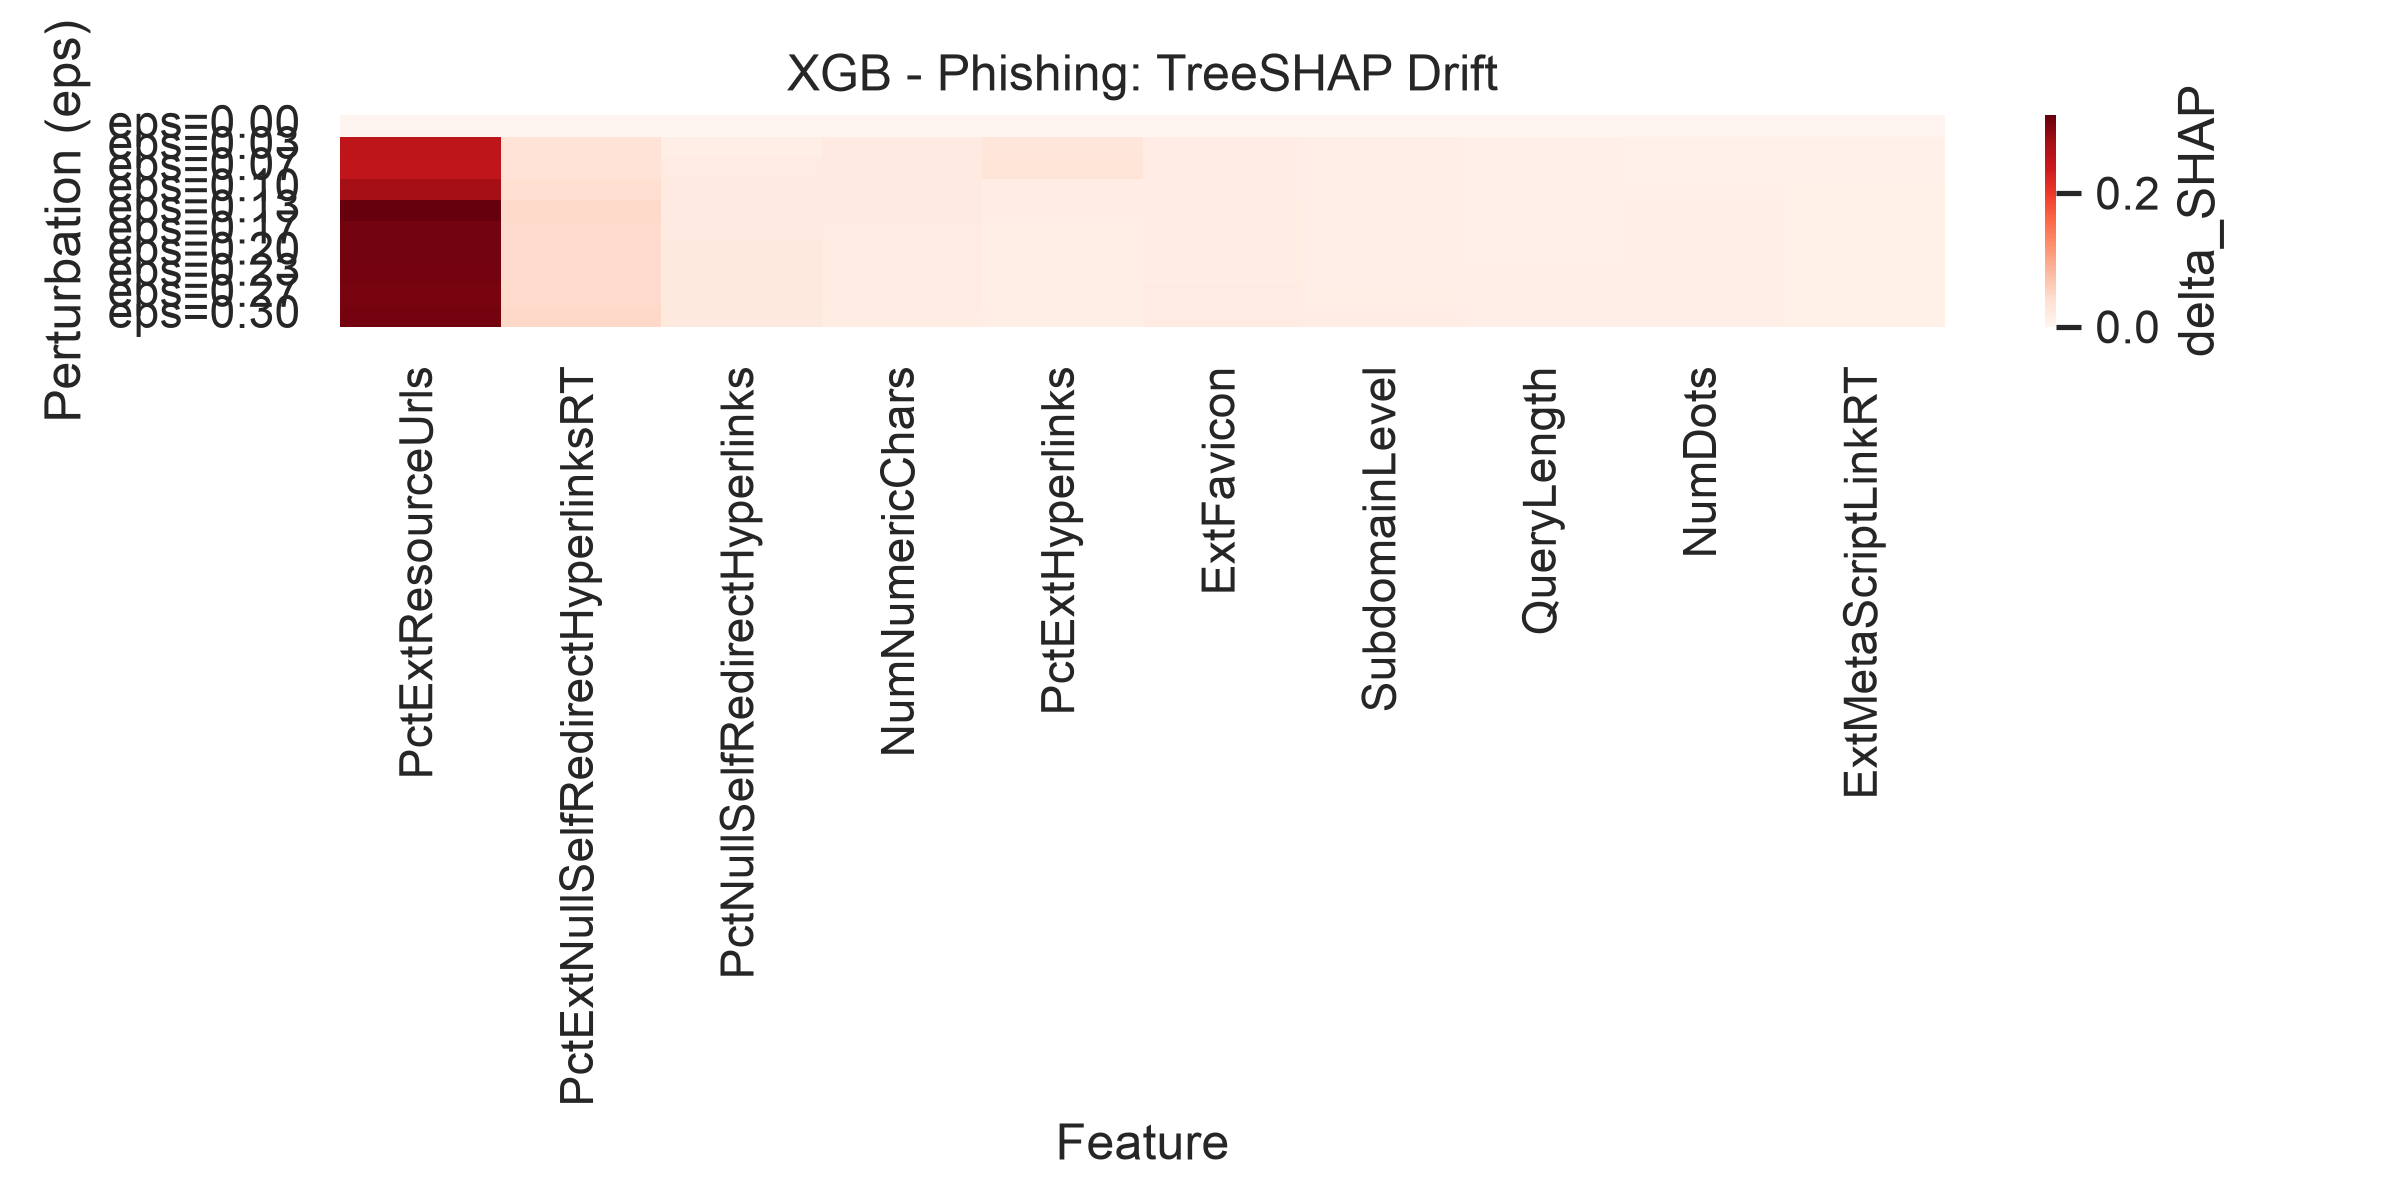
The drift is far from uniform across feature types. For the Phishing classifiers, instability concentrates in lexical and host-based URL features, which take a wide range of values and therefore admit larger perturbations within the \(\ell_\infty\) budget. The network datasets behave differently: in NF-ToN-IoT the flow features (L4_SRC_PORT, L4_DST_PORT, PROTOCOL, L7_PROTO, IN_BYTES,
OUT_BYTES, IN_PKTS, OUT_PKTS, TCP_FLAGS, FLOW_DURATION_MILLISECONDS) include both volumetric counters and categorical protocol identifiers, and drift accumulates on the high-variance byte and
packet counters rather than on the discrete protocol fields.
The most striking observation is the contrast between the two ensembles. XGBoost displays consistently higher per-feature TreeSHAP drift than the Random Forest, even though its prediction-level robustness is comparable or superior on the same dataset. One plausible mechanism is the additive boosting structure: many shallow trees each contribute small sequential corrections, which may make individual feature attributions more sensitive to input perturbation than the averaging behaviour of a Random Forest, where tree outputs are averaged rather than accumulated. Confirming this hypothesis would require a controlled ablation varying ensemble depth and number of estimators; we treat it as a directional observation consistent with the data. Regardless of mechanism, the lower XGBoost ESI (e.g.\(0.111\) vs.\(0.287\) on Phishing) reinforces that robustness and explanation stability are distinct axes that must be measured separately.
7.3 Square Attack Adversarial Training for Tree Ensembles↩︎
Adversarial training for tree ensembles cannot follow the gradient-based recipe used for MLPs, because Random Forests and XGBoost are non-differentiable and do not admit FGSM or PGD augmentation. As a black-box analogue we use Square Attack data augmentation: generate perturbed training examples using Square Attack at \(\varepsilon_{\max}=0.3\), augment the original training set with these adversarial copies (\(25\%\) augmentation ratio, i.e.adding adversarial examples equal to 25% of the original training set), and retrain the model on the combined set. This mirrors the structural design of the MLP adversarial training in 6, though with a larger augmentation \(\varepsilon\) (\(0.3\) here vs.\(0.05\) for MLP FGSM) reflecting that the tree evaluation operates at the full \(\varepsilon_{\max}\) budget.
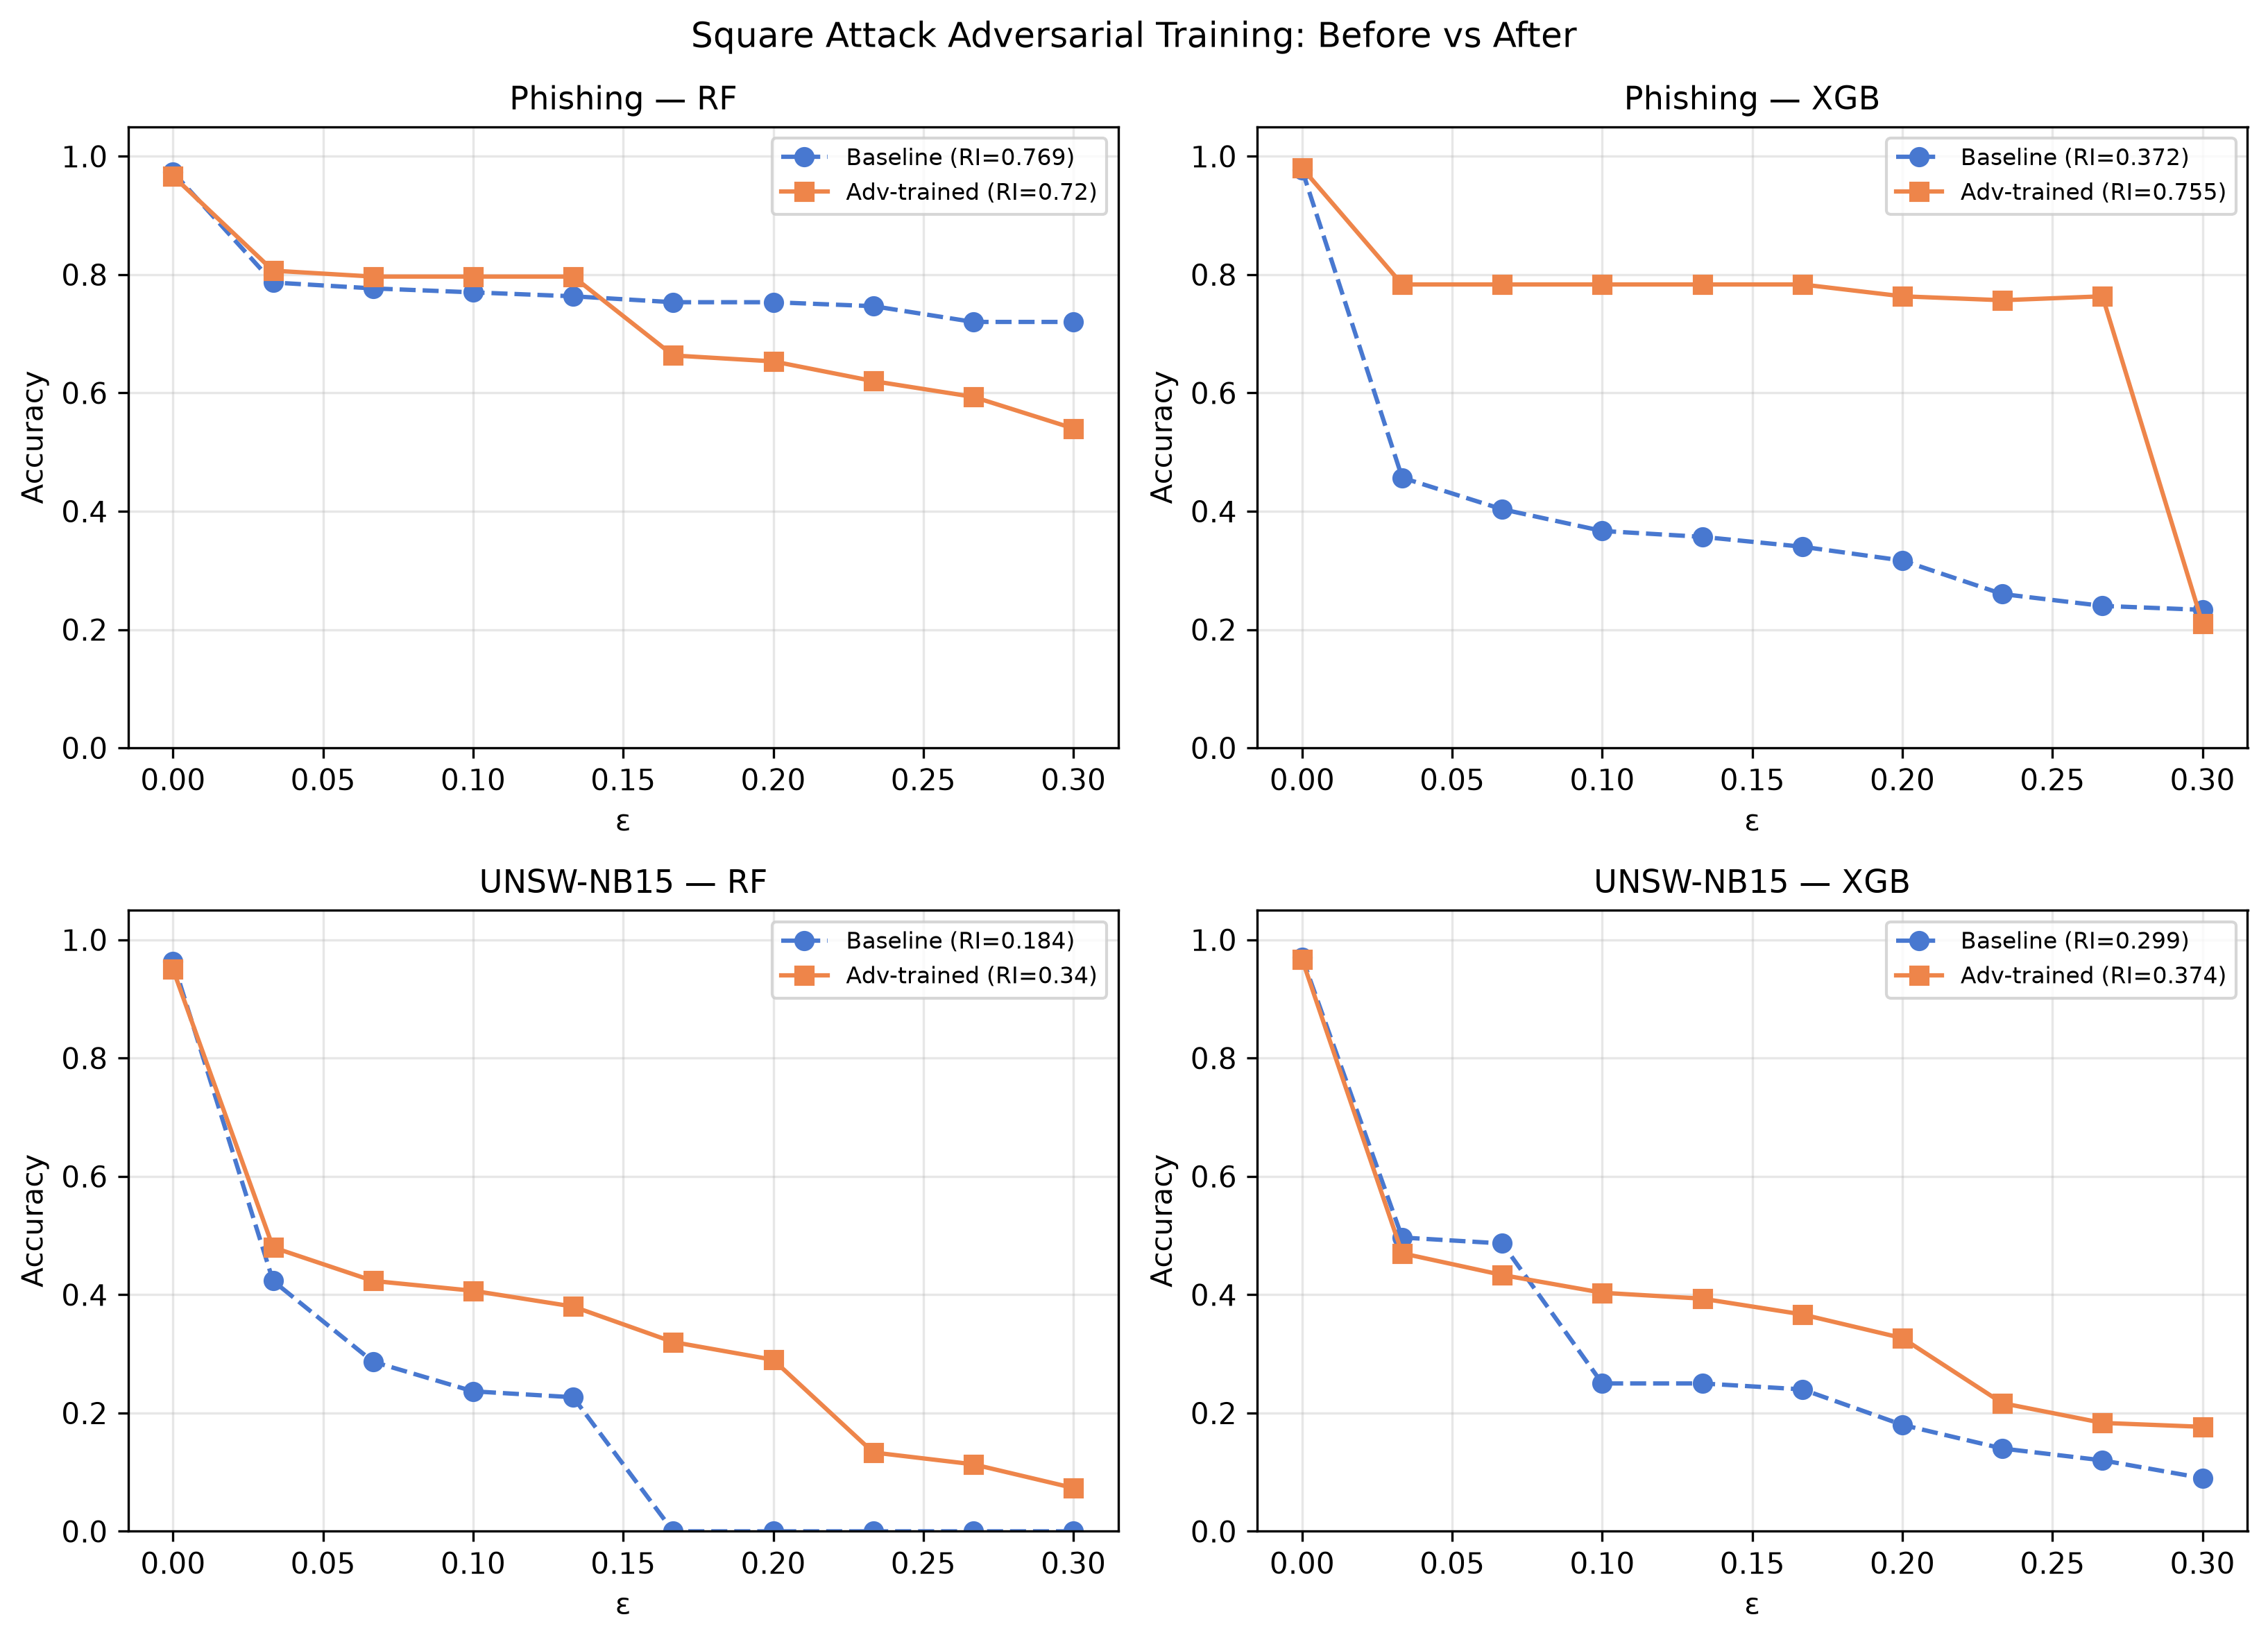
Table 2 reports the before/after comparison on Phishing and UNSW-NB15 across all three attacks. XGBoost benefits most on Phishing: Square Attack RI rises from \(0.372\) to \(0.755\) (\(+0.383\)), nearly closing the gap with RF (\(0.769\)). Clean accuracy cost is negligible (\(-0.001\)). XGBoost’s piecewise-constant leaf structure makes it highly susceptible to score-based random search; training on adversarial examples forces a smoother partitioning. As a side effect, ZOO degeneracy is partially broken (\(0.977 \to 0.928\)): the retrained model can be fooled slightly under ZOO, reflecting the smoother gradient surface.
On UNSW-NB15, the baseline RF collapses to near-zero accuracy at \(\varepsilon \geq 0.167\) (Square RI = 0.184). Adversarial augmentation prevents this collapse: accuracy remains \(0.32\) at \(\varepsilon=0.167\) and \(0.07\) at \(\varepsilon=0.3\), raising Square RI from \(0.184\) to \(0.340\) (\(+0.156\)). For XGBoost on UNSW-NB15, the improvement is more modest (\(+0.075\) on Square), but cross-attack transfer is observed: ZOO RI improves by \(+0.045\) and HSJ RI by \(+0.081\), suggesting genuine boundary hardening rather than attack-specific tuning.
Phishing RF is the exception: Square RI decreases by \(0.049\) (\(0.769 \to 0.720\)) while ZOO and HSJ also decline marginally. The RF already achieves moderate Square robustness on Phishing; augmenting at the full \(\varepsilon_{\max}=0.3\) budget is too aggressive and shifts the boundary in ways that hurt moderate-\(\varepsilon\) attack performance. For already-robust models, the augmentation \(\varepsilon\) should be tuned below \(\varepsilon_{\max}\) — an analogue of the FGSM step-size sensitivity observed for MLP PGD.
| Baseline RI | \(\Delta\) (adv-trained \(-\) baseline) | ||||||||
|---|---|---|---|---|---|---|---|---|---|
| 3-6(lr)7-10 Dataset | Model | Clean | ZOO | Square | HSJ | \(\Delta\)Clean | \(\Delta\)ZOO | \(\Delta\)Sq | \(\Delta\)HSJ |
| Phishing | RF | 0.982 | 0.901 | 0.769 | 0.920 | \(-\)0.004 | \(-\)0.052 | \(-\)0.049 | \(-\)0.024 |
| Phishing | XGB | 0.987 | 0.977 | 0.372 | 0.876 | \(-\)0.001 | \(-\)0.049 | \(+\)0.383 | \(-\)0.008 |
| UNSW-NB15 | RF | 0.964 | 0.809 | 0.184 | 0.844 | \(-\)0.007 | \(+\)0.006 | \(+\)0.156 | \(\pm\)0.000 |
| UNSW-NB15 | XGB | 0.974 | 0.886 | 0.299 | 0.806 | \(-\)0.003 | \(+\)0.045 | \(+\)0.075 | \(+\)0.081 |
10 plots the Square Attack accuracy curves before and after augmentation on both datasets. The XGBoost Phishing curve shifts markedly upward. For UNSW-NB15, both models’ curves no longer drop to zero at moderate \(\varepsilon\). The adversarially trained XGBoost on Phishing achieves Square RI parity with the baseline RF (\(0.755\) vs.\(0.769\)), demonstrating that the large ZOO-Square gap can be substantially narrowed through targeted augmentation.
8 NF-ToN-IoT: Third Dataset Evaluation↩︎
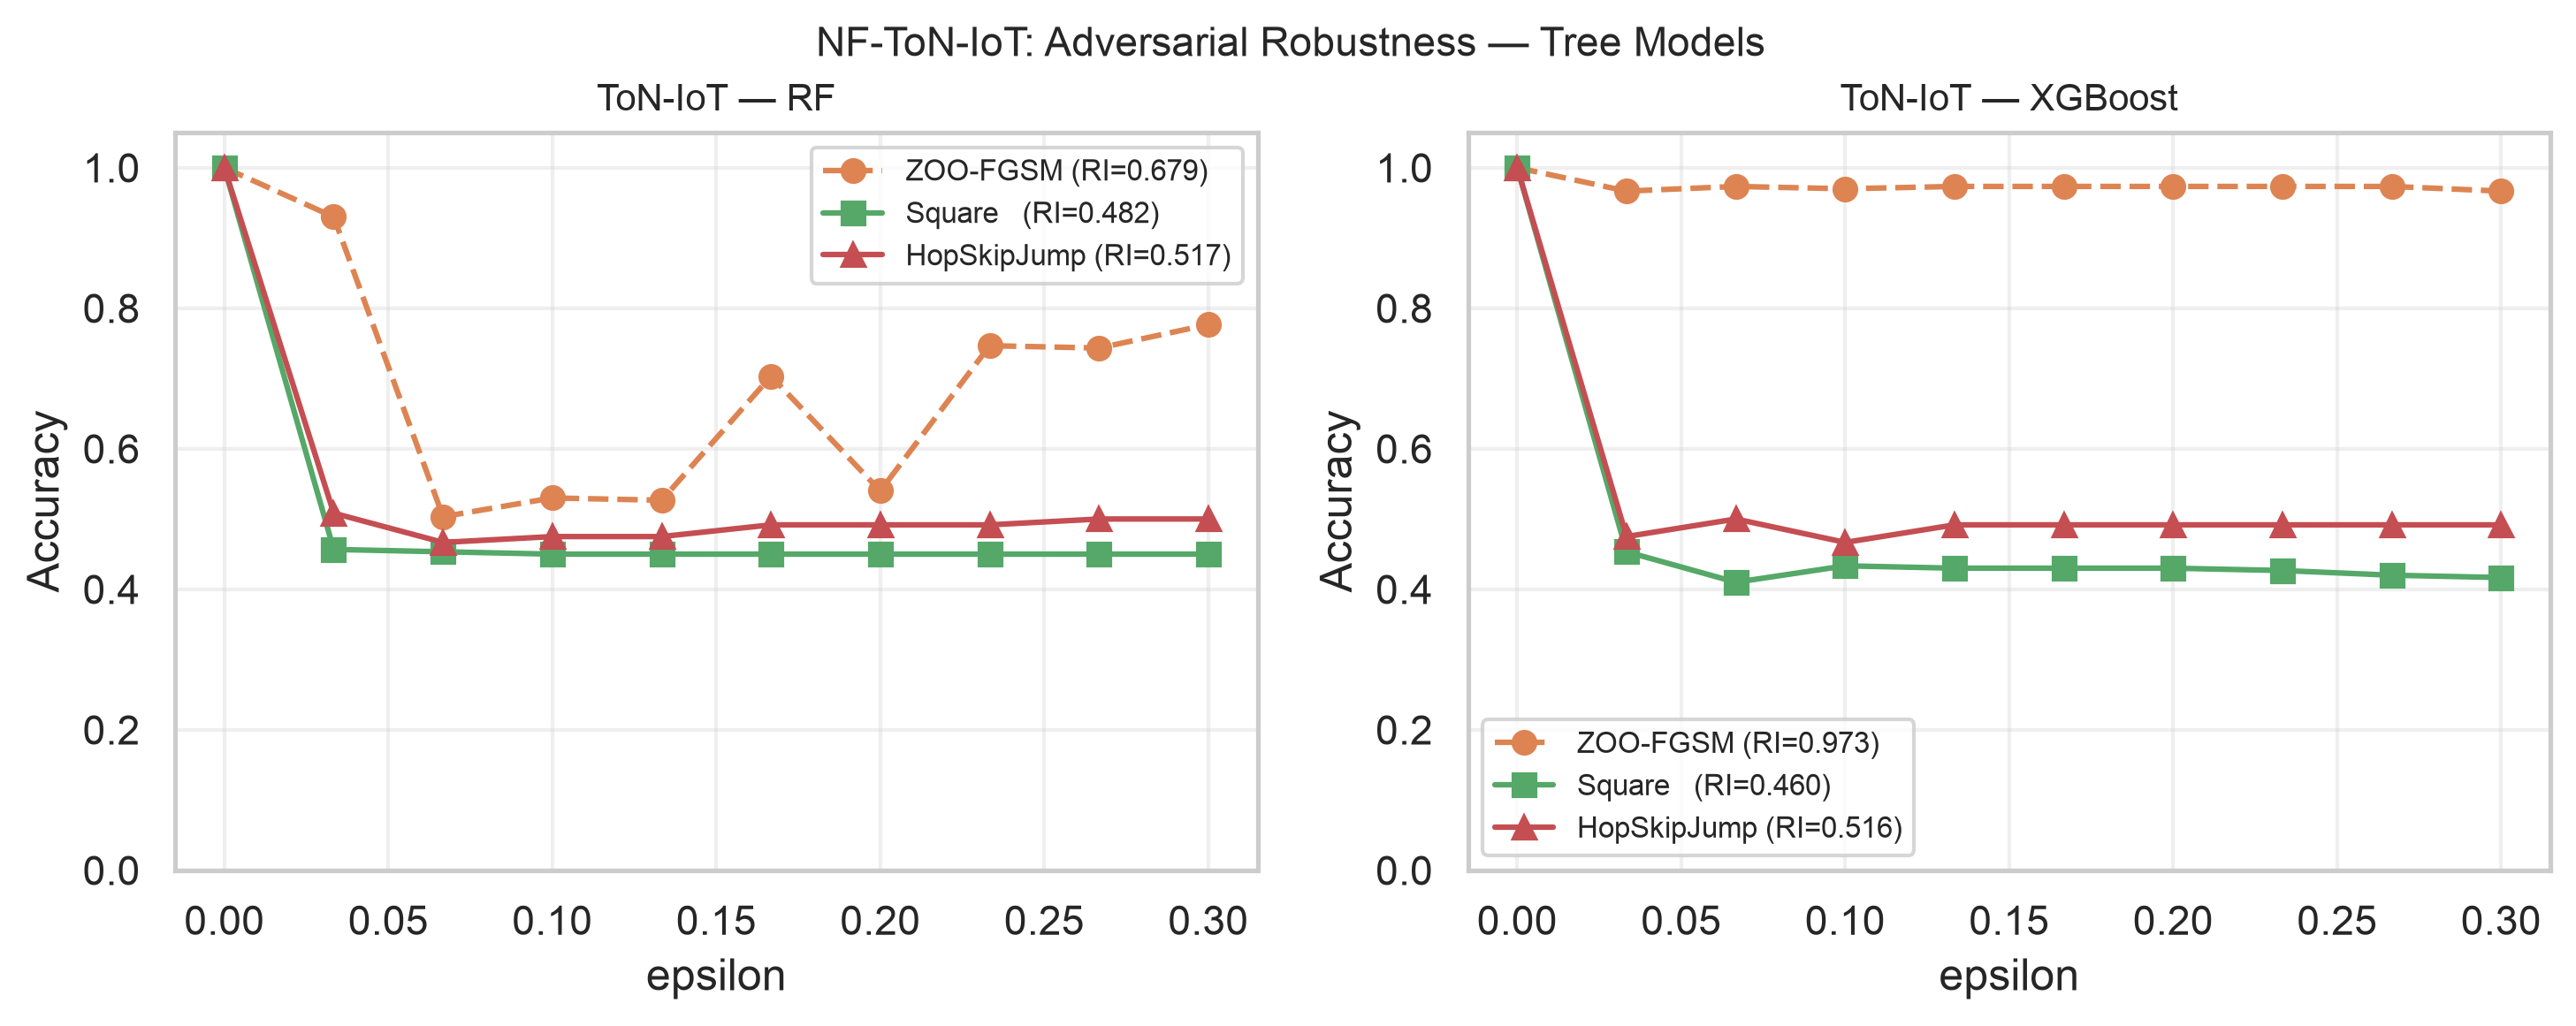
Table 1 includes results for NF-ToN-IoT. Both RF and XGBoost achieve 0.998 clean accuracy on this dataset, consistent with its highly separable NetFlow feature structure. Near-perfect clean accuracy on a sampled subset warrants caution: it could reflect genuine class separability in NetFlow v2 features, or it could indicate overfitting to the 40,000-sample stratified subset or feature leakage from NetFlow-derived fields that encode near-ground-truth labels. Absolute RI values on this dataset should therefore be treated with care; however, the relative comparisons across attack methods (e.g.ZOO degeneracy on XGBoost, Square Attack vs.HopSkipJump gap) are less sensitive to clean-accuracy inflation and remain informative. We flag this as a direction for further dataset validation.
A notable departure from Phishing and UNSW-NB15 is that ZOO RI for RF drops to 0.679 on NF-ToN-IoT, significantly lower than on the other datasets (0.915, 0.949). One plausible explanation is the lower feature dimensionality of NF-ToN-IoT (10 features vs. for Phishing and 43 for UNSW-NB15): with fewer features, ZOO’s finite-difference gradient estimates sample a smaller coordinate space and may be more accurate, reducing the degeneracy. However, the three datasets also differ in domain, feature-type distribution, and class separability, so dimensionality cannot be cleanly isolated as the cause without a controlled ablation that varies feature count within a single dataset. We treat this as a plausible hypothesis consistent with the data rather than a confirmed finding.
XGBoost ZOO RI remains high at 0.973, confirming that the piecewise-constant prediction surface of boosted trees dominates regardless of dimensionality. Square Attack degrades both models substantially (RI \(\approx\) 0.46–0.48, corresponding to terminal accuracy near the class-prior baseline), consistent with prior datasets.
HopSkipJump achieves RI of 0.517 (RF) and 0.516 (XGB) on NF-ToN-IoT, converging much closer to Square Attack than on the higher-dimensional Phishing and UNSW-NB15 datasets. This convergence supports the interpretation that lower feature dimensionality makes boundary search more tractable: with only 10 features, HSJ’s binary-search-and-gradient-estimate loop explores a substantially smaller volume, approaching the effectiveness of Square Attack’s random search.
ESI for RF (0.214) is between Phishing (0.287) and UNSW-NB15 (0.142); XGBoost ESI (0.159) follows the same cross-dataset pattern. However, the five-seed variance study (4) shows the RF\(-\)XGB ESI margin on NF-ToN-IoT is \(0.025 \pm 0.082\), which is within sampling noise; this ordering should be treated as inconclusive on this dataset.
11 shows the robustness curves for both models on NF-ToN-IoT.
9 HIKARI-2021: Cross-Domain Validation↩︎
HIKARI-2021 [8] differs structurally from the three previous datasets: it captures TLS/HTTPS encrypted network flows, meaning packet payload is not directly observable, and its 83 retained features are dominated by connection timing, byte/packet statistics, and TLS handshake characteristics rather than URL-structure or categorical NetFlow fields. It therefore represents a third distinct security domain (encrypted-traffic detection) and tests whether the findings from Phishing and UNSW-NB15 generalise beyond those specific feature spaces. As with NF-ToN-IoT, both RF and XGBoost achieve very high clean accuracy (0.998 and 0.999); the same caution about relative comparisons over absolute RI values applies here.
9.0.0.1 ZOO degeneracy persists.
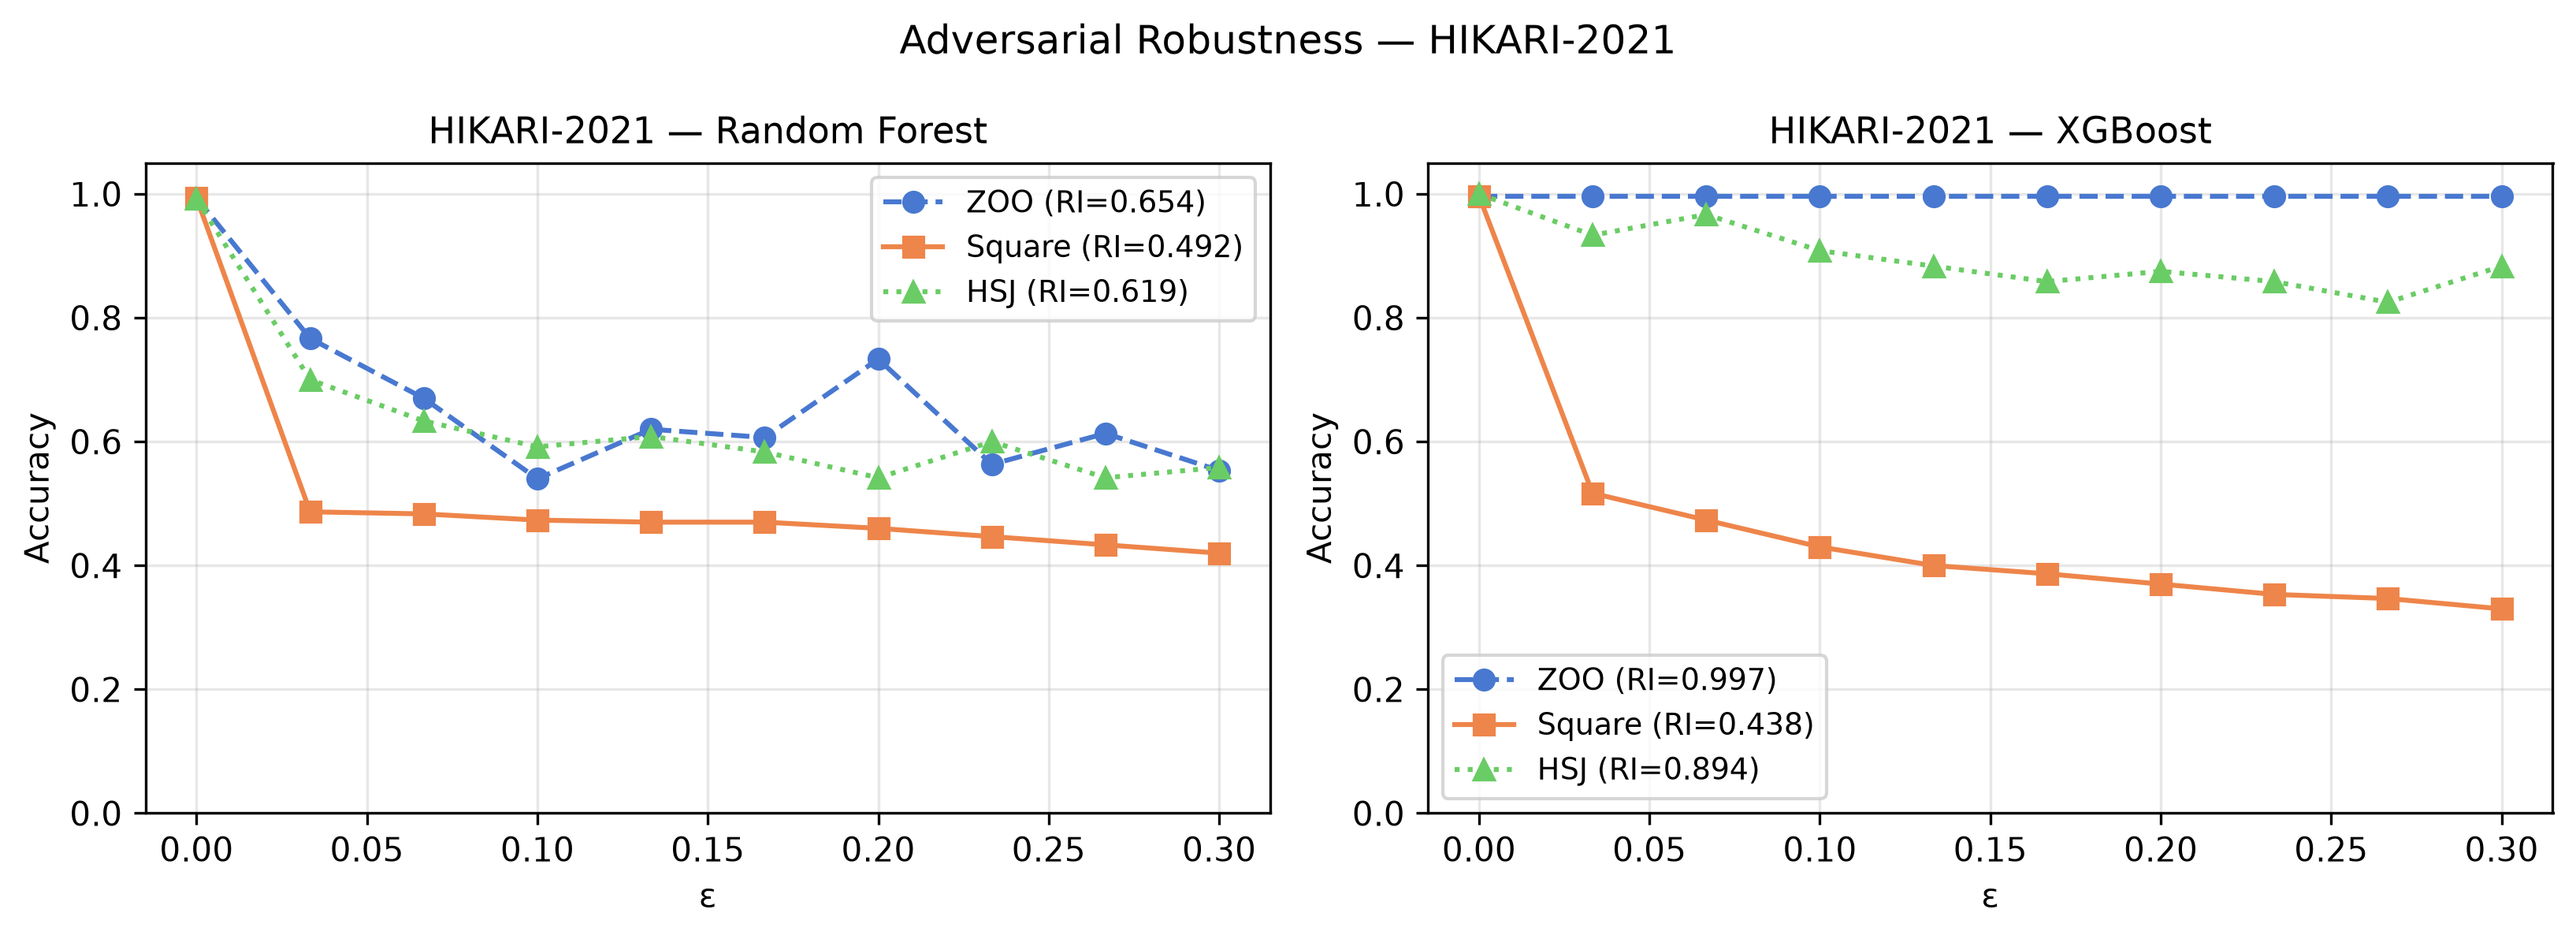
XGBoost ZOO RI is 0.997—the characteristic flat accuracy curve at clean accuracy across all \(\varepsilon\)—confirming that piecewise-constant tree leaves produce near-zero finite-difference gradients regardless of feature space. The ZOO-versus-Square-Attack gap for XGBoost is \(0.997 - 0.438 = 0.559\), comparable to the 0.62 gap on Phishing and consistent across all four datasets.
9.0.0.2 Square Attack reveals vulnerability.
Under Square Attack, XGBoost RI drops to 0.438—meaning the model’s accuracy averaged across the \(\varepsilon\) grid falls below \(0.5\), indicating near- or sub-random classification across most evaluated perturbation levels. RF RI under Square Attack is 0.492, also near-random. This is the most extreme collapse we observe across all four datasets, suggesting that the encrypted-traffic feature space provides a particularly dense adversarial neighbourhood under \(\ell_\infty\) perturbations.
9.0.0.3 HopSkipJump–Square gap on HIKARI.
XGBoost HSJ RI is 0.894 versus Square Attack RI of 0.438—a gap of 0.456, larger than on any other dataset. With 83 features, HIKARI is high-dimensional, and HSJ’s boundary traversal must search a large volume; the result is consistent with the trend established across previous datasets (larger gaps at higher dimensionality). RF shows a smaller HSJ–Square gap (\(0.619 - 0.492 = 0.127\)), consistent with RF’s smoother decision boundary making boundary search comparatively more effective.
9.0.0.4 ESI ordering holds.
RF ESI (0.140) exceeds XGBoost ESI (0.056) on HIKARI, extending the RF > XGB ordering to a fourth dataset with a qualitatively different feature space. XGBoost ESI of 0.056 is the lowest value observed across all datasets, tied with UNSW-NB15 (0.063), reinforcing that XGBoost’s additive boosting structure produces higher attribution drift than Random Forest averaging irrespective of the traffic domain.
12 shows the robustness curves for both models on HIKARI-2021.
10 PGD Step-Size Ablation↩︎
Our conference paper [6] observed that PGD produces higher RI than FGSM—i.e., PGD is a weaker attack—on both datasets. Reviewer feedback identified this as counterintuitive, since PGD is an iterative refinement of FGSM that should find stronger adversarial examples.
We resolve this by an ablation over five step sizes \(\alpha \in \{0.005,\,0.01,\,0.02,\,0.05,\,0.10\}\) with 10 fixed steps, shown in 3 and 13.
| Attack | \(\alpha\) | RI (Phishing) | RI (UNSW-NB15) |
|---|---|---|---|
| FGSM | — | 0.677 | 0.713 |
| PGD (10 steps) | 0.005 | 0.891 | 0.776 |
| 0.010 | 0.819 | 0.761 | |
| 0.020 | 0.694 | 0.724 | |
| 0.050 | 0.651 | 0.679 | |
| 0.100 | 0.649 | 0.674 |
The ablation reveals a monotonic decrease in RI as \(\alpha\) increases: PGD becomes progressively stronger as the step size grows, converging toward and eventually surpassing FGSM at \(\alpha \geq 0.05\). The conventional choice of \(\alpha = \varepsilon_{\max}/\text{steps} = 0.01\) is the weakest PGD configuration tested.
The mechanism is as follows. On z-score normalised tabular data, each PGD step of size \(\alpha=0.01\) is projected back into the \(L_\infty\) ball around \(\mathbf{x}_0\). When \(\varepsilon\) is small (e.g.\(\varepsilon = 0.033\)), \(10 \times 0.01 = 0.10 > \varepsilon\), so the cumulative displacement from 10 steps would overshoot the ball boundary and be clipped at each projection—the iterate never reaches the boundary the single FGSM step jumps to directly. At larger \(\varepsilon\) (e.g.\(\varepsilon = 0.30\), \(10 \times 0.01 = \varepsilon\)), each step fits within the ball and PGD can accumulate its full budget, recovering FGSM-level strength. FGSM’s single full-budget step reaches the \(L_\infty\) boundary directly at all \(\varepsilon\) values without iterative clipping. This phenomenon is specific to tabular data with z-score normalisation, where feature scales are uniform and small step sizes are systematically ineffective. We recommend adaptive step sizes (\(\alpha = \varepsilon / \text{steps}\) per \(\varepsilon\) value) for future studies on normalised tabular data.

11 Discussion↩︎
11.1 Attack Realism for Structured Security Features↩︎
A practical concern for adversarial evaluation on tabular cybersecurity data is whether \(L_\infty\)-bounded perturbations correspond to plausible adversarial capabilities. In phishing detection, features represent observable URL and page structure; an attacker can realistically manipulate these (e.g.adding subdomains, adjusting URL length) while preserving the phishing payload. In network intrusion detection, NetFlow features such as byte counts and packet rates can be shaped by an attacker controlling the traffic source. However, not all features are independently actionable: some are deterministically derived from others (e.g. packet counts constrain byte counts), meaning unconstrained \(L_\infty\) perturbations may generate invalid feature combinations.
All five attacks in this study apply unconstrained \(\ell_\infty\) perturbations without enforcing domain-specific feature validity. Realism is not a function of attack sparsity or perturbation structure: Square Attack’s random square-shaped patches do not, by construction, preserve semantic constraints any more than FGSM or ZOO do. The lower RI values under Square Attack and HopSkipJump relative to ZOO reflect differences in attack effectiveness—principally the ZOO degeneracy artefact—not differences in how closely the perturbations respect the feature manifold.
A genuine realism argument for tabular security data requires distinguishing attacker-controllable features from derived or protocol-constrained ones. In phishing detection most URL-structure features are directly under the attacker’s control (the attacker constructs the phishing page), which provides a reasonable basis for unconstrained perturbations. In network intrusion detection, however, some NetFlow features are deterministic functions of others (packet counts constrain byte-per-packet ratios), so any perturbation that violates these constraints produces records no real flow could generate. Making the attack protocol domain-realistic requires projecting perturbations onto the manifold of valid network records—a direction formalised as the problem-space constraint by Pierazzi et al. [29] and left for future work in our setting [7].
11.2 ESI as a Complement to RI↩︎
RI and ESI measure distinct properties that can decouple. A model may retain its prediction under perturbation while its attributions reorder completely; conversely, stable attributions do not guarantee a stable prediction. ESI therefore supplies information that RI alone cannot, capturing the trustworthiness of a model’s explanations under attack rather than the correctness of its label.
This positioning distinguishes ESI from existing explanation-stability metrics. Evaluation frameworks such as OpenXAI [22] formalise relative input and output stability (RIS/ROS), which quantify the faithfulness and local Lipschitz behaviour of explanations—how much an explanation changes under random or local input noise. Alvarez-Melis and Jaakkola [23] similarly probe explanation sensitivity to local perturbations. ESI instead measures attribution drift under adversarial perturbations of growing magnitude, tying explanation stability to the same threat model that defines RI. Where existing metrics ask whether explanations are locally smooth, ESI asks whether they survive an adversary.
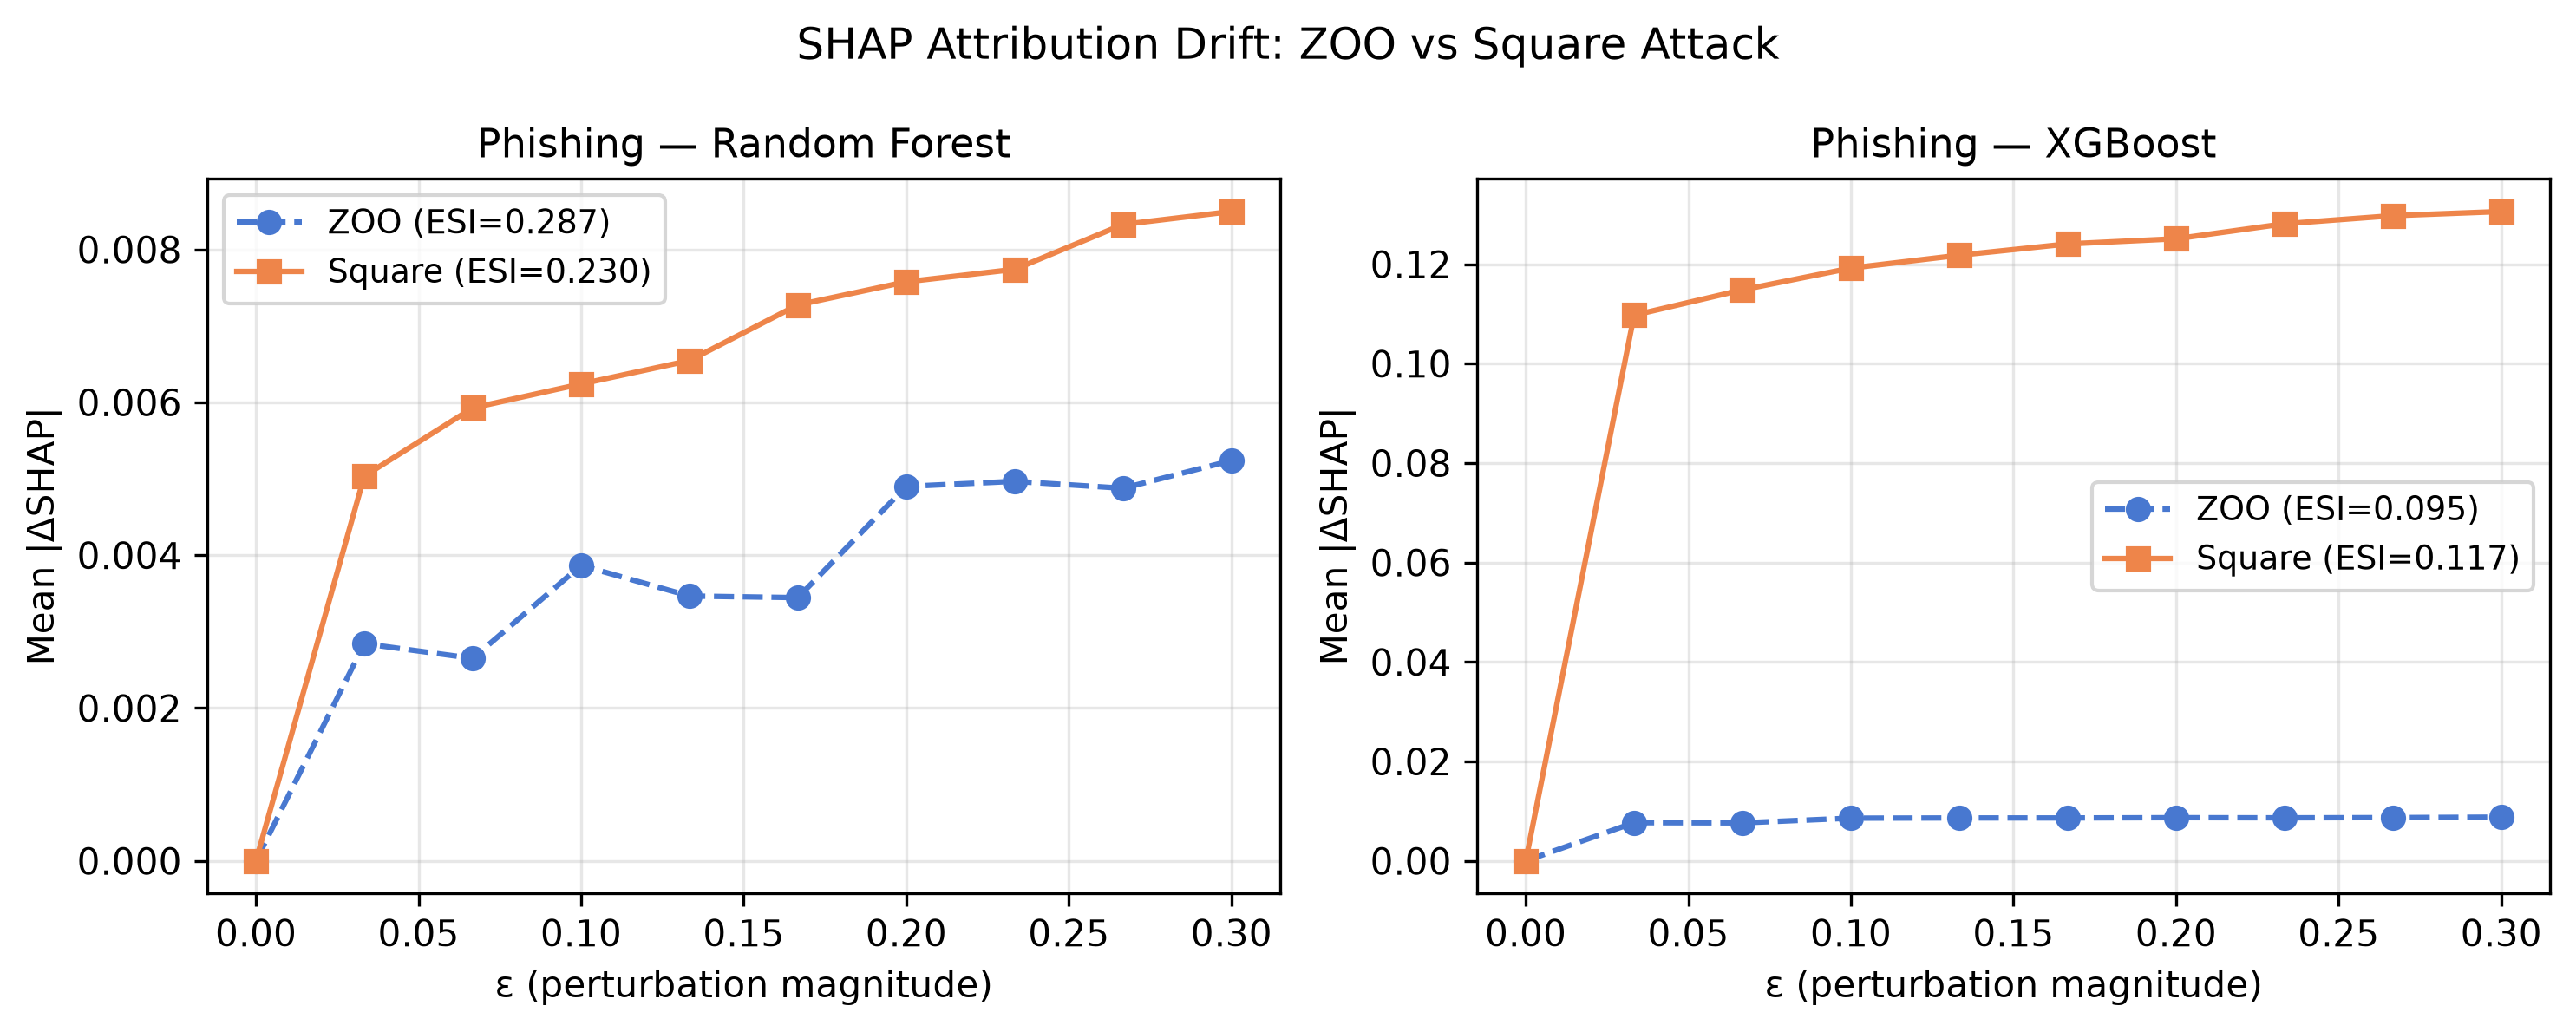
A natural concern is whether the RF > XGBoost ESI ordering is genuine or an artefact of ZOO degeneracy: since ZOO barely perturbs XGBoost predictions, the lower XGBoost ESI might reflect that ZOO perturbs the two models to structurally different degrees rather than a true architectural difference in explanation fragility. To test this, we computed ESI under Square Attack—which actually moves XGBoost predictions—on the Phishing dataset. The ordering holds: RF ESI = 0.230 versus XGBoost ESI = 0.117 under Square Attack, compared to \(0.287\) vs.\(0.111\) under ZOO. XGBoost explanation fragility persists even when the generating attack is not degenerate, confirming that the gap reflects an architectural property, not a ZOO artefact. 14 shows the attribution drift curves under both attacks.
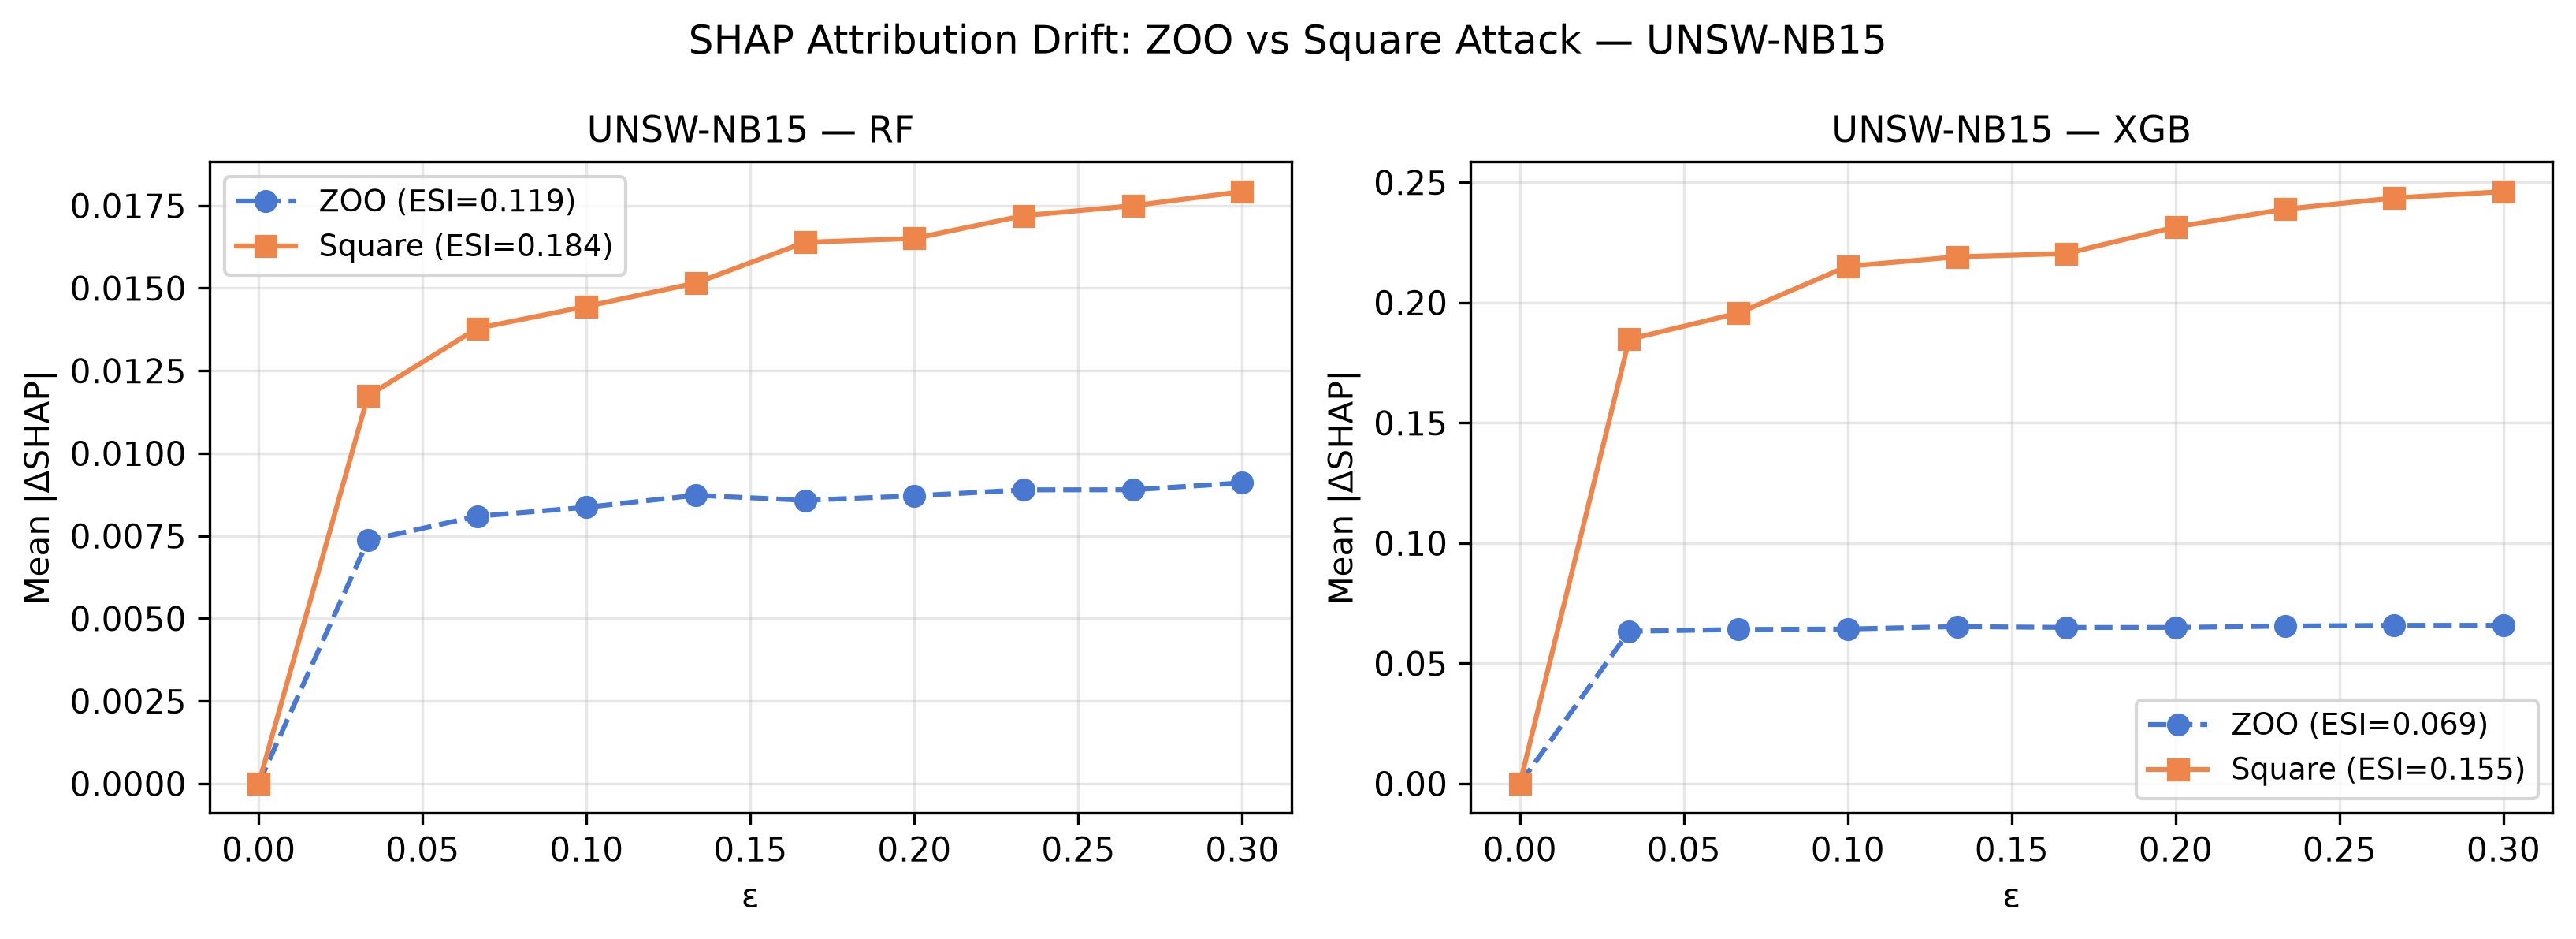
The cross-dataset behaviour of ESI supports its use as a model-selection criterion. Across all four datasets, XGBoost records a lower ZOO ESI than the Random Forest (\(0.111\) vs.\(0.287\) on Phishing, \(0.068\) vs.\(0.142\) on UNSW-NB15, \(0.159\) vs.\(0.214\) on NF-ToN-IoT, and \(0.056\) vs.\(0.140\) on HIKARI-2021). Under Square Attack, the RF > XGB ordering holds on UNSW-NB15: RF ESI = 0.184 versus XGB ESI = 0.155, corroborating the architectural interpretation on a second, structurally distinct dataset (15). On NF-ToN-IoT the margin is negligible (RF \(\approx\) XGB \(\approx\) 0.105 in a single run). On HIKARI-2021 the ordering reverses (RF ESI = 0.093, XGB ESI = 0.176)—a normalisation-scale artefact: XGBoost’s absolute mean SHAP drift on HIKARI (\(0.063\)–\(0.101\) per feature) is approximately ten times RF’s (\(0.008\)–\(0.010\)), yet it grows gradually, starting at 63% of its maximum at \(\varepsilon=0.033\) and reaching 100% at \(\varepsilon=0.30\), while RF’s drift saturates at 86% of its maximum at the first \(\varepsilon\) step. The ESI normalisation by \(\bar{D}(\varepsilon_{\max})\) (Eq. 3 ) rewards gradual drift curves regardless of absolute scale, so XGBoost scores as more stable despite its far larger absolute attribution change. Normalised-AUC metrics should therefore be read alongside absolute drift magnitudes when model families produce SHAP values of different scales. In sum: the RF > XGB ordering holds on all four datasets under ZOO; under Square Attack it is confirmed on Phishing and UNSW-NB15, inconclusive on NF-ToN-IoT, and reversed on HIKARI-2021 due to the normalisation artefact above.
Low ESI is operationally hazardous even when predictions appear stable—whether from genuine robustness or from attack degeneracy. A SOC analyst relying on SHAP attributions from such a model may be steered toward the wrong features and the wrong remediation, even as the predicted label remains correct. Reporting RI and ESI jointly, and under multiple attack methods to avoid degeneracy artefacts, lets practitioners identify models that are robust in label but fragile in rationale. Future work will extend ESI beyond SHAP to LIME [20] attributions, enabling explanation-stability comparisons across interpretation methods as well as across models.
11.3 Attack-Method Selection Guidance↩︎
The results across four datasets and two tree model families reveal a consistent ranking of attack strength that can be explained by two independent axes: gradient dependence and query efficiency in high-dimensional spaces.
11.3.0.1 Gradient dependence.
ZOO’s effectiveness is determined by the quality of its finite-difference gradient estimates, which in turn depends on model smoothness and feature dimensionality. Against XGBoost, whose piecewise-constant prediction surface yields near-zero finite differences inside tree leaves, ZOO is essentially degenerate at all dimensionalities (RI = 0.97–0.99 across all four datasets). Against Random Forest, whose ensemble averaging produces smoother decision boundaries, ZOO is partially effective but strongly dimensionality-dependent: RI drops from 0.949 (UNSW-NB15, 43 features) to 0.679 (NF-ToN-IoT, 10 features). Square Attack and HopSkipJump require no gradient information and are unaffected by this axis entirely.
11.3.0.2 Query efficiency.
Given equivalent query budgets, Square Attack’s random \(\ell_\infty\) search outperforms HopSkipJump’s boundary traversal in high-dimensional feature spaces. The RI gap is largest for XGBoost on Phishing (Square Attack 0.36 vs.HSJ 0.65, a gap of 0.29) and closes at low dimensionality: on NF-ToN-IoT (10 features) both methods converge to RI \(\approx\) 0.48–0.52 for both models. This is consistent with boundary search being more adversely affected by dimensionality than random search.
11.3.0.3 Practical recommendations.
These two axes suggest the following guidelines for adversarial evaluation of cybersecurity classifiers:
Tree ensembles (XGBoost, RF): Square Attack should be the primary benchmark. ZOO alone is insufficient and can overestimate robustness by up to 0.62 RI for XGBoost. HopSkipJump provides useful complementary evidence that the attack is decision-boundary-grounded, but requires a larger query budget and may be weaker in high-dimensional feature spaces.
MLP (white-box): FGSM or PGD with adaptive step size (\(\alpha = \varepsilon/\text{steps}\) per \(\varepsilon\) value) should be preferred over default PGD (\(\alpha = 0.01\)), which underperforms FGSM on z-score normalised tabular data.
Robustness reporting: Report RI under the strongest available attack as the primary robustness estimate. Reporting ZOO RI alongside Square Attack RI is useful to quantify the degeneracy gap, but the headline figure should come from the stronger attack.
12 Limitations↩︎
Several limitations bound the scope of our conclusions and motivate future work.
12.0.0.1 Feature validity.
Our attacks apply \(\ell_\infty\) perturbations independently to each feature, which can violate the dependencies inherent in structured security data. In NetFlow records, for example, byte and packet counters are
strongly correlated and the ratio of IN_BYTES to IN_PKTS is bounded by physical packet sizes, so an unconstrained perturbation may produce records that no real flow could generate. The reported robustness values are therefore
conservative upper bounds on realistic adversarial difficulty; future work should incorporate domain-constraint projections that restrict perturbations to the manifold of valid traffic.
12.0.0.2 Dataset scope.
We evaluate four datasets drawn from three domains—web security (Phishing URLs), network intrusion detection (UNSW-NB15, NF-ToN-IoT), and encrypted-traffic detection (HIKARI-2021). Other important security tasks, notably static and dynamic malware classification and host-based intrusion detection, are not covered, and their feature semantics may interact differently with both attacks and explanation drift.
12.0.0.3 Computational constraints.
All experiments run on CPU, which limits attack strength. We cap HopSkipJump at \(120\) samples, against \(300\) for the other attacks, and restrict the number of ZOO iterations to keep evaluation tractable. A GPU-based evaluation would permit larger query budgets and more iterations, likely yielding lower RI values and thus exposing stronger vulnerabilities than those reported here. A query-budget ablation (7) directly tests whether ZOO degeneracy on XGBoost is a budget artefact: varying the coordinate-sampling fraction from 12% to 100% and the number of iterative refinement steps from 20 to 200 leaves XGBoost RI flat on Phishing (\(\Delta = 0.000\)), establishing degeneracy as intrinsic to the piecewise-constant prediction surface rather than a function of the iteration limit used here. GPU-scale budgets are unlikely to change this conclusion on Phishing; on UNSW-NB15, where partial sensitivity was observed, higher budgets may narrow the ZOO–Square gap further.
12.0.0.4 Variance and statistical significance.
We ran each experiment across five random seeds that jointly control the train/test split, model initialisation, and evaluation subset selection. 4 reports mean \(\pm\) std for the two key comparisons.
| Dataset | XGB gap (ZOO\(-\)Sq RI) | RF\(-\)XGB ESI | RF\(>\)XGB (\(k/5\)) |
|---|---|---|---|
| NF-ToN-IoT | \(0.541 \pm 0.023\) | \(0.025 \pm 0.082\) | 3/5 |
| Phishing | \(0.575 \pm 0.029\) | \(0.125 \pm 0.087\) | 4/5 |
| HIKARI-2021 | \(0.537 \pm 0.017\) | \(0.064 \pm 0.068\) | 4/5 |
| UNSW-NB15 | \(0.534 \pm 0.035\) | \(0.067 \pm 0.015\) | 5/5 |
The ZOO degeneracy gap is highly reproducible: std \(\leq\) 0.035 across all four datasets, confirming this is a structural property rather than a lucky point estimate. ESI is more variable: RF ESI std reaches 0.084–0.101 on low-dimensional datasets (NF-ToN-IoT, Phishing), reflecting sensitivity of the normalised-AUC formula to which 256 test examples are sampled. The RF > XGB ESI ordering holds in all five seeds on UNSW-NB15 (margin \(0.067 \pm 0.015\), the smallest relative std), in four of five seeds on Phishing and HIKARI-2021, and in three of five on NF-ToN-IoT. The NF-ToN-IoT margin (\(0.025 \pm 0.082\)) is within noise and should be treated as inconclusive; the ordering on the other three datasets is directionally consistent but confidence intervals overlap on Phishing and HIKARI, so the architectural claim is best supported by the qualitative pattern across datasets rather than any single point estimate.
12.0.0.5 Tree ensemble defences.
7.3 evaluates Square Attack data augmentation as a black-box adversarial training strategy for tree ensembles. The largest gains are observed where the baseline Square RI is lowest: XGBoost on Phishing improves by \(+0.383\), and RF on UNSW-NB15 by \(+0.156\). A remaining limitation is that augmentation at the full \(\varepsilon_{\max}=0.3\) budget can degrade models that already have moderate robustness (RF on Phishing, \(-0.049\)), suggesting the augmentation \(\varepsilon\) should be cross-validated rather than fixed at \(\varepsilon_{\max}\). Defence strategies beyond augmentation—such as feature-validity constraint projections [7], ensemble diversity maximisation, and adversarial purification via density estimators—remain active research directions not covered here.
12.0.0.6 ESI approximation.
For tree models we compute ESI using ZOO-perturbed inputs, which is convenient because ZOO produces smoothly increasing perturbations at each \(\varepsilon\) step, but it is not necessarily the attack that maximises attribution drift. We have validated the ZOO-based ESI ordering under Square Attack on all four datasets (see 11): the RF > XGB ordering holds on Phishing and UNSW-NB15, is tied on NF-ToN-IoT, and reverses on HIKARI-2021 due to a normalisation-scale artefact. A remaining limitation is that the validation uses the same query budget as the RI evaluation; a drift-maximising attack with a larger budget may rank model families differently.
13 Conclusion↩︎
We presented an extended empirical study of adversarial robustness and explainability stability in tabular cybersecurity classifiers, expanding our conference paper [6] along four dimensions: classifier families (RF and XGBoost), attack methods (ZOO, Square Attack, HopSkipJump), evaluation datasets (NF-ToN-IoT and HIKARI-2021), and metrics (ESI).
Three findings stand out. First, ZOO produces degenerate gradient estimates against XGBoost, inflating apparent robustness; Square Attack reveals genuine vulnerability with a RI gap of up to 0.62 on the same model. This gap replicates across all four datasets (mean 0.534–0.575, std \(\leq\) 0.035 across five seeds), confirming that attack-method selection is not model-agnostic and that gradient-based black-box attacks are insufficient for evaluating tree ensembles. Second, RI and ESI can decouple: ZOO perturbations that fail to fool XGBoost predictions (artefact RI \(\approx\) 0.98) still drive large attribution drift (ESI \(\approx\) 0.06–0.16), demonstrating that an attack too weak to cause misclassification can nonetheless destabilise explanations. RF achieves higher ESI than XGBoost under ZOO across all four datasets; Square Attack recomputation confirms this ordering on Phishing (RF = 0.230, XGB = 0.117) and UNSW-NB15 (RF = 0.184, XGB = 0.155), corroborating the interpretation that the gap is architectural rather than a ZOO artefact ([fig:esi_square,fig:esi_square_unsw]); UNSW-NB15 provides the strongest confirmation (5/5 seeds, margin \(0.067 \pm 0.015\)). Third, PGD underperforms FGSM on z-score normalised tabular data when the conventional step size \(\alpha=0.01\) is used, an artifact explained by iterative \(L_\infty\) projection cancelling gradient accumulation.
Directions for future work include incorporating feature validity constraints into the attack protocol, extending ESI to other XAI methods beyond SHAP (e.g.LIME), and tuning the augmentation \(\varepsilon\) budget for Square Attack adversarial training—the current study uses \(\varepsilon_{\max}=0.3\), but cross-validating a smaller augmentation budget may improve gains for models with already-moderate baseline robustness.
13.0.1 ↩︎
The authors thank the anonymous reviewers of the ICAART 2026 conference version for feedback that directly motivated the tree ensemble extension, the black-box attack comparison, and the PGD step-size ablation presented in this work. Experiment code and result tables are publicly available [1].
13.0.2 ↩︎
The authors have no competing interests to declare that are relevant to the content of this article.
References↩︎
Corresponding author↩︎