Comparing Architectures for Supervised Political Scaling
July 01, 2026
Abstract
Text scaling, the task of positioning political actors on an ideological scale, is a fundamental task in political analysis. To ease the need for manual analysis, various NLP methods have been proposed for this task, including classification- and regression-based approaches, showing successes as well as limitations. The goal of our paper is to consolidate the state of the art in this area. We ask two questions: (a) Can the performance of scaling methods be improved by predicting scales not individually but jointly? (b) Is there a middle ground between classification and regression?
1 Introduction↩︎
Text scaling, the task of extracting the stances of political actors from written documents or speeches and mapping them to scores on an ideological axis, is a fundamental task in political text analysis [1]. Representing party positions in this way allows to quantitatively measure the differences between them, which is instrumental in understanding voters’ behavior during an election as well as the parties’ strategies once in office [2].
Determining a gold standard for party positions is challenging. Probably one of the best-known sources, based directly on querying experts, is the Chapel Hill Expert Survey [3]. An alternative approach was chosen by the Manifesto Research on Political Representation (MARPOR) project1. Grounding party positioning directly in texts, MARPOR has collected over 3200 manifestos (regarded as the most comprehensive source on party policy) and annotated political statements in them according to a fine-grained ontology. Overall party positions can then be obtained by aggregating category frequencies (see Section 2 for details). The most well-known scale arising from this work is RILE, or the Standard Right-Left Scale, reflecting mainly positions on economic policy [4], [5].
To alleviate the cost of gold standard creation, the scores can be estimated automatically with the help of NLP methods. Early word frequency-based statistical methods [1], [6] already revealed the potential of computerized approaches for estimating party positions. Later, those results were extended and improved upon by methods from distributional semantics [7], [8], Transformer-based sentence embeddings [9], [10] and large language models (LLMs) [11].
The results of these studies are encouraging but still far from perfect, unveiling that the task of political scaling, as approached generally, suffers from two interrelated problems. The first is document length: Political documents, such as election manifestos, tend to comprise thousands of sentences. Thus, they are too long for current Transformer models to process in one and need to be subdivided in some manner. The second is single-scale prediction: Despite the broad consensus in political science that multiple scales are necessary to adequately capture party positions [12], most computational work focuses on positioning on single scales (mostly RILE). As a result, models arguably need to learn to ignore a lot of information in the input instead of using it to their advantage.
To address these shortcomings, we systematically compare the performance of different approaches, focusing on two research questions:
The GAL-TAN, ranging from the Green-Alternative-Liberal to the Traditional-Authoritarian-Nationalist extreme [13], captures socio-cultural views that complement RILE’s economic perspective. Still, to our knowledge, there is no work on predicting GAL-TAN positions. What is more, despite being orthogonal in theory, the empirical RILE and GAL-TAN scores are often found to be interdependent. Left-wing parties gravitate toward GAL social policies, and right-wing views tend to co-occur TAN ones, whereas the remaining two combinations are much less frequent [14]–[16]. On this basis, we investigate whether joint models for predicting RILE and GAL-TAN together can improve results.

Traditional studies followed the MARPOR methodology in building a pipeline that first classifies individual sentences and then aggregates class frequencies into scale positions (label aggregation). [10] also trained transformers to directly predict scale positions with a regression head, but still had to divide the input into smaller chunks for processing (chunk-level regression). The trade-off between the two approaches remains underexplored. Notably, the chunk size is a crucial (hyper-)parameter for this approach which has not been investigated.
Figure 1 shows the resulting experimental design. We find for RQ1 that GAL-TAN can be predicted about as well as RILE, but that joint prediction does not improve performance. For RQ2, we establish that chunk size, somewhat surprisingly, matters rather little as far as performance is concerned, creating a continuum between regression and classification. We will make our code available.
2 Methods↩︎
2.1 Label Aggregation↩︎
Mimicking a simplified version of the MARPOR coding scheme, label aggregation [10] predicts the RILE score via sentence classification. A pre-trained Transformer encoder generates a sentence embedding to be fed to a classification head, which outputs one of the labels Right, Left or Other. The model is trained with cross-entropy loss. The gold standard categories are derived from fine-grained MARPOR sentence annotations in accordance with the literature [4], [13]. Using Eq. (1 ), the sentence-level predictions are aggregated into manifesto-level positions between -1 (extreme left) and +1 (extreme right): \[\label{eq:rile} RILE = \frac{R - L}{R + L + O }\tag{1}\] where \(R\), \(L\) and \(O\) are the number of sentences with the categories Right, Left and Other, respectively.
This approach can be extended to the GAL-TAN score estimation by replacing the RILE-specific categories with (G)AL, (T)AN and (O)ther, and aggregating the predictions using the equation (2 ).
\[\label{eq:galtan} GAL-TAN = \frac{G - T}{G + T + O }\tag{2}\] We refer to this method as label aggregation individual prediction, as it estimates RILE and GAL-TAN independently from each other.
2.2 Chunk-Level Regression↩︎
Alternatively, the prediction tasks can be operationalized as regression, where a model maps a manifesto directly to a score in the range \([-1, 1]\) [10]. While there is continuous research on robustly processing long inputs [17], the context window of the modern state-of-the-art Transformer encoders is nowhere near large enough to fit a whole manifesto. Nonetheless, some encoders allow inputs of up to 8192 tokens [18], or over 650 MARPOR sentences, and therefore can approximate direct prediction with chunk-level processing. Specifically, the given manifesto is split into chunks of the maximum allowed length, after which a pre-trained encoder generates chunk embeddings, and a regression head trained on top outputs per-chunk scores. The model is trained with MSE loss, with the gold standard scores for a chunk calculated by aggregating the sentence labels (Eq. 1 ) within the given chunk. For inference, the score of a whole manifesto is estimated as the average of the scores of its constituent chunks. Similarly to label aggregation, chunk-level regression individual prediction can be employed equally to predict RILE and GAL-TAN scores.
2.3 Joint Modeling↩︎
We experiment with two strategies to move from individual to joint prediction (RQ1).
2.3.0.1 Multitask Training
Among the multitask optimization methods such as multi-objective optimization, adversarial learning or neural architecture search, the one used most widely is scalarization, where the joint loss is a linear combination of the losses for the individual tasks [19]. To apply scalarization to label aggregation and chunk-level regression, each pre-trained encoder is fine-tuned with two classification or regression heads on top, a RILE and a GAL-TAN specific one. The joint prediction loss function is the sum of the individual cross-entropy or MSE functions. The RILE and the GAL-TAN term are assigned equal weights because there is no implicit superiority of one over the other, and they are represented by the same number of data points. Because the RILE and GAL-TAN scores are correlated, multitask training is expected to improve over individual prediction, since the gradient of the encoder weights shows the direction where both the loss terms are minimized.
2.3.0.2 Contrastive Training
As an alternative to multitask training, we jointly train the label aggregation encoders with a contrastive objective. As our object function, we adopt triplet loss [20], which aims to push similar instances close together in the embedding space while driving dissimilar instances apart. This method is used, for example, to tune the SBERT (sentence BERT) architecture [21].
The training data is processed in triplets of an anchor concept \(a\), a positive concept \(p\) from the same class as \(a\), and a negative concept \(n\) from a different class. The triplet loss aims to reduce the distance between \(a\) and \(p\) to zero while increasing the distance between \(a\) and \(n\) to at least \(\epsilon\): \[max(||S_a - S_p|| - ||S_a - S_n|| + \epsilon, 0) \label{eq:triplet-loss}\tag{3}\] where \(S_a, S_p, S_n\) are the vector representations of \(a, p, n\); \(||\cdot||\) is the distance metric. We employ the following two triplet mining strategies:
RILE and GAL-TAN categories: The data points are selected randomly such that \(a\) and \(p\) belong to the same RILE and the same GAL-TAN class while \(n\) differs in at least one of the labels. This sampling strategy perpetuates the idea that the RILE and GAL-TAN categories are interdependent and each combination of them should occupy an isolated cluster in the sentence embedding space.
Party: The triplets are chosen such that the anchor \(a\) and the positive example \(p\) are sentences from manifestos by the same party while the negative example \(n\) is authored by a different one. When fine-tuned on the MARPOR sentences with party-based triplet loss, SBERT showed the best performance on pairwise party similarity estimation [9]. Overall, party-based triplets allow the encoder to learn the general nature of manifesto text, which is helpful for positioning parties on a political axis.
After contrastive tuning, the weights of the encoder are frozen and two classification heads are trained on top to predict the RILE and GAL-TAN categories. In addition, before the embeddings are fed to the classification heads, they are normalized using the whitening transformation [22], which is known to reduce the anisotropy of the embedding and improve performance on various NLP tasks [22], including pairwise party similarity estimation [9].
2.4 LLM Baseline↩︎
Recent work [11], [23], [24] found that LLMs perform comparable to embedding-based approaches on political scaling. We therefore include an LLM in our experiment that implements the label aggregation approach. We prompt an LLM to annotate the given sentence with one of the labels Right, Left and Other, and estimate the manifesto RILE scores using Eq. (1 ). GAL-TAN individual prediction is approached analogously. We evaluate joint prediction capabilities by asking to assign both a RILE and a GAL-TAN category in one prompt. We call this approach a ‘baseline’ because we do not optimize the prompt.
3 Experimental Setup↩︎
3.1 Data↩︎
For our experiments, we adopt the X-time (old-vs.-new) setting from [10]. This dataset primarily tests the generalizability of scaling models over time, from current to future election cycles, in countries seen during training. All models are trained on 1005 MARPOR manifestos for the years 2000–2018 (over 1M sentences). For each individual training setup, 10% of this data is selected randomly and held out for validation. The available data for the years 2019–2023 (147 manifestos, 163K sentences), are used for testing. Data from before 2000 is excluded because of inconsistencies in the annotation.
The model inputs are the translations of the original manifesto text created by [10]2 with Opus-MT models available through EasyNMT.3 [10] compared the use of MT with multilingual models and found almost identical results.
3.2 Label Aggregation↩︎
Following [10], we use a text encoder with a classification head on top. We compare two encoders: SBERT and ModernBERT. The joint versions have two structually identical heads, one per scale (cf. Section 2.3).
3.2.0.1 Classification head.
The classification head is a multi-layer perceptron (MLP) consisting of two layers with the hidden size of 1024 and a tanh activation after the first layer. The output vector is passed through the softmax function to obtain a probability distribution.
3.2.0.2 SBERT
Sentence Transformers [21], or SBERT, is a class of siamese Transformer models optimized for semantic textual similarity tasks. They have been
shown to perform well on political party positioning, with SBERT label aggregation fine-tuned on the MARPOR data scoring the highest on RILE score prediction [10]. Moreover, [9] trained SBERT on MARPOR sentences for pairwise party similarity
estimation, and after the whitening transformation, SBERT embeddings achieved the strongest correlation with the ground truth. For label aggregation, we use all-mpnet-base-v2, an SBERT model based on MPNet [25] that is recommended as the general purpose Sentence Transformer with the highest embedding quality.4 However, due to its small context size, it is not suitable as encoder for chunk-level regression.
3.2.0.3 ModernBERT
ModernBERT [18] is a recent update on the original BERT model [26]. It incorporates rotary positional embeddings (RoPE), pre-normalization blocks and an updated activation function, all established improvements on the original Transformer architecture [18]. The self-attention mechanism at the core of the Transformer architecture is associated with a quadratic computational cost, which ModernBERT addresses by only using global self-attention in every third layer. The rest are local attention layers, where each input token only attends to the tokens close to it. ModernBERT outperforms BERT variants of a similar size and is competitive with bigger, slower variants such as GTE-en-MLM [27] and DeBERTa-v3-large [28]. We use ModernBERT-base in our experiments.5
| Individual | Joint Multitask | Joint Contrastive | |||||
| RILE | GAL-TAN | RILE | GAL-TAN | RILE | GAL-TAN | ||
| 3-4 (lr)5-6 (r)7-8 | SBERT (N23) | 0.88 | - | - | - | - | - |
| SBERT (ours) | 0.88 | 0.83 | 0.87 | 0.84 | 0.83 | 0.77 | |
| ModernBERT | 0.87 | 0.83 | 0.86 | 0.83 | 0.80 | 0.74 | |
| LLM (Olmo 3) | 0.67 | 0.53 | 0.61 | 0.48 | - | - | |
| 3-4 (lr)5-6 (r)7-8 | BigBird (N23) | 0.71 | - | - | - | - | - |
| BigBird (ours) | 0.84 | 0.84 | 0.84 | 0.82 | - | - | |
| ModernBERT | 0.79 | 0.78 | 0.83 | 0.79 | - | - | |
3.3 Chunk-Level Regression↩︎
For chunk-level regression, we combine, again, a text encoder (BigBird and ModernBERT) with a regression head. As before, the joint versions have two structurally identical heads.
3.3.0.1 Regression head.
The regression is the same MLP described above, except that the final softmax layer is replaced with a single tanh-activated unit to obtain predictions in the \(-1\dots1\) range.
3.3.0.2 BigBird
[29] tackled the complexity of the self-attention computation by approximating it with sparse attention, which prunes the set of possible attention links to achieve a speed-up. The resulting model can deal with a context window of 4096 tokens. BigBird was initialized from RoBERTa [30] and further trained on a large web corpus. When evaluated on long-input question answering and long document classification, BigBird set the new state of the art on several datasets and otherwise demonstrated competitive performance. In [10], BigBird was the best out of the evaluated long-input encoder but only scored moderately well compared to the label aggregation setup. BigBird chunks consist of an average of 173 sentences. This means that the mean manifesto length is 6–7 chunks. We use BigBird-base in our experiments.6
3.3.0.3 ModernBERT
ModernBERT employs Flash Attention [31] to extend the original BERT context window of 512 tokens to 8192, which makes it suitable also for long input regression. On average, one chunk of 8192 tokens fits a maximum of 315 MARPOR sentences, and the mean manifesto length is 3-4 chunks. Hence, ModernBERT is expected to perform well as the encoder in both label aggregation and chunk-level regression, allowing for a direct comparison between the approaches on a conceptual level.
3.4 LLM Baseline↩︎
For LLM-based prediction, we use Olmo-3-7B-Instruct [32], one of the few LLMs with a completely open training procedure [33]. We employ it in a zero-shot setting, see Section 2.4 and Appendix 7 for the prompts.
3.5 Evaluation↩︎
To make our results comparable to [10], we measure the RILE and GAL-TAN score prediction quality as Spearman rank correlation coefficient between the predicted and the gold standard scores at the manifesto level. This metric evaluates the ability of the models to correctly rank parties on the scales, rather than absolute positions.
We train each supervised model with 5 random seeds and report the averages of the per-seed evaluation metrics. For the LLM baseline, we sample 5 responses per data point and average the evaluation metrics over the LLM answers. For all pairs of models with \(\leq\)15 percentage points of difference in performance, we test the statistical significance of the difference by running the bootstrap resampling test with \(10,000\) resamples and a \(95\%\) confidence interval [34].
4 Results↩︎

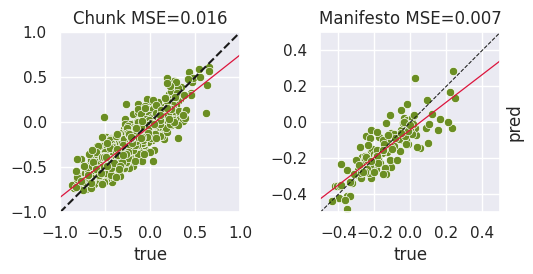
Figure 2: Left: Confusion matrix heatmap: Label aggregation RILE individual prediction with SBERT. Right: Predicted vs. true scatterplot: Chunk-level RILE regression with BigBird (test set, random seed 7)..
4.1 Individual Prediction↩︎
The main results are reported in Table 1. Label aggregation individual prediction with SBERT achieves a very strong correlation of \(\rho=0.88\) on RILE. Our result on RILE is a very close replication of the result by [10].
The GAL-TAN scale is slightly more difficult to predict, with best results around \(\rho=0.83\) to \(0.84\), even if not by a large margin. This may be related to the more complex nature of cultural, as opposed to economic, stances [35], as well as the training data imbalance that is more severe for GAL-TAN than for RILE.
Comparing the different implementations of label aggregation, we note that ModernBERT performs on a par with SBERT on both scales. Zero-shot prediction with Olmo 3 is much less robust than the supervised methods with \(\rho=0.67/0.53\). While it might be possible to improve on these results with more careful prompt engineering, we note that [11] report (linear) correlation scores of a similar magnitude in an experiment with MARPOR data (\(r=0.57\) on Taxes vs. Spending and \(r=0.68\) on the Social axis).7
For chunk-level regression, prediction with BigBird is on a par with label aggregation on GAL-TAN and slightly behind on RILE with \(\rho=0.84\) on both. This is a new qualitative finding, as chunk-level regression with BigBird was reported by [10] to fall behind label aggregation. ModernBERT underperforms BigBird somewhat, however this may be a consequence of our choice to use the maximum chunk size (twice as high for ModernBERT as for BigBird), cf. Section 4.3.
4.1.0.1 Error Analysis.
While the manifesto-level rank correlation is strong, there is still space for improvement at the level of predicted labels. Due to the skew towards the label Other in the training data, label aggregation misclassifies over \(30\%\) of the sentences marked Right, Left, GAL and TAN (see Figure 2, left). The aggregation of the sentence-level predictions according to Eq. (1 ) and (2 ) respectively appears to smooth out the errors, but the resulting manifesto scores suffer from regression to the mean (i.e. zero): They are correct in sign but too small in magnitude. Figure 2 (right) shows that chunk-level regression shows the same effects, which can be interpreted as low model confidence.
4.2 Joint Prediction (RQ1)↩︎
Contrary to our expectations from RQ, joint multitask training does not improve over individual prediction in almost all settings. In the label aggregation setting, joint multitask learning does not have any major effect on the embedding-based model. Prompting Olmo to output labels for both scales jointly even has a clear negative effect.
Contrastive tuning also impedes the quality of the predictions throughout. As shown in App. 8, performance drops further when selecting triplets based on party and while in line with [9], the whitening transformation has an overall positive effect on SBERT, it is detrimental to ModernBERT.
Finally, in the chunk regression setting, joint multitask training leads to slightly worse results for BigBird. While ModernBERT improves slightly with joint multitask training, it still scores lower than BigBird due to its lower starting point.
4.2.0.1 Training dynamics.
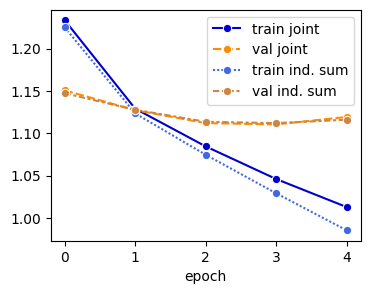
To better understand this negative result, we analyzed the behavior of the RILE and GAL-TAN train and validation losses during training. As Figure 3 shows, the losses behave in the same way as the sum of the losses computed during individual optimization. Therefore, the two objectives appear to neither sabotage nor support each other and are effectively learned separately. We observe very similar behavior for chunk-level regression.
One underlying reason for this might be that the correlation between RILE and GAL-TAN in the training data is too weak for the models to pick up and to capitalize on. Another explanation, however, is a ceiling effect, i.e., the individual predictions are already bounded by the reliability of the data so that better modeling mechanisms cannot further improve the results. Indeed, a MARPOR coder reliability study [36] reports numbers that correspond to a macro-F1 score of \(0.66\) between two human annotators that classify sentences into the RILE categories Right, Left and Other. This is coincidentally the exact performance achieved by SBERT on the classification task (cf. Appendix 8). On GAL-TAN, the model’s macro-F1 is \(0.67\) whereas the human estimate is \(0.61\). These correspondences make an interpretation as a ceiling effect plausible, even though the limited data available on inter-rater agreement does not allow us to draw strong conclusions.
4.3 Long Input Documents (RQ2)↩︎
Our ModernBERT encoder is suitable for both label aggregation-based and for regression-based prediction of party positions (cf. Section 3). However, a notable result from Table 1 is that ModernBERT performs substantially better for label aggregation by a margin of 5-8 points in rank correlation. This may be due to the model becoming less robust with longer inputs, or due to the difference between classification and regression as tasks. To investigate the trade-offs between the two task formulations, we vary the chunk sizes for joint ModernBERT-based chunk-level regression on a logarithmic scale from \(n\)=1 to around \(n\approx300\) sentences on average, covering the full range of the possible input length (see App. 7 for details). Each model is trained once with the random seed 7.
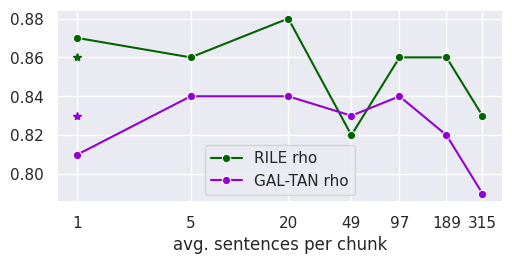
Figure 4 presents the results.8 Strikingly, the models score in the same range regardless of the chunk size, namely \(\rho\)=0.82–0.87 on RILE and \(\rho\)=0.79–0.84 on GAL-TAN. The bootstrap test shows that all the models are statistically on a par.
4.3.0.1 Classification-Regression Continuum.
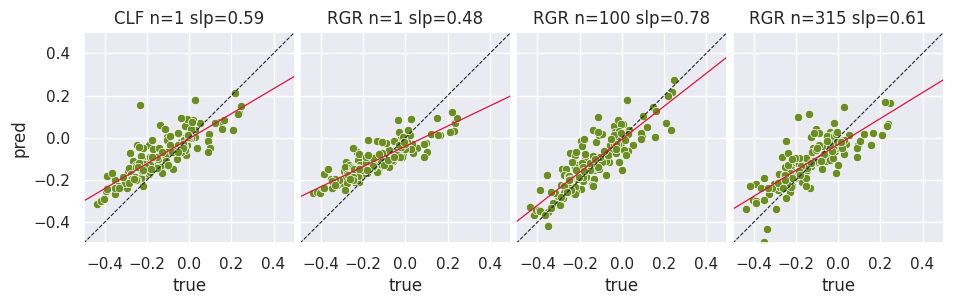
Note that for the chunk size \(n=1\) sentence, the regression model is trained to predict \(-1\), \(0\), or \(-1\), depending on the class of the sentence. This is very similar to the training task of the label aggregation setup, only with a regression instead of a classification head. Thus, ModernBERT can be seen as supporting a continuum between classification and regression. This does not mean that the results are exactly the same, though: Regression with chunk size \(n\)=1 is numerically on a par with label aggregation on RILE (0.87 vs. 0.86) but slightly worse on GAL-TAN (0.81 vs. 0.83). Indeed, the regression is less precise on just \(n\)=1 sentence per chunk than on max. \(n\)=100 (97 on average): MSE \(=0.23/0.15\) (RILE/GAL-TAN) for \(n\)=1 vs. MSE \(=0.022/0.016\) for \(n\)=100 at the chunk level. As discussed in Section 4.1, performance levels out once the chunk estimates are averaged to represent full manifestos, producing MSE \(=0.009/0.007\) for \(n\)=1 and MSE \(=0.006/0.006\) for \(n\)=100 at the manifesto level.
Another drawback of small chunk sizes is a strong regression to the mean: For most manifestos, their distance from the neutral value is underestimated. Figure 5 shows this by plotting predicted against gold manifesto RILE positions (the picture is the same for GAL-TAN). In these scatterplots, ideal predictions would lie along a regression line with slope 1; slopes below 1 indicate underestimation. As the Figure shows, both classification and regression suffer from underestimation. For the regression models, a medium chunk size of \(n\)=100 obtains the overall highest slope of 0.78, indicating that this model more accurately approximates not only the gold standard ranking but also the absolute values of positions. For very large chunk sizes, both correlation and slope decrease, indicating that models still struggle to extract information reliably from very large contexts [37].
Taken together, these results indicate that regression-based direct prediction of positions on political scales provides an alternative to label aggregation. While the performance is surprisingly constant across chunk sizes, it degrades somewhat for the largest chunk sizes, indicating that current models are still not ideally equipped to analyze very large contexts. At the same time, very small chunk sizes suffer from regression to the mean, indicating that medium context sizes (20–100 sentences per chunk) are the most robust choice.
5 Related Work↩︎
Early work on automating political scaling relied on word frequencies for supervised [1] and unsupervised [6] estimation of party positions. Once NLP shifted to distributional semantics, [7] employed word embeddings for unsupervised analysis of multilingual data, computing pairwise party similarities and rescaling them to obtain positions on an axis. This line of work was continued by [8] and [38].
More recently, encoder-only Transformer models have been used for pairwise party similarity estimation, overall [9] and within policy domains with the aid of a sentence domain classifier [39]. [40] fine-tuned BERT to predict fine-grained MARPOR sentence labels, improving the performance on infrequent classes with hierarchical classification.
The success of LLMs on various NLP tasks [41] has called for research on their applicability to political scaling. [23] queried state-of-the-art closed-source LLMs to map a given sentence to a position on a economic or social axis, achieving strong correlation with the expert and crowd-sourced gold standard. [11] ensembled the predictions of several zero- and few-shot closed-source LLMs which were prompted to summarize long inputs first and then scale them. The results show strong correlation with expert positions but moderate correlation with the MARPOR ground truth.
6 Conclusions↩︎
In this paper, we have systematically evaluated embedding-based approaches to party positioning based on election manifestos. Our study was carried out on a sample from the MARPOR corpus corresponding to generalization from past to future election cycles. We considered two approaches, label aggregation and chunk-level regression, and focused on comparing them, establishing two main findings:
First, joint prediction of party positions on the RILE and GAL-TAN scales does not improve prediction quality. While this is at first glance a disappointing result, we found that the performance of our non-joint models already approaches a plausible ceiling arising from inter-annotator disagreement. It would be worthwhile, in future work, to test joint modeling approaches in more challenging scenarios, such as generalization to new countries [10] or party position prediction based on less data – modeling situations where approaches based on domain knowledge tend to help [40].
Second, ModernBERT-based chunk regression offers a viable alternative to label aggregation in political positioning, in particular when medium chunk sizes (20-100 sentences) are chosen. This result is at the same time encouraging and disappointing: while it is conceptually more elegant to directly predict positions without an intermediate labeling step, and the regression approach models the actual score distribution better than the classification approach, the decreasing performance for the longest chunks indicates that manifestos are still too long for current transformer LMs to obtain good end-to-end learning results. An interesting direction for future work follows from the realization that chunk-level regression models do not require gold standard annotation at the sentence level for training. This raises the question of whether the detailed MARPOR annotation could be replaced by a continuous position annotation at the chunk level, possibly framed as a ranking task [42].
Limitations↩︎
Our study only investigated a single, comparatively simple setup for political party positioning: generalizing from previous to future election cycles. We also relied on the quality of the MT system used by [10] and did not experiment with multilingual models9. Due to limited resources, we used smaller versions of the pre-trained models, and the hyperparameter search was performed manually.
The LLM approach that we included in our experiments was not optimized regarding its prompt, nor did we set up a few-shot variant; in this sense, it can be considered an unsupervised (or semi-supervised) point of comparison for the fully supervised models that we focused on.
7 Experimental Setup↩︎
7.1 Training Hyperparameters↩︎
Following [10], all supervised models are trained for 5 epochs using the AdamW optimizer [43] with early stopping. The learning rate is \(10^{-5}\) for individual and joint multitask prediction, and \(5 \cdot 10^{-5}\) for training the classification heads after joint contrastive tuning. The margin hyperparameter in the triplet loss function (3 ) is set to \(1\) based on preliminary experiments. Following [9], we use Euclidean distance as the distance metric and employ a linear learning rate schedule with 100 warmup steps. The mini-batch size is 256 for label aggregation, except for contrastive tuning where it is set to 16, and 4 for chunk-level regression.
7.2 LLM Prompts↩︎
7.2.0.1 RILE
Question: What political position is expressed in this statement?
Statement: <sentence>
Option A: Right-wing
Option B: Left-wing
Option C: Neutral
Keep your response short (up to 10 words) by choosing exactly one option!
Correct option:
7.2.0.2 GAL-TAN
Question: What political position is expressed in this statement?
Statement: <sentence>
Option A: Green-Alternative-Liberal
Option B: Traditional-Authoritarian-Nationalist
Option C: Neutral
Keep your response short (up to 10 words) by choosing exactly one option!
Correct option:
7.2.0.3 Joint Prompting
Question: What political position is expressed in this statement?
Statement: <sentence>
Choose exactly one option from each of the two lists below.
List 1 (economic policy):
Option A: Right-wing
Option B: Left-wing
Option C: Neutral
List 2 (socio-cultural policy):
Option D: Green-Alternative-Liberal
Option E: Traditional-Authoritarian-Nationalist
Option F: Neutral
Keep your response short (up to 10 words)!
Correct options:
7.3 Chunk Sizes↩︎
Table 2 gives an overview of the chunk sizes evaluated in the chunk size experiment on ModernBERT joint regression.
| Max. sent. | Avg. sent. | Max. tokens | Avg. tokens | Mini- batch size | Train time / epoch (hh:mm) |
|---|---|---|---|---|---|
| 1 | 1 | 735 | 23 | 32 | 02:40 |
| 5 | 5 | 1568 | 113 | 16 | 01:15 |
| 20 | 20 | 3351 | 451 | 16 | 00:40 |
| 50 | 49 | 4297 | 1117 | 8 | 00:40 |
| 100 | 97 | 5056 | 2206 | 4 | 00:40 |
| 200 | 189 | 8173 | 4281 | 2 | 00:50 |
| 676 | 315 | 8192 | 7153 | 4 | 01:10 |
7.4 Statistical Significance Testing↩︎
Whenever comparing models with less than 15 percentage points of gap in performance, we run the bootstrap resampling test to see if the difference is statistically significant [34]. This test is non-parametric and thus applicable to any metric, including the rank correlation. Given two models \(m_1\) and \(m_2\), the procedure is run as follows.
The test set manifestos are sampled with replacement, the size of each sample the same as that of the original test set. The predictions of \(m_1\) and \(m_2\) for those manifestos as well as the ground truth scores are compiled accordingly.
For each model and random seed, the rank correlation of the predictions with the ground truth is calculated. The resulting values are averaged over the random seeds, producing \(\rho_1\) and \(\rho_2\) to represent \(m_1\) and \(m_2\), respectively. Their difference \(\rho_1 - \rho_2\) is the variable of interest.
The operations in (1) and (2) are repeated \(n=10,000\) times, creating a distribution of \(\{\rho_1 - \rho_2\}\).
The \(2,5\) and the \(97,5\) percentile of that distribution are calculated, producing a \(95\%\) confidence interval \([a,b]\). It is interpreted as follows:
\(0 \in [a,b]\) — \(m_1\) and \(m_2\) perform on a par
\(0 < a\) — \(m_1\) performs better than \(m_2\)
\(0 > b\) — \(m_1\) performs worse than \(m_2\)
8 Extended Results↩︎
8.1 Label Aggregation↩︎
Table 3 presents a detailed evaluation of the label aggregation models, additionally reporting accuracy, weighted F1-score and macro F1-score computed at the sentence classification level. The macro-F1 values are consistently lower than the accuracy and weighted F1 (\(0.75 / 0.82\) vs \(0.66/0.67\)). Yet, among the classification-level metrics, macro-F1 is the most reliable predictor for the manifesto-level rank correlation \(\rho\), which highlights the importance of evaluating all classes equally for a fair view of the model quality.
The SBERT and ModernBERT baselines have the encoder weights frozen and only the classification heads trained during fine-tuning. The baselines reveal that ModernBERT has a weaker starting point but catches up to SBERT when trained for individual or joint prediction. Notably, the SBERT baseline is more robust than the LLM baseline on both RILE and GAL-TAN.
The majority prediction baseline always outputs the label Other, as it is the most prevalent in the training data for both RILE and GAL-TAN. For this method, the rank correlation cannot be calculated, since that requires dividing by the covariance which equals zero for a constant series (all of the manifesto-level estimates equal 1; cf. eq. (1 , 2 )).
| RILE | GAL-TAN | ||||||||
|---|---|---|---|---|---|---|---|---|---|
| 3-10 | acc | w. F1 | m. F1 | \(\bm{\rho}\) | acc | w. F1 | m. F1 | \(\bm{\rho}\) | |
| - | Majority prediction | 0.63 | 0.49 | 0.26 | - | 0.79 | 0.69 | 0.29 | - |
| SBERT | Baseline | 0.70 | 0.69 | 0.58 | 0.72 | 0.80 | 0.79 | 0.58 | 0.68 |
| Individual prediction | 0.75 | 0.75 | 0.66 | 0.88 | 0.82 | 0.82 | 0.67 | 0.83 | |
| Joint multitask | 0.75 | 0.75 | 0.66 | 0.87 | 0.82 | 0.83 | 0.67 | 0.84 | |
| Joint contrast. RLGTwhiten | 0.73 | 0.74 | 0.65 | 0.83 | 0.80 | 0.81 | 0.64 | 0.77 | |
| ModernBERT | Baseline | 0.67 | 0.63 | 0.46 | 0.36 | 0.79 | 0.75 | 0.44 | 0.57 |
| Individual prediction | 0.75 | 0.75 | 0.66 | 0.87 | 0.83 | 0.83 | 0.67 | 0.83 | |
| Joint multitask | 0.73 | 0.73 | 0.65 | 0.86 | 0.82 | 0.82 | 0.65 | 0.83 | |
| Joint contrast. RLGT | 0.75 | 0.74 | 0.64 | 0.80 | 0.82 | 0.82 | 0.64 | 0.74 | |
| LLM (Olmo 3) | Individual prediction | 0.49 | 0.50 | 0.38 | 0.67 | 0.50 | 0.56 | 0.35 | 0.53 |
| Joint prediction | 0.33 | 0.34 | 0.31 | 0.61 | 0.22 | 0.20 | 0.22 | 0.48 | |
8.2 Joint Contrastive Training↩︎
Table 4 allows a more detailed look into joint contrastive training. It achieves the rank correlation of at most \(\rho=0.83\) and \(\rho=0.77\) on RILE and GAL-TAN, respectively. The most robust way to select triplets for training is based on the RILE and GAL-TAN category labels. SBERT–RILE–GAL-TANwhiten and ModernBERT–RILE–GAL-TAN perform on a par in that setting. In particular, layering in the whitening transformation allows SBERT to get a small but statistically significant boost on RILE (\(\rho=0.83\) vs \(0.81\)), whereas on GAL-TAN the difference in \(\rho\) is insignificant. In contrast, the whitening transformation dramatically impairs the downstream classification quality of ModernBERT–RILE–GAL-TAN.
Mining triplets based on party makes for inferior RILE and GAL-TAN classifiers. SBERT–Party, even with the aid of the whitening transformation, scores significantly lower even than the baseline SBERT where only the classification heads were trained. With slightly more success, ModernBERT–Party improves over the ModernBERT baseline on RILE and scores on a par on GAL-TAN. Again, whitening the embeddings causes a decrease in the ModernBERT scores.
| RILE | GAL-TAN | ||||||||
|---|---|---|---|---|---|---|---|---|---|
| 3-10 | acc | w. F1 | m. F1 | \(\bm{\rho}\) | acc | w. F1 | m. F1 | \(\bm{\rho}\) | |
| SBERT | Baseline | 0.70 | 0.69 | 0.58 | 0.72 | 0.80 | 0.79 | 0.58 | 0.68 |
| SBERT joint contrastive | Party | 0.65 | 0.60 | 0.44 | 0.36 | 0.79 | 0.73 | 0.42 | 0.44 |
| Partywhiten | 0.66 | 0.64 | 0.51 | 0.51 | 0.77 | 0.75 | 0.50 | 0.55 | |
| RILE–GAL-TAN | 0.74 | 0.74 | 0.65 | 0.81 | 0.82 | 0.82 | 0.65 | 0.74 | |
| RILE–GAL-TANwhiten | 0.73 | 0.74 | 0.65 | 0.83 | 0.80 | 0.81 | 0.64 | 0.77 | |
| ModernBERT | Baseline | 0.67 | 0.63 | 0.46 | 0.36 | 0.79 | 0.75 | 0.44 | 0.57 |
| ModernBERT joint contrastive | Party | 0.68 | 0.64 | 0.49 | 0.54 | 0.79 | 0.76 | 0.48 | 0.58 |
| Partywhiten | 0.66 | 0.61 | 0.44 | 0.41 | 0.79 | 0.74 | 0.44 | 0.49 | |
| RILE–GAL-TAN | 0.75 | 0.74 | 0.64 | 0.80 | 0.82 | 0.82 | 0.64 | 0.74 | |
| RILE–GAL-TANwhiten | 0.63 | 0.49 | 0.26 | 0.17 | 0.79 | 0.69 | 0.29 | 0.08 | |
8.3 Chunk-Level Regression↩︎
The chunk-level regression models are additionally assessed on the MSE value at the manifesto level. Its dynamics mostly correspond to those of the rank correlation score.
| RILE | GAL-TAN | ||||
|---|---|---|---|---|---|
| 3-6 | MSE | \(\bm{\rho}\) | MSE | \(\bm{\rho}\) | |
| BigBird | Baseline | 0.018 | 0.61 | 0.015 | 0.58 |
| Individual prediction | 0.008 | 0.84 | 0.006 | 0.84 | |
| Joint multitask | 0.009 | 0.84 | 0.007 | 0.82 | |
| ModernBERT | Baseline | 0.024 | 0.45 | 0.015 | 0.33 |
| Individual prediction | 0.009 | 0.79 | 0.007 | 0.78 | |
| Joint multitask | 0.013 | 0.83 | 0.008 | 0.79 | |
References↩︎
Previously known as the Comparative Manifesto Project (CMP), https://manifestoproject.wzb.eu/↩︎
https://sbert.net/docs/sentence_transformer/pretrained_models.html#original-models↩︎
The results in Tab.1 adopt the largest chunk size (\(n\)=315).↩︎
A verified English translation of the MARPOR data has since become available. https://manifesto-project.wzb.eu/information/documents/translation↩︎