Office Comprehension Benchmark
May 29, 2026
We introduce Office Comprehension Bench (OCB), the first public benchmark to jointly evaluate LLM systems on Word, Excel, and PowerPoint comprehension over native file formats (.docx, .xlsx, .pptx)
and their variants. OCB consists of two tracks. File Fidelity Q&A tests structural and visual perception of office artifacts - tables, charts, embedded images, formulas, and app-specific elements such as headers, speaker notes, and
named ranges. Domain Q&A tests expert-level reasoning grounded in real-world industry documents across 12 professional domains, with queries requiring multi-step analysis and synthesis across documents. Each reference answer is
decomposed into atomic, binary-gradable claims, and an ensemble of LLM judges scores responses against each claim independently. Even the strongest frontier system in its default reasoning mode reaches only \(\sim\)59.3% on
Domain Q&A; increasing thinking depth within a tier does not move performance materially, while moving to a higher product tier yields modest gains. We release the dataset, evaluation tooling, judge prompt, and a public leaderboard.
Date: May 2026
Data: huggingface.co/datasets/microsoft/OfficeComprehensionBenchmark
Code: github.com/microsoft/OfficeComprehensionBench
1 Introduction↩︎
Office documents are a primary medium for knowledge work, combining free-form text, structured tables, embedded images, charts, and application-specific constructs (e.g., slide layouts, document styles, and spreadsheets with formulas). Despite rapid
progress in large language models (LLMs), rigorous evaluation of office comprehension remains limited. Office tasks often require grounded reading over a file, multi-step reasoning over heterogeneous structure, and adherence to precise output formats. We
introduce Office Comprehension Bench (OCB), a benchmark suite covering Word, Excel, and PowerPoint comprehension over native file formats (.docx, .xlsx, .pptx) and their variants. To
our knowledge, OCB is the first public benchmark to jointly evaluate comprehension over all three Office applications in their native file formats under a unified evaluation methodology. OCB consists of two complementary evaluation tracks:
File Fidelity Q&A - 240 files, 902 queries, and 1,305 atomic assertions evaluating whether a system can accurately perceive structural and visual content (tables, charts, images, slide layouts, formatting).
Domain Q&A - 64 files, 120 queries, and 5,414 atomic assertions evaluating expert-level comprehension across 12 industries (finance, healthcare, manufacturing, accounting, energy, government, education, and others). Domain queries require multi-step domain reasoning and synthesis across documents; a single response may produce dozens of independently verifiable claims.
OCB is comprehension-only by design and is complementary to agentic benchmarks that grade automation workflows or work-product creation (e.g., OfficeBench [1], OdysseyBench [2], GDPval [3]), since reliable comprehension is a prerequisite for trustworthy automation and authoring.
We release the dataset, evaluation tooling, an official LLM-as-a-judge accuracy prompt, and a public leaderboard reporting results for OpenAI GPT-5.5 Thinking, Anthropic Claude Opus 4.7, and Google Gemini 3.1 Pro.
All systems are evaluated through their public web chat interfaces rather than via API, because that is the deployment surface where real users interact with Office files. The unit of evaluation we care about is the deployed system, which jointly handles native file parsing and downstream reasoning, not the underlying language model in isolation. Reported scores therefore reflect the deployed system (including provider-side scaffolding such as system prompts and tool routing) during the evaluation window.
1.0.0.1 Contributions.
The first public benchmark for native Office comprehension. OCB jointly covers Word, Excel, and PowerPoint in their native file formats (
.docx,.xlsx,.pptx) and their variants under a unified two-track design: a File Fidelity track with an object-centric artifact taxonomy (\(\sim 1.4\) assertions/query) for structural and visual perception, and a Domain Q&A track (\(\sim 45\) assertions/query) for expert-level analytical reasoning across 12 industries. Existing benchmarks address narrower slices: document images (DocVQA [4]), rendered slides (SlideVQA [5]), charts (ChartQA [6]), PDFs (MMLongBench-Doc [7], GDP.PDF [8], OfficeQA Pro [9]), spreadsheet manipulation (SpreadsheetBench [10]), or work-product generation (GDPval [3]).A scalable methodology for open-ended evaluation. Reference answers are decomposed into atomic, binary-gradable claims authored and reviewed by domain experts, then scored by a three-judge LLM majority vote. We also report empirical learnings on what makes assertions LLM-evaluable: human authors reliably produce correct answers, but require iteration to produce atomic, unambiguous, non-redundant claims. We contribute a failure-mode taxonomy of recurring rubric-quality issues (duplicate, compound, ambiguous, overly broad, structural, and prompt-restating assertions), with worked examples and detection signals in Appendix 16.
Empirical findings on frontier-system limits. We evaluate Claude 4.7 Opus, GPT-5.5 Thinking, and Gemini 3.1 Pro on a public leaderboard. Frontier systems plateau at \(\sim\)59.3% on Domain Q&A in their default reasoning modes. Within a model family, increasing thinking depth alone does not move performance materially; moving to a higher capability tier (e.g., GPT-5.5 Pro) does yield gains, though even the strongest configuration we evaluate (GPT-5.5 Pro-Extended) reaches only \(\sim\)63%. Per-application and per-industry breakdowns reveal specific failure modes, e.g., mixed Word\(+\)Excel inputs and reasoning over Supply Chain, Corporate Governance, and Accounting documents are systematically the hardest settings.
2 Benchmark Overview↩︎
OCB is structured as two complementary tracks: File Fidelity Q&A, which tests whether a system can accurately perceive structural and visual content of Office files; and Domain Q&A, which tests expert-level comprehension and reasoning grounded in real-world industry documents. Together, the two tracks span the spectrum from fine-grained file-format understanding to multi-step professional analysis. All evaluations assume LLM systems are given the full file as input rather than only extracted text, so they are responsible for parsing the file and reading both textual content and visual layout.
2.1 Dataset Composition↩︎
Table 1 summarizes the scale of each track.
| Track | App | Files | Q | Asn. | Asn./Q |
|---|---|---|---|---|---|
| File Fidelity | Word | 78 | 383 | 492 | 1.28 |
| File Fidelity | Excel | 116 | 281 | 508 | 1.81 |
| File Fidelity | PowerPoint | 46 | 238 | 305 | 1.28 |
| File Fidelity | Total | 240 | 902 | 1,305 | 1.45 |
| Domain Q&A | All apps | 64 | 120 | 5,414 | 45.12 |
3pt
The tracks differ substantially in evaluation density: File Fidelity queries are scoped to a single artifact (1–2 atomic assertions each), while Domain Q&A queries are open-ended professional analyses where a single response may produce dozens of independently verifiable claims. The \(120\) Domain Q&A queries split across input file types as: Word (\(35\)), Excel (\(29\)), PowerPoint (\(41\)), Word\(+\)Excel (\(8\)), and Word\(+\)PowerPoint (\(7\)). Appendix 12 provides one worked example from each track.
2.2 File Fidelity Artifact Taxonomy↩︎
For the File Fidelity track, we use an object-centric taxonomy that labels each query by the document artifact it targets. High-level categories include text (paragraphs, bullets, headings, notes), images, tables, charts (plots, legends, axes, embedded tables), layout (slide/page structure, spatial grouping), and Excel formulas with cross-cell/sheet dependencies. Each query is labeled with one or more categories; the full per-application taxonomy is in Appendix 19.
2.3 Domain Coverage↩︎
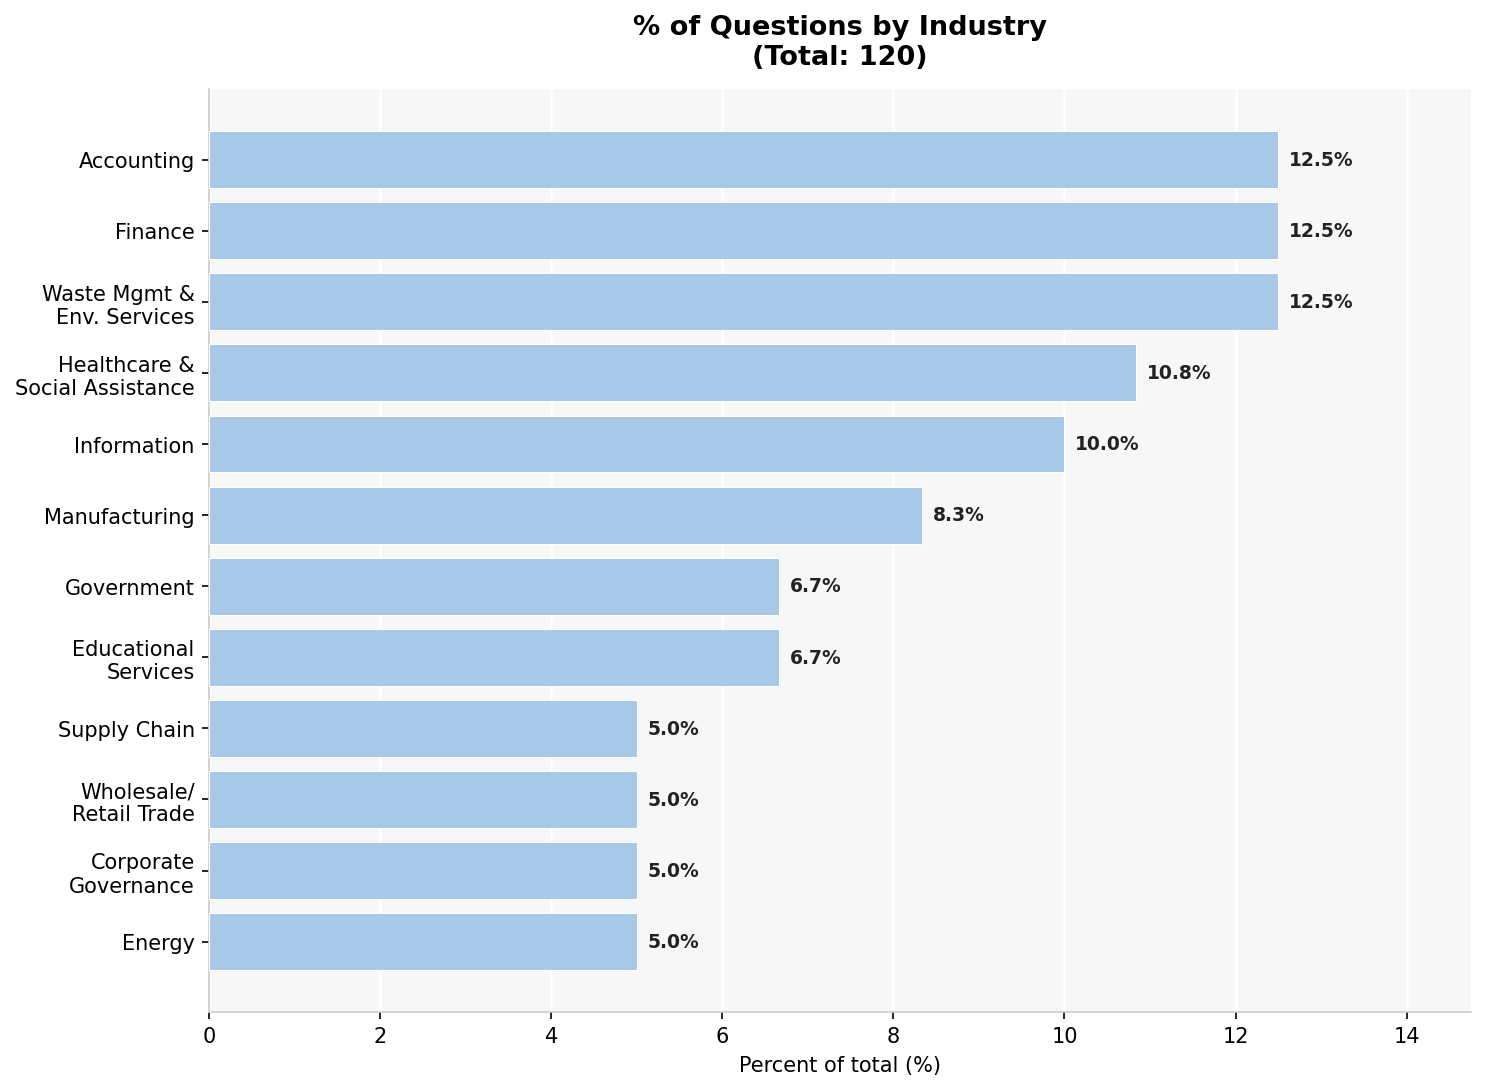
The Domain Q&A track currently spans 12 industries with queries distributed fairly evenly (per-industry shares range from \(5.0\%\) to \(12.5\%\) of the \(120\) queries; see Appendix 15.0.0.1, Figure 8). Coverage is roughly balanced rather than weighted by economic contribution; weighting by GDP contribution is left to future work.
3 Construction Methodology↩︎
Both OCB tracks are built with parallel four-stage pipelines: source curation, question authoring, rubric construction, and quality assurance. Each pipeline combines human experts with LLM assistance and ends in human-adjudicated review. The tracks differ in source-document strategy, who originates questions, the granularity of reference assertions, and the QA loop. Table 2 summarizes the contrast; the full per-track pipelines are in Appendix 14.
| Domain Q&A | File Fidelity Q&A | |
|---|---|---|
| Source documents | Real industry artifacts (SEC filings, slide decks, spreadsheets, ops docs); curated by experts | Broad public pool (Fortune 500 filings, government, educational); filtered + coverage-targeted across taxonomy |
| Question authoring | Expert-drafted from curated sources | LLM-generated with artifact-targeted prompts, human-curated/edited |
| Scale | 64 files, 120 queries, 5,414 assertions (\(\sim 45\)/query) | 240 files, 902 queries, 1,305 assertions (\(\sim 1.4\)/query) |
| Rubric construction | Atomic assertions via 3 authorship variants (independent, derived, cross-org) | Atomic assertions derived from the reference answer |
| Quality assurance | Independent reviewer distinct from prompt and rubric authors | Two-annotator review with third-annotator adjudication; groundedness filters |
5pt
3.0.0.1 Track-specific construction.
The track-specific differences captured in Table 2 stem from different starting points. Domain Q&A begins with domain experts (Appendix 17) curating authoritative source documents and drafting prompts that a peer practitioner would recognize as realistic. Rubrics are then produced under three authorship variants (independent of the golden answer, derived from it, and cross-organization layered; Appendix 15) to reduce dependence on any single rubric-construction convention. File Fidelity Q&A begins with a broad public file pool, filtered iteratively to cover the per-app artifact taxonomy (Appendix 19). Candidate questions are LLM-generated and human-curated, then verified by automatic groundedness filters and two-annotator review. Both tracks share the same scoring metric (assertion-level accuracy; §4). Each assertion carries an expert-assigned importance weight used only as a secondary signal (Appendix 24). Across both tracks we find that human authors produce strong questions and answers but require iteration to produce atomic, LLM-evaluable assertions; the full failure-mode taxonomy and revision process are in Appendix 16.
4 Evaluation Framework↩︎
4.1 Evaluation Setup↩︎
OCB evaluates whether a system response is factually correct, complete, and grounded in the provided Office documents. Each query is associated with a set of atomic assertions derived from the reference answer; every assertion represents a specific, verifiable claim such as retrieving a value, interpreting a chart element, or computing a quantity from structured data. The same metric applies identically to both tracks.1
Let \(q\) index queries and \(i\) index assertions within a query. Each assertion receives a binary score \(y_{q,i} \in \{0,1\}\). The assertion-level accuracy is \[\mathrm{Acc} = \frac{\sum_{q} \sum_{i} y_{q,i}}{\sum_{q} |A_q|},\] where \(A_q\) is the set of assertions for query \(q\). We also compute a query-level macro-average (each query weighted equally regardless of its assertion count); rankings agree with assertion-level, and the full numbers are in Appendix 23.
4.2 LLM-as-a-Judge↩︎
Atomic claim decomposition has been previously used by FActScore [11]; OCB extends this by combining decomposition with a three-judge majority vote. The atomic-assertion scoring builds on the LLM-evaluator framework introduced by G-Eval [12] and the LLM-as-a-judge paradigm validated at scale by [13]. The three-judge majority vote builds on PoLL [14], which showed that a diverse panel of judges outperforms a single large judge while reducing intra-model bias.
The judge receives the query, the reference assertion, and the system output, but not the source document, since assertions are authored so satisfaction can be determined from the system output alone. The full judge prompt is in Appendix 13. Every assertion is evaluated independently by three judge models invoked via provider APIs: GPT-5.4 Thinking with low reasoning effort, Gemini 3.1 Pro, and Claude Opus 4.6 with default thinking. Holding the judge ensemble fixed makes grading reproducible across runs. The final verdict is the majority vote \(\hat{y}_{q,i} = \mathbf{1}\{\sum_{j=1}^{3} v_j \ge 2\}\) where \(v_j \in \{0,1\}\) is judge \(j\)’s binary verdict.
4.3 LLM Judge Agreement↩︎
The three-judge ensemble (GPT-5.4 Thinking, Gemini 3.1 Pro, Claude Opus 4.6) shows substantial pairwise agreement on assertion-level verdicts on Domain Q&A. Disagreement is concentrated in pairs involving Gemini 3.1, consistent with Gemini applying stricter pass criteria than the other two. A leave-one-out ablation (Appendix 22) shows that every 2-judge subset reaches the same verdict as the full panel on \(78\)–\(89\%\) of assertions, with chance-corrected agreement (Cohen’s \(\kappa\)) of \(0.58\)–\(0.77\). No single 2-judge subset reproduces the full panel, so each judge contributes a non-trivial deciding vote. Combined with the low evaluation-noise variance reported in §4.4, this supports treating the 3-judge majority verdict as a stable measurement. The full inter-judge vote breakdown, LOO ablation table, and observations are in Appendix 22.
4.4 Benchmark Variance Analysis↩︎
To make the leaderboard interpretable under run-to-run noise, we decompose each subject model’s score variance and report a \(95\%\) confidence interval, following the nested-design framework of [15].2 For each subject model we collect \(3\) independent response scrapes from the web interface and grade each scrape \(3\) times with the judge ensemble of §4.3, yielding \(9\) evaluation runs.3
4.4.0.1 Variance decomposition.
We separate run-to-run noise into Evaluation variance (Eval Var), judge wobble with the model response held fixed, and Response-sampling variance (Scrape Var), model wobble across re-runs of the same prompt. We also report Overall variance (Overall Var) (sample SD over all \(9\) runs) as a diagnostic, though it is not the right quantity for a CI because eval reps within a scrape are correlated. The headline \(95\%\) CI is constructed at the scrape level: \[\mathrm{CI}_{95\%} = \pm\,t_{0.025,\,n_s-1}\,\frac{\sigma_{\mathrm{scrape}}}{\sqrt{n_s}},\] where \(n_s = 3\) and \(t_{0.025,\,2}=4.303\). This is a conservative interval reflecting only \(3\) independent response samples per model.
| Model | Accuracy | Overall Var | Scrape Var | Eval Var | \(95\%\) CI (\(\pm\)) |
|---|---|---|---|---|---|
| GPT-5.5 Thinking | \(59.35\%\) | \(0.41\) | \(0.45\) | \(0.15\) | \(\pm 1.11\) |
| Claude Opus 4.7 | \(56.83\%\) | \(0.25\) | \(0.25\) | \(0.15\) | \(\pm 0.61\) |
| Gemini 3.1 Pro | \(45.75\%\) | \(0.36\) | \(0.37\) | \(0.18\) | \(\pm 0.91\) |
3pt
4.4.0.2 Discussion.
Two findings drive how we report results elsewhere. Response-sampling noise dominates judge noise for every model (Scrape Var is roughly \(1.6\times\)–\(3.1\times\) Eval Var), consistent with [17], so evaluation budget is better spent on multiple scrapes than on additional judge re-runs. And the \(95\%\) CIs of the top two models do not overlap (GPT-5.5: \([58.24, 60.46]\); Claude: \([56.22, 57.44]\)), supporting the reported ranking and justifying treatment of GPT-5.5 Thinking and Claude Opus 4.7 as a top tier with Gemini 3.1 Pro clearly separated. Extended discussion is in Appendix 21.
5 Headline Results↩︎
We evaluated Anthropic Claude Opus 4.7, OpenAI GPT-5.5 Thinking, and Google Gemini 3.1 Pro on both OCB tracks using the assertion-level evaluation framework described in §4.
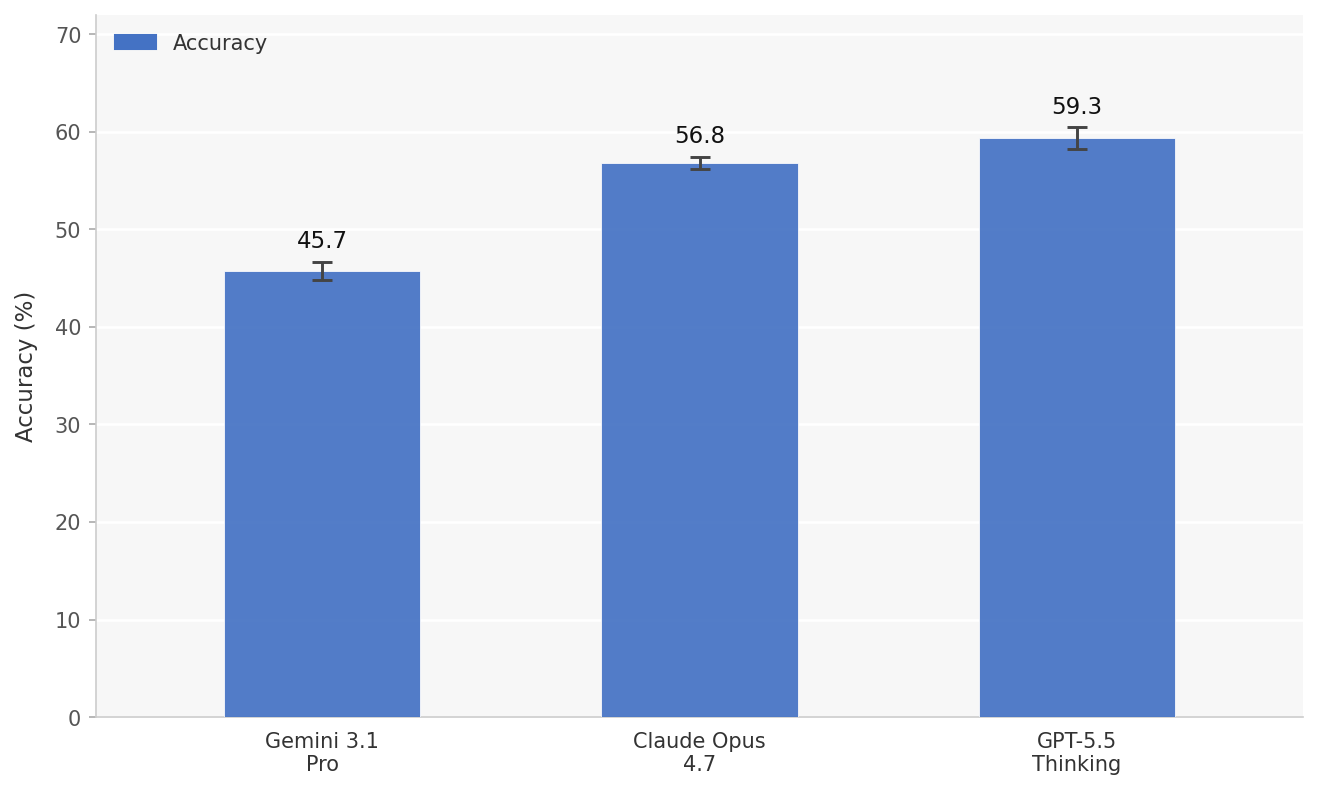
5.0.0.1 Domain Q&A (Figure 1).
GPT-5.5 Thinking achieves the highest accuracy at 59.3%, followed closely by Claude Opus 4.7 at 56.8%, while Gemini 3.1 Pro reaches 45.7%. The top two systems form a tight cluster: their point estimates are separated by \(2.5\) pp, and their \(95\%\) scrape-level confidence intervals are non-overlapping under our \(3\)-scrape protocol with a cushion of \(\sim 0.8\) pp (see §4.4). Given the limited number of scrapes, we describe GPT-5.5 Thinking and Claude Opus 4.7 as a co-leading top tier rather than claiming a decisive separation; Gemini 3.1 Pro trails by roughly \(11\)–\(14\) percentage points, with its CI clearly separated from both top-tier systems.
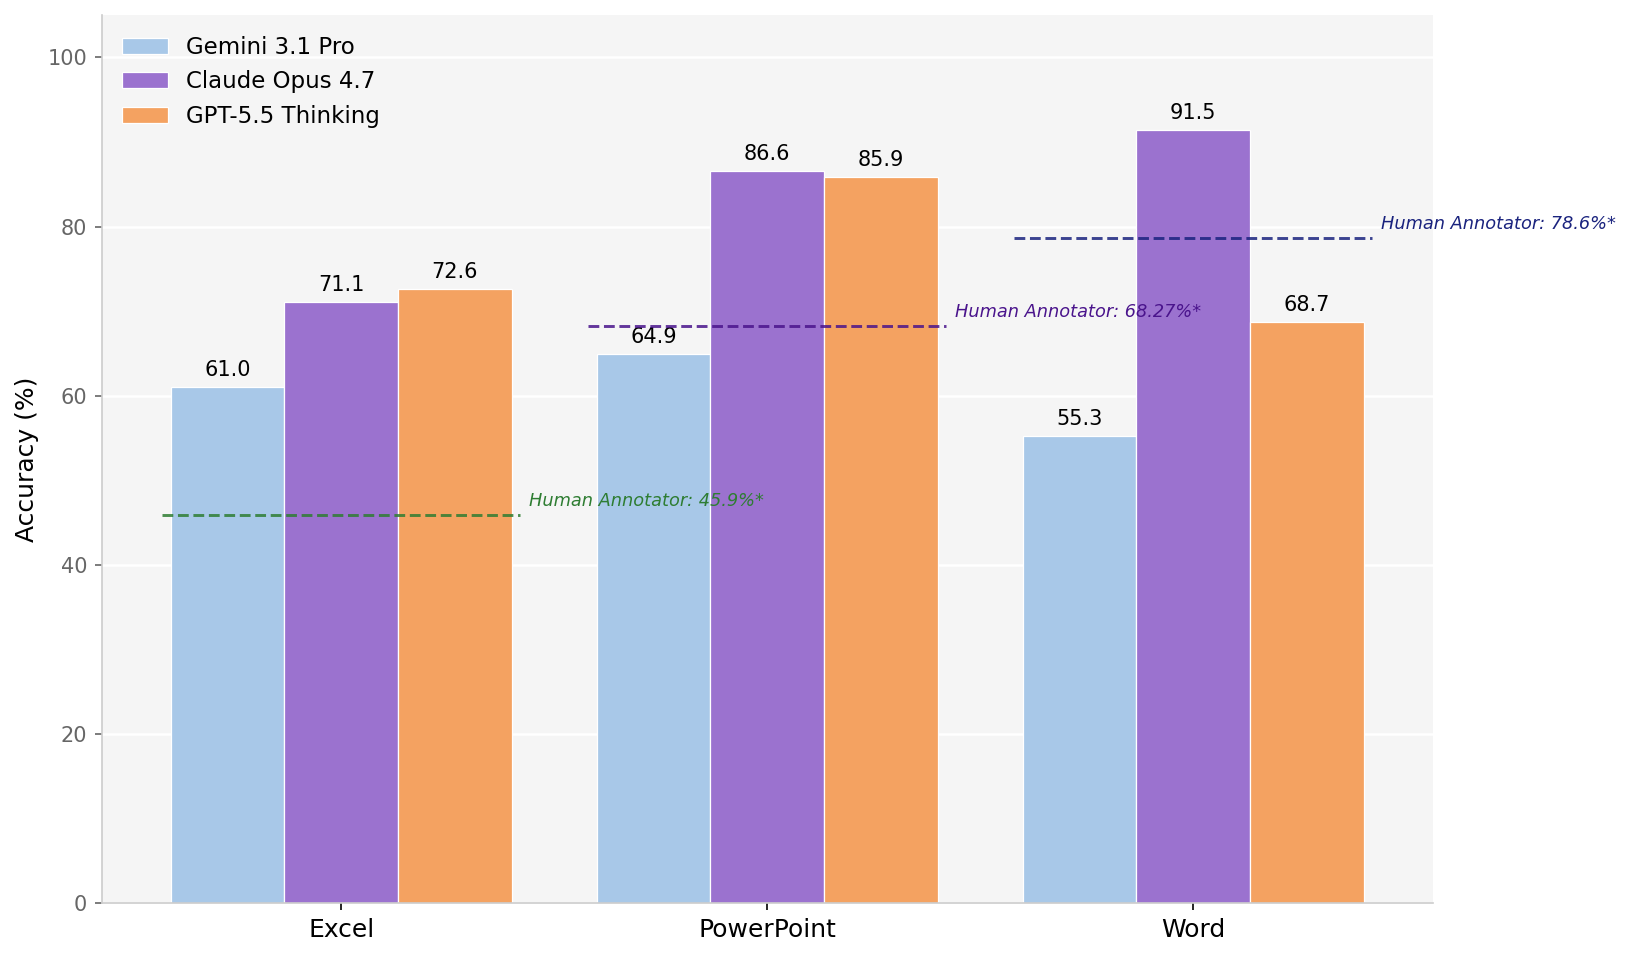
5.0.0.2 File Fidelity Q&A by application (Figure 2).
Performance varies across Excel, PowerPoint, and Word, with no single system dominating uniformly. On Excel, GPT-5.5 Thinking leads narrowly at 72.6%, with Claude Opus 4.7 just behind at 71.1% and Gemini 3.1 Pro at 61.0%. On PowerPoint, Claude Opus 4.7 leads at 86.6%, followed by GPT-5.5 Thinking at 85.9% and Gemini 3.1 Pro at 64.9%. The largest spread appears on Word, where Claude Opus 4.7 reaches 91.5%, substantially ahead of GPT-5.5 Thinking (68.7%) and Gemini 3.1 Pro (55.3%), a 36-point gap between the strongest and weakest systems. Across all three applications, Gemini 3.1 Pro consistently trails the other two systems.
5.0.0.3 Human-annotator reference on File Fidelity.
To anchor File Fidelity scores against a human reference, we collected accuracy from human annotators on a substantial subset of queries per application (\(96.6\%\) of PowerPoint, \(91.9\%\) of Word, and \(76\%\) of Excel). Annotators used the same single-pass setup as the LLM systems. They reached \(78.6\%\) on Word, \(68.3\%\) on PowerPoint, and \(45.9\%\) on Excel (Figure 2, dashed lines). All three frontier systems exceed annotator accuracy on every sub-track: Claude Opus 4.7 leads annotators by \(\sim\) \(13\) pp on Word and \(\sim\) \(18\) pp on PowerPoint, and GPT-5.5 Thinking leads by \(\sim\) \(27\) pp on Excel. The widest model–annotator gap is on Excel, where many queries require quantitative reasoning. LLM systems scan systematically, while one-pass human readers may miss the target. This is evidence that File Fidelity rewards tirelessness and systematic recall, complementary to the synthesis-and-reasoning capabilities probed by Domain Q&A.
Combined with the \(59.3\%\) Domain Q&A ceiling, these results suggest a split capability profile for current frontier systems: super-annotator on artifact-level perception and recall, sub-expert on multi-step analytical reasoning.
6 Per-Application File Fidelity Analysis↩︎
The headline File Fidelity numbers in §5 aggregate across all artifact types within each application, hiding substantial per-artifact variation. To surface this variation, we decompose accuracy across the per-app artifact-type taxonomy of Appendix 19 and document size; the full per-app breakdowns (six figures across Word, Excel, and PowerPoint) and per-size analyses are in Appendix 27. We highlight three cross-app patterns.
6.0.0.1 Claude leads on app-specific structural artifacts.
On Word, Claude Opus 4.7 reaches 100% on Comment, Equation, Hyperlink, and Text, and stays above 80% on most other categories. GPT-5.5 Thinking collapses on a handful of structural artifacts (Hyperlink 6%, Font 17%, Header 17%, Metadata 6%), and Gemini 3.1 Pro is near-zero on Comment, Layout, Header, Footer, Highlight, and Metadata. On PowerPoint, Claude and GPT-5.5 are roughly tied overall (86.6% vs.%), with Claude edging out GPT-5.5 on several structural categories (e.g., Equation 100% vs.%, Metadata 100% vs.%). Gemini falls behind on structure-bound artifacts (Section 0%, Shape/Text 22%, Chart 36%, Metadata 33%). Overall, Claude’s 36-point Word lead over Gemini (91.5% vs.%) and the Gemini PowerPoint shortfall are driven primarily by artifacts that depend on app-specific structural metadata, not by text or table reading. Several called-out PowerPoint categories have small per-bucket query counts (\(n{\leq}10\)) and should be read as illustrative; full per-category bars and \(n\)-counts are in Figure 18.
6.0.0.2 Excel is closer across systems, but Table-Like Ranges remain hard.
All three systems perform comparably on formal Tables (78–86%) and Sheets (88–100%). The hardest artifact across Excel is the Table-Like Range (TLR): contiguous cell ranges not formally registered as Excel Tables, where row/column structure must be inferred. With 133 queries (the largest Excel category), all three systems land in the 48–58% band on TLR. Gemini 3.1 Pro additionally drops to 44% on formulas and 0% on embedded images.
6.0.0.3 File-size effects are app-dependent.
Word performance degrades sharply with length for GPT-5.5 Thinking and Gemini 3.1 Pro (both fall \(\sim\)40 pp from Small to Long), while Claude Opus 4.7 holds 81–96% across size buckets. Excel accuracy improves Small to Medium across all systems, attributable to composition shift (Small workbooks are TLR-heavy, Medium contain more formal Tables) rather than a true size effect; the Long bucket is too small to draw further conclusions. PowerPoint is roughly size-invariant for Claude and GPT-5.5 (85–87%), with Gemini weaker overall.
7 Domain Q&A Analysis↩︎
We now turn from the headline Domain Q&A number to a finer-grained view: where models succeed and fail by industry and file type, and how they fail when they do.
7.1 Performance Across Industries and File Characteristics↩︎
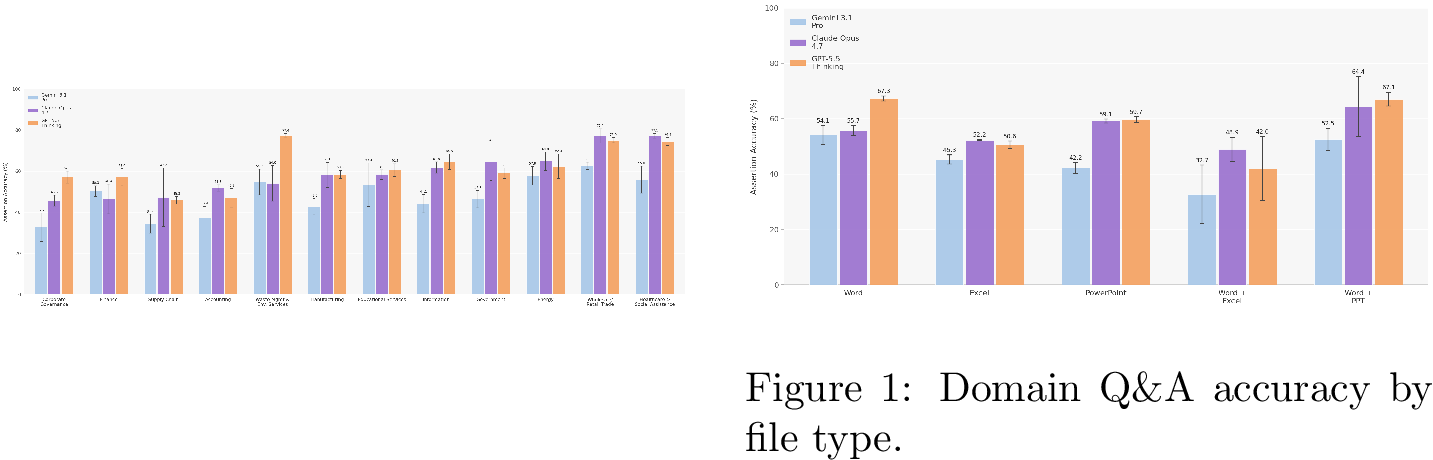
Figures 3 and [fig:filetypes] provide a finer-grained view of performance across industries and document characteristics on the Domain Q&A dataset.
7.1.0.1 Key patterns.
Across industries, Claude Opus 4.7 and GPT-5.5 Thinking are consistently top-tier and Gemini 3.1 Pro trails in nearly every sector. The one exception is Finance, where Gemini 3.1 Pro (50.3%) slightly edges out Claude Opus 4.7 (46.4%) while still trailing GPT-5.5 Thinking (57.0%). Difficulty varies sharply by domain: Healthcare and Wholesale/Retail are relatively strong across systems, while Supply Chain, Corporate Governance, and Accounting remain the hardest. By file type, mixed-input queries (especially Word\(+\)Excel) are the most error-prone, suggesting that heterogeneous structure is a key challenge beyond any single application format.
7.2 Failure Modes↩︎
Beyond aggregate accuracy, qualitative inspection of judge-rejected assertions surfaces four recurring failure modes that account for the majority of errors observed across the three systems.
7.2.0.1 Cross-document sourcing failures.
When the prompt provides multiple source documents, some models drop or mix up values across filings. In one task requesting a table of percent of shares outstanding contacted before and after the annual meeting for two consecutive years, with year-over-year changes in basis points, a model reported the prior-year values as “N/A” despite the proxy statement clearly stating those values.
7.2.0.2 Value hallucinations.
Some models report values that never appear in the source material. In one task asking for a 5-year DCF analysis with specified revenue growth assumptions, a model reported FY2025A revenue as $2,949M; the source 10-K reports the figure as $2,977M, and the substring “2,94” does not appear in the relevant context of the document.
7.2.0.3 Methodology failures.
Even when the prompt explicitly specifies the formula or decomposition to use, some models ignore it and substitute their own assumptions. In one task asking for Passenger Travel Revenue forecast as \(\text{Yield (18\%)} \times \text{RPM}\) for each forecast period, a model used the requested formula but added a 4% annual growth factor that was not specified in the prompt.
7.2.0.4 Computational errors.
Basic arithmetic and ratio errors - wrong numerator, wrong denominator, mis-annualization - are common. In one task asking for operating cash flow per dollar of deferred preneed revenue, a model divided operating cash flow by preneed revenue ($945M / $16B) instead of by deferred preneed revenue ($945M / $1.76B), yielding a result off by roughly an order of magnitude.
These failure modes compound: because rubric assertions often build on prior values (e.g., a ratio whose denominator was sourced incorrectly), a single sourcing or methodology error can cascade across multiple assertions in the same response.
8 Test-Time Compute Ablations↩︎
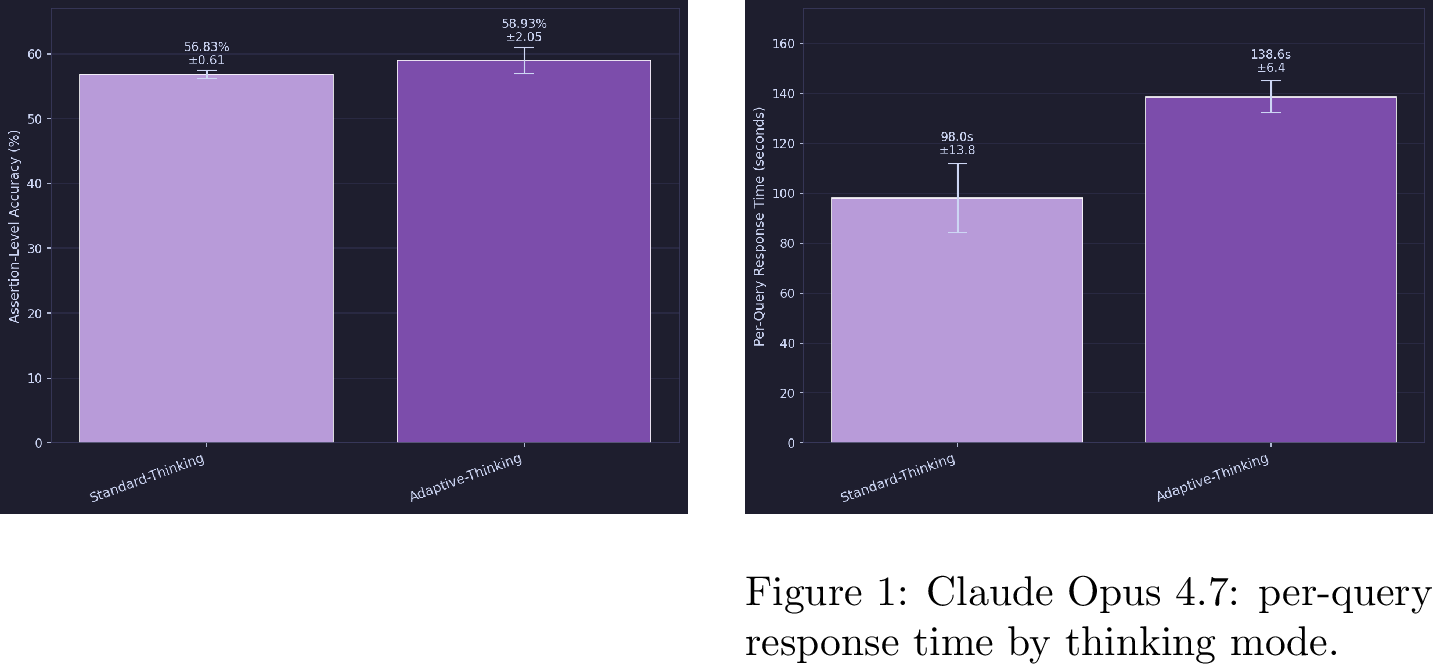
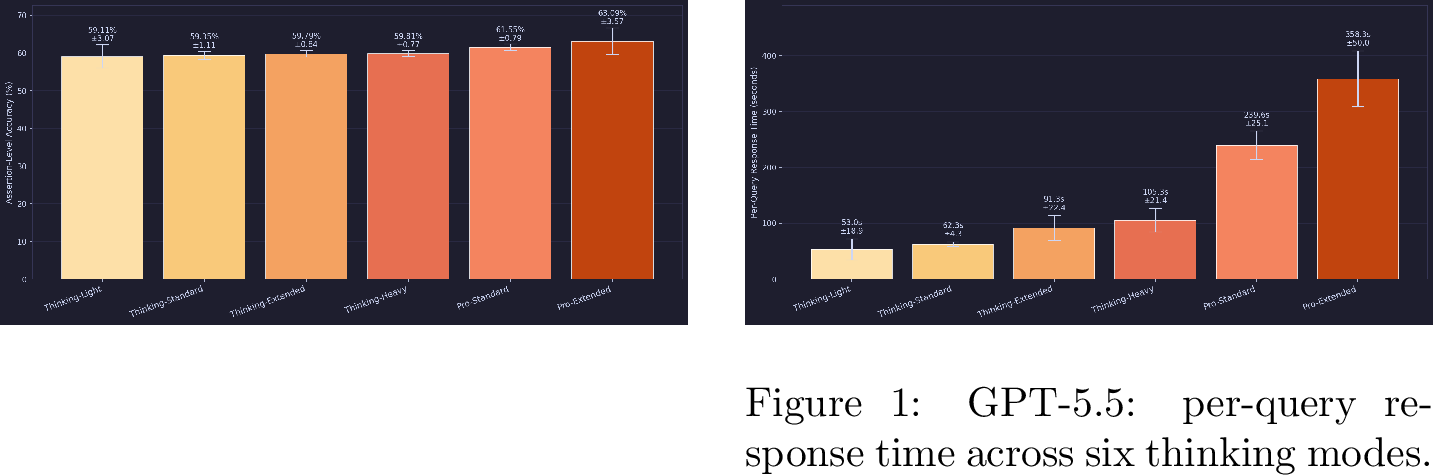
To assess how Domain Q&A performance depends on test-time compute settings, we ablate the two top systems across multiple thinking modes using a two-track protocol. The Standard-Thinking configurations used for the headline results in §5 are evaluated with the full \(3\)-scrape \(\times\) \(3\)-eval design described in §4.4. For all other thinking modes, we use a leaner \(3\)-scrape \(\times\) \(1\)-eval protocol, justified by the small Eval Var observed under Standard-Thinking (Table 3): with judge wobble bounded below \(0.18\) percentage points, additional eval re-runs contribute negligibly to the headline uncertainty, and the evaluation budget is better spent covering more thinking modes. All accuracy CIs in both tracks are constructed at the scrape level using \(t_{0.025,\,2}\cdot\sigma_{\mathrm{scrape}}/\sqrt{3}\), so per-row intervals are directly comparable across the two protocols. For Claude Opus 4.7, we compare Standard-Thinking against Adaptive-Thinking, which dynamically allocates additional reasoning budget. For GPT-5.5, we sweep four thinking depths (Thinking-Light, -Standard, -Extended, -Heavy) and additionally evaluate two higher-tier modes, Pro-Standard and Pro-Extended. The headline GPT-5.5 number in §5 corresponds to Thinking-Standard.
8.0.0.1 Accuracy.
Per-mode accuracies and per-query response times are shown in Figures 4–[fig:gpt-ablation-time]; full numerical results with \(95\%\) scrape-level CIs are in Appendix [app:ablation-table]. Within the GPT-5.5 Thinking series, accuracy is essentially flat (\(59.11\%\)–\(59.81\%\), a \(0.70\) pp spread) and CIs overlap across all four depths. The modes are statistically indistinguishable under our \(3\)-scrape protocol, despite Thinking-Heavy consuming roughly twice the compute of Thinking-Light. Adaptive-Thinking gains \(+2.10\) pp over Standard-Thinking for Claude.
8.0.0.2 Tier vs.depth, and the compute price.
The largest gains come from changing tier rather than depth: GPT-5.5 Pro-Standard reaches \(61.55\%\) and Pro-Extended reaches \(63.09\%\), both above the Thinking series. The Pro-Standard interval marginally separates from the Thinking series under the scrape-level CI (\(\sim 0.2\) pp cushion above Thinking-Heavy’s upper bound), while Pro-Extended’s wider CI overlaps the Thinking-Heavy interval despite a \(\sim 3.3\) pp higher point estimate. Per-query response time scales far faster than accuracy: from Thinking-Light to Pro-Extended is a \(\sim 6.8\times\) increase in latency for a \(3.98\) pp accuracy gain. Net implication: within a model family, increasing thinking depth alone yields no improvement separable from noise under our scrape-level CIs. Switching to a higher capability tier yields a modest gain that separates from the Thinking series for Pro-Standard. Pro-Extended raises the point estimate further, but its wider CI still overlaps Thinking-Heavy. The fact that Pro-Standard separates cleanly from Thinking-Heavy despite only a \(\sim 1.7\) pp absolute gain suggests OCB has the statistical resolution to distinguish configurations within a single model family, not just across families.
9 Related Work↩︎
9.0.0.1 Single-page and single-artifact benchmarks.
Single-page document QA (DocVQA [4], InfographicVQA [18], VisualMRC [19], ST-VQA [20]), chart QA (ChartQA [6], PlotQA [21]), and table QA (WikiTableQuestions [22], TabFact [23], TAT-QA [24], FinQA [25], ConvFinQA [26], MultiHiertt [27]) study
individual artifacts stripped from document context with short or extractive answers. SlideVQA [5] uses rendered slide images;
SpreadsheetBench [10] and SheetCopilot [28] use native .xlsx but evaluate manipulation, not comprehension.
9.0.0.2 Multi-page and enterprise benchmarks.
Multi-page benchmarks (MP-DocVQA [29], DUDE [30], MMLongBench-Doc [7], DocBench [31], LongDocURL [32]) flatten everything into PDF page images. Enterprise-domain benchmarks add genre-locking: FinanceBench [33], OfficeQA Pro [9], GDP.PDF [8], CUAD [34], ContractNLI [35], LegalBench [36], and QASPER [37]; the first three are the closest enterprise comparators to OCB’s Domain Q&A, but all are PDF-rendered.
9.0.0.3 Office-workflow benchmarks.
OfficeBench [1] and OdysseyBench [2] grade automation workflows; GDPval [3] grades work-product creation across 44 occupations via head-to-head human comparison. OCB is comprehension-only and complementary. No prior public benchmark jointly addresses native Office file formats, format-specific metadata, and multi-paragraph analytical comprehension; see Appendix Table 12.
10 Conclusion↩︎
We presented Office Comprehension Bench (OCB), the first public benchmark to jointly evaluate Word, Excel, and PowerPoint comprehension over native file formats. OCB’s two tracks, File Fidelity for structural and visual perception, and Domain Q&A for expert-level reasoning across 12 industries with rubrics scored by an LLM-judge ensemble, show that even the strongest evaluated systems plateau at \(\sim\)59.3% in default reasoning modes on Domain Q&A, with higher product tiers reaching only \(\sim\)63%. On File Fidelity Q&A, by contrast, frontier systems exceed a human-annotator baseline across all three applications, revealing a split capability profile: super-annotator on artifact perception and recall, sub-expert on multi-step analytical reasoning. Robust comprehension across both ends of this spectrum over real-world Office documents remains a fundamentally challenging capability, and we hope OCB accelerates progress toward LLM systems that are accurate, grounded, and robust across the artifacts that define modern office work.
11 Limitations↩︎
OCB is an initial release; we aim to be transparent about its current scope and limitations.
Single-turn evaluation. All queries are evaluated as a single user turn; real-world document work often involves follow-ups and incremental refinement, which we leave to future work.
Comprehension only. OCB evaluates document understanding and reasoning, not actions such as editing files, creating content, or executing workflows. Subject systems may produce intermediate artifacts (e.g., scratch spreadsheets or working notes) as part of arriving at an answer, but those artifacts are not graded; only the final response against the assertion set is scored.
Limited multi-application coverage. Most queries are grounded in a single application’s file format; coverage of mixed inputs (e.g., Word\(+\)Excel, Word\(+\)PowerPoint) is present but limited, and broader combinations of file types within a single query are left to future versions.
Workflow context. Real analytical tasks involve coordination across email, chat, and meetings; OCB does not capture this surrounding workflow, so strong OCB performance may not fully translate to deployment.
Assertion quality. Assertions were authored and reviewed by domain experts, with iteration to split compound claims, remove duplicates, and resolve ambiguities, but are not perfect; we invite community contributions to refine the benchmark.
English only. All queries and documents are in English; multilingual document comprehension is left to future work.
No human baseline on Domain Q&A. We report a single-rater human-annotator baseline on File Fidelity Q&A (§5) but not on Domain Q&A. Without one, the \(\sim\)59.3% Domain Q&A headline is not anchored against a known ceiling; a proper expert-baseline study with multiple raters and inter-rater agreement is planned for future work.
Single-rater File Fidelity baseline. The annotator baseline in Figure 2 uses one rater per query without inter-rater agreement measured, and annotators were trained for general office literacy rather than specialized domain expertise (notably affecting the Excel result, where many queries require quantitative reasoning). The numbers indicate the relative model–annotator standing on routine artifact reading rather than a calibrated ceiling; a larger multi-rater study with domain-matched annotators is left to future work.
Judge ensemble validation. We report inter-judge agreement and a leave-one-out judge ablation (§4.3, Appendix 22), but not judge-vs-human alignment; the latter would require a stratified human-grading study against which to benchmark each judge. The current evidence shows the three LLM judges are not redundant (Cohen’s \(\kappa\) of \(0.58\)–\(0.77\) across leave-one-out pairs) but does not rule out correlated bias relative to human judgment.
Acknowledgements↩︎
We thank our colleagues across Microsoft for valuable discussions and feedback throughout the development of OCB, including Aman Rathi, Utkarsh Nagar, Rachel Hill, Josh Ledgard, Tejas Dixit, DJ Cole, Gaurav Jain, Abhishek Agarwal, Clement Wang, Ryan Adriano, Shobha Venugopal, Siva Mopati, David Conger, Victor Chakraborty, Jeremiah Kim, Julia Kadie, Piyush Behre, Yaw Amoateng, Swetha Ranganath, Archana Saseetharan, and Ankur Gupta.
We thank our data vendors—LinkedIn, Mercor, and Micro1—for providing the domain experts who sourced industry documents, authored the question–answer pairs, and constructed the rubrics with atomic assertions for the Domain Q&A track. We are also grateful to Telus Digital for supporting the File Fidelity human baseline study. We thank Matthew Ip from Microsoft for help with account access, and the team at TCS—Santosh Kalokhe, Zaigham Shaikh, Pavani Boddupalli, Mayank Vijayvargiya, Abhishek Agarwal, Twinkle Vishwakarma, and Antariksha Gupta—for help with identifying source URLs, data scraping, and account access.
Finally, we thank the broader Office and AI research communities, whose prior work on office-document understanding made this benchmark possible.
12 Worked Examples↩︎
To make the difference in evaluation density between the two tracks concrete, we provide one worked example from each.
12.0.0.1 Domain Q&A example – query.
“IQVIA recently reported FY2024 results. The company is evaluating the $6.0B acquisition of ‘HealthDataCo,’ a provider of real-world evidence platforms. Assume the deal closes at the start of FY2025, funded 50% with cash and 50% with new debt.
Base year is FY2024 (HealthDataCo, stand-alone): Revenue $1.5B, EBITDA margin 28%, revenue growth 6% annually. Capex 3% of revenue, depreciation 2% of revenue, tax rate 25%.
Synergy plan:
Cost synergies: $150M in 2025, $250M in 2026, $300M in 2027.
Revenue synergies: $200M incremental revenue in 2026, $400M in 2027, with 40% EBITDA flow-through.
Integration costs: $200M in 2025 ($120M cash, $80M non-cash write-off) and $100M in 2026 ($70M cash, $30M non-cash write-off). Treat non-cash items as excluded from FCF.
Working capital: model based on balance sheet ratios (Accounts Receivable = 12% of revenue, Accounts Payable = 8% of COGS, Inventory = 3% of revenue). Compute year-over-year change in balances as \(\Delta\)NWC.
Present financial figures in millions, rounded to the nearest whole million. Percentages should be rounded to one decimal place.
Tasks:
Calculate HealthDataCo’s standalone Free Cash Flow for 2024, then build a projection of Free Cash Flow pro forma with synergies for 2025–2027. Model revenue, EBITDA, D&A, EBIT, tax, net income, capex, depreciation, integration costs (cash vs.non-cash), working capital (using AR, AP, inventory), and free cash flow. Present free cash flow as a simple bridge from operating profit down to cash generation each year.
Layer in debt funding: $3B new debt at IQVIA’s weighted average interest rate. Model recursive interest expense (interest based on average debt balance). Show impact on net income. Use IQVIA’s FY2024 effective tax rate for the interest tax shield; keep the 25% tax rate for HealthDataCo operating taxes.
Compute ROIC (2027) as NOPAT (2027) divided by average invested capital across 2026–2027. Define invested capital as $6,000M plus the working-capital balance tied to revenue synergies (cumulative). Exclude goodwill and any debt tax shield. Calculate EVA (2027) using WACC = 8.0% and the same average invested capital used for ROIC.”
12.0.0.2 Source file.
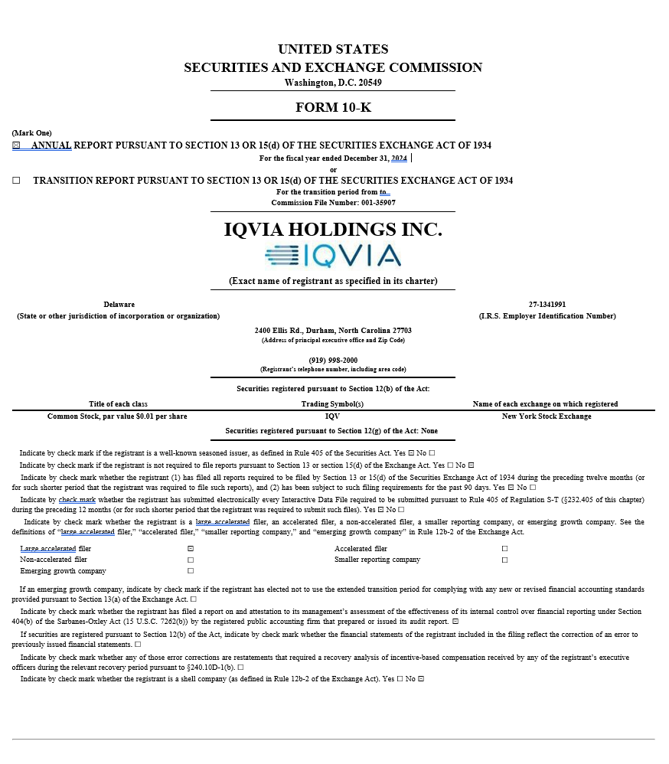
IQVIA Holdings Inc.Form 10-K for the fiscal year ended December 31, 2024, used to source IQVIA’s weighted average interest rate and effective tax rate. HealthDataCo is a hypothetical target whose stand-alone financials and synergy plan are stated directly in the prompt.
12.0.0.3 Selected reference assertions.
A single response to this query can verify on 49 atomic assertions. Examples include:
States Base Year (2024) Revenue as $1,500M.
Calculates Base Year (2024) EBITDA as $420M (range: $400M–$440M).
Calculates Base Year (2024) Tax @ 25.0% as $98M (range: $93M–$103M).
Calculates Base Year (2024) NOPAT as \(\approx\)$293M (range: $278M–$308M).
Identifies the interest rate basis as IQVIA’s weighted average interest rate (\(\approx\)4.69%).
Models interest expense on new debt as (IQVIA weighted average rate) \(\times\) average debt balance; computes \(\approx\)$141M.
[…approximately 43 additional atomic assertions]
This illustrates why Domain Q&A averages \(\sim\)45 assertions per query: a single realistic professional analysis produces a structured multi-paragraph response with many independently verifiable claims, spanning factual extraction, multi-step computation, and synthesis under stated assumptions.
12.0.0.4 File Fidelity Q&A example – query.
“Which model has the highest presentation quality score for
Amazon_Toys_and_Gameswith NMF recommendation model and what is its score?”
12.0.0.5 Source file.
A PowerPoint slide showing offline evaluation results for several recommendation models across two datasets, with separate metric tables for presentation quality (\(M_c\)) and model explainability (\(M_e\)).
12.0.0.6 Reference assertions.
Response should state that, for the
Amazon_Toys_and_Gamesdataset using the NMF recommendation model, the model with the highest presentation quality score is the researchers’ proposed model labeled ‘Ours’.Response should specify that the highest presentation quality score for the
Amazon_Toys_and_Gamesdataset using the NMF recommendation model is \(0.025\). Equivalent expressions such as \(0.0250\) should also be accepted.
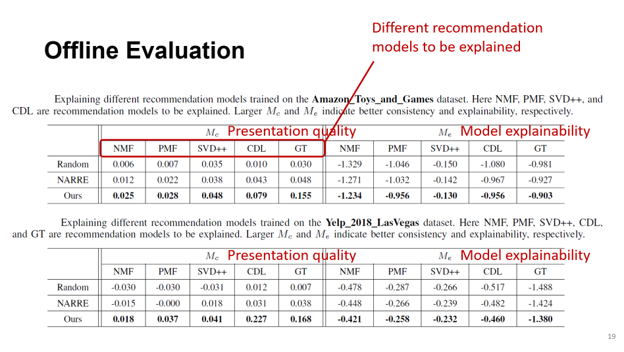
This is typical of File Fidelity: a single-artifact query producing two atomic assertions, both grounded directly in a chart cell.
13 LLM-as-a-Judge Prompt↩︎
This appendix reproduces verbatim the prompt used by each judge model when evaluating an atomic assertion. The judge receives the query, the system response, and a single reference assertion, and returns a binary verdict together with structured reasoning. The final decision per assertion is obtained by majority vote across three judge models, as described in §4.2. Four worked examples calibrate the judge against the partial-fulfillment, equivalent-information, and explicit-phrasing rules.
<role> You are an expert quality assurance evaluator. Your task is to impartially verify the faithfulness of a AI assistant’s ("<ai_response>") response against a given assertion ("<assertion>") in the context of a specific question ("<question>"). Your only source of truth is the content provided in the <question> and the <ai_response>. Do not use any external knowledge or information beyond what is provided in the <question> and <ai_response> to make your evaluation. You will be provided with a <question>, an <ai_response>, and an <assertion>. You should analyze the AI response to determine if it satisfies the criteria outlined in the <assertion> in the context relevant to the <question> being asked. </role>
<assertion_interpretation> The assertions you will receive are statements relating the <ai_response> to the <question> being evaluated.
For example:
<assertion_interpretation_example_1> query: "How do you initially measure the financial instruments under IFRS 9 and what is the fair value option?" assertion: "Explains measurement effect of fair value option on own credit risk." interpretation: "The AI response must explain the fair value option on own credit risk in the context of IFRS 9 financial instruments" </assertion_interpretation_example_1>
<assertion_interpretation_example_2> query: "If we are the owner of a company that is holding on its property a substantial share package for another publicly owned company, how important is that our financial reporting is made according to IAS 33? If we own non-public shares, is IAS 33 still relevant?" assertion: "State that the reporting entity’s own listing status is the primary driver of IAS 33 relevance." interpretation: "The AI response must state the fact that reporting entity’s own listing status is the primary driver of IAS 33 relevance in the context of IAS 33 financial reporting." </assertion_interpretation_example_2>
</assertion_interpretation>
<input> <question>question</question> <ai_response>ai_response</ai_response> </input>
<assertion> assertion </assertion>
<reasoning_instructions>
1. Read the <question>, <ai_response> and <assertion> provided thoroughly. Interpret the context of the <assertion> based on the <question> provided. Make sure you understand what needs the ground truth from the assertion that needs to be evaluated. 2. Analyze the <ai_response> and locate evidence relevant to the <assertion>, either to support or refute it. 3. Analyze the <question> and locate the relevant context that qualifies the <assertion> in order to clarify its requirement. 4. Evaluate the <assertion> based on the evidence you identified. - Consider partial fulfillment: if the <ai_response> meets some but not all criteria, requirements or expectations in the <assertion>, check if the <assertion> allows for partial correctness (e.g., "response should contain at least X out of Y conditions", "response should X OR Y"). If it does, you may consider it TRUE; otherwise, it is FALSE. - Consider equivalent information: if the <ai_response> does not directly fulfill the criteria but conveys the same meaning using different wording, consider the <assertion> TRUE. If the meaning is not equivalent or the <assertion> explicitly requires specific wording, consider it FALSE. - Ignore additional information: if the <ai_response> contains extra details not mentioned in the <assertion>, disregard them unless the <assertion> explicitly prohibits such additional information. - Do not evaluate assertions on their own, you must consider whether the assertion is verifiable in the context of the <question> and the <ai_response>, even if a trivial fact is requested in the <assertion>. - Do not infer explicit requirements in your interpretation of assertions unless observed directly. For example, if the assertion says "State that [sentence describing the requirement]", you must not infer that the response must explicitly state exactly what it is written as the requirement description or sentence describing the required statement. - Only assess explicit requirements if the assertion describes it as an explicit requirement or asks for exactness of certain words or data points (for example: by placing expected content in the ai response in quotes). 5. Compose your reasoning using the following structure xml-like structure: <assertion> Restate the <assertion> verbatim as provided </assertion> <interpretation> Interpretation of the assertion in the context of the <question> asked as a single statement. </interpretation> <evidence> [Quoted evidence from the <question> and <ai_response> that supports your conclusion as a list, if applicable. If no specific quotes are used, write a list containing a single entry "N/A"] </evidence> <analysis> Detailed explanation of how the <ai_response> meets or does not meet the criteria outlined based on the evidence you found </analysis> <verdict> The assertion is TRUE/FALSE </verdict> 6. Fill in the final output as a valid JSON object (without markdown code blocks) with your reasoning and score. Only valid JSON is allowed in the output. </reasoning_instructions>
<output> "reasoning": "Structured explanation as described above", "score": "0 if assert is FALSE, 1 if assert is TRUE" </output>
<examples> <example_1> <input> <question>"A mid-sized UK distributor currently operates with 60 Days of Inventory on Hand (DOH) and an On-Time In-Full (OTIF) delivery rate of 87 Stage 3: Financial & Service-Level Calculation: Assume: Average Inventory Value = £5 million Cost of Capital = 10Forecast Error Reduction from selected strategies improves OTIF by 3 percentage points.
a) Calculate the annual working capital savings from reducing DOH from 60 to 45 days. b) If each 1c) Combine the two results to show the total annual benefit."</question> <ai_response>### Stage 3: Financial & Service-Level Calculation
**a) Working Capital Savings** Reducing DOH from 60 to 45 days means a 25 **b) Revenue from OTIF Improvement** A 3-percentage-point OTIF gain at £50,000 per point = 3 x £50,000 = **£150,000**.
**c) Total Annual Benefit** £125,000 + £150,000 = **£275,000 per year**.</ai_response> </input> <assertion> In the Conclusion, state that, based on prompt-provided assumptions, the combined strategies yield an estimated £275,000 annual benefit. </assertion> <output> "reasoning": "<assertion>In the Conclusion, state that, based on prompt-provided assumptions, the combined strategies yield an estimated £275,000 annual benefit.</assertion><interpretation>The AI response must arrive at a combined total annual benefit of £275,000 from both the working capital savings and OTIF revenue uplift, using the numeric assumptions given in the question.</interpretation><evidence>[‘£125,000 + £150,000 = **£275,000 per year**’]</evidence><analysis>The assertion requires a combined benefit figure of £275,000. The AI response correctly computes working capital savings (£125,000) and OTIF revenue uplift (£150,000), arriving at a combined £275,000. The arithmetic is consistent with the prompt-provided assumptions (DOH 60->45, £5M inventory, 10"score": 1 </output> </example_1> <example_2> <input> <question>"One of the largest processing conglomerates is implementing an advanced digital transformation strategy to improve its operational efficiency and secure an information advantage (Veronesi, 2021). The company has invested big on obtaining IoT sensors and Edge AI to drive a new predictive maintenance system for its old equipment. Nevertheless, this project has also revealed a range of strategic and technical issues.
When the company is in a situation where a new predictive maintenance system is in use and suffers an ‘integration gap’ between new IT-based analytics and all the existing Operational Technology (OT) data (ManufacturingTomorrow, 2025), how should it address this challenge?"</question> <ai_response>To address the integration gap, the company should adopt a unified IT/OT architecture. Rather than treating enterprise IT systems and shop-floor OT systems as independent silos, the organization should converge them into a single operating model. This means establishing middleware or integration platforms that allow real-time OT sensor data to flow into the company’s analytics and ERP layers. By bridging the two domains, the organization can unlock the full potential of its predictive maintenance investment without requiring wholesale replacement of legacy OT infrastructure.</ai_response> </input> <assertion> State that addressing the integration gap requires moving from segregated IT/OT models toward an integrated operating model. </assertion> <output> "reasoning": "<assertion>State that addressing the integration gap requires moving from segregated IT/OT models toward an integrated operating model.</assertion><interpretation>The AI response must recommend transitioning from separate IT and OT domains to an integrated operating model in the context of addressing the manufacturing integration gap.</interpretation><evidence>[‘Rather than treating enterprise IT systems and shop-floor OT systems as independent silos, the organization should converge them into a single operating model’]</evidence><analysis>The assertion requires the response to advocate for moving from segregated IT/OT models to an integrated one. The AI response uses different wording (‘independent silos’ instead of ‘segregated models’, ‘converge them into a single operating model’ instead of ‘integrated operating model’) but conveys the same meaning. The equivalent information rule applies–the recommendation is substantively identical.</analysis><verdict>The assertion is TRUE</verdict>", "score": 1 </output> </example_2> <example_3> <input> <question>In today’s business environment, the supply chain begins with the customer’s initial demand or purchase request, flows through sourcing, production, and distribution, and extends to final delivery and post-sale activities such as returns, recycling, and customer support. Along the way, businesses collect vast amounts of data, including inventory, production, quality, and customer related information. This raises two critical questions: How is this data being managed, and how is it being safeguarded?</question> <ai_response>The report describes how supply chain data is managed through ERP systems, warehouse management systems, and increasingly through IoT-connected devices that provide real-time tracking. For safeguarding, the report outlines a comprehensive cybersecurity control framework including network segmentation, zero-trust architecture, multi-factor authentication, and regular penetration testing as recommended practices for protecting supply chain data from cyber threats.</ai_response> </input> <assertion> State that the report does not present a comprehensive cybersecurity control framework. </assertion> <output> "reasoning": "<assertion>State that the report does not present a comprehensive cybersecurity control framework.</assertion><interpretation>The AI response must acknowledge that the source report does not contain a comprehensive cybersecurity control framework, rather than fabricating one.</interpretation><evidence>[‘the report outlines a comprehensive cybersecurity control framework including network segmentation, zero-trust architecture, multi-factor authentication, and regular penetration testing’]</evidence><analysis>The assertion requires the response to note a limitation of the source report–that it does not present a comprehensive cybersecurity framework. The AI response does the opposite: it claims the report ‘outlines a comprehensive cybersecurity control framework’ and lists specific controls (network segmentation, zero-trust, MFA, penetration testing). This directly contradicts the assertion and represents hallucinated content beyond what the source report actually covers.</analysis><verdict>The assertion is FALSE</verdict>", "score": 0 </output> </example_3> <example_4> <input> <question>Deloitte (2024) in their report titled "IFRS in your pocket" provides that the main objective of IAS 12 is to prescribe the accounting treatment for income taxes. Provide the difference between current tax and deferred tax. What is the difference between Deferred Tax Assets (DTA) and Deferred Tax Liabilities (DTL)? Provide the measurement of deferred tax, and the presentation of current and deferred tax.</question> <ai_response>**Current Tax vs Deferred Tax:** Current tax is the amount of income taxes payable in the current period, while deferred tax relates to temporary differences between carrying amounts and tax bases.
**DTA vs DTL:** A Deferred Tax Liability arises when a temporary difference will result in taxable amounts in future periods. A Deferred Tax Asset arises when a temporary difference will result in deductible amounts in future periods.
**Measurement:** Deferred tax is measured using the tax rates that are expected to apply when the asset is realised or the liability is settled.
**Presentation:** Current and deferred tax is recognised as income or expense in profit or loss for the period.</ai_response> </input> <assertion> State that DTAs are recognized only to the extent that future taxable profit is probable. </assertion> <output> "reasoning": "<assertion>State that DTAs are recognized only to the extent that future taxable profit is probable.</assertion><interpretation>The AI response must state the IAS 12 recognition constraint that Deferred Tax Assets may only be recognized when it is probable that sufficient future taxable profit will be available against which the deductible temporary differences can be utilized.</interpretation><evidence>[‘A Deferred Tax Asset arises when a temporary difference will result in deductible amounts in future periods’]</evidence><analysis>The assertion requires an statement about the probability-based recognition threshold for DTAs. The AI response only defines when a DTA arises (deductible amounts in future periods) but does not mention the critical recognition constraint–that DTAs are recognized only to the extent that future taxable profit is probable. The definition of what creates a DTA is not the same as stating the conditions under which it may be recognized. The specific requirement of the assertion is absent.</analysis><verdict>The assertion is FALSE</verdict>", "score": 0 </output> </example_4> </examples>
14 Construction Methodology — Full Pipelines↩︎
This appendix expands the high-level overview in §3 with the full per-track construction pipelines. §14.1 documents the Domain Q&A pipeline; §14.2 documents the File Fidelity Q&A pipeline. Both pipelines share the same four-stage shape (source curation, question authoring, rubric construction, quality assurance), but instantiate each stage differently. Cross- references to related appendices, expert pool composition (§17), the three rubric-authorship methodologies (§15), and the assertion-quality review loop (§16), are made where appropriate.
14.1 Domain Q&A pipeline↩︎
Domain Q&A queries are expert-level questions grounded in real industry documents, requiring multi-step domain reasoning, computation, and often synthesis across multiple files. Unlike File Fidelity queries, which target single artifacts with one or two assertions, Domain queries average \(\sim\)45 atomic assertions per query, reflecting the depth of analytical reasoning involved. A single Domain query - for instance, preparing an earnings call analysis from a 10-Q - may require pulling line items, computing ratios, decomposing variances, and synthesizing observations into a structured response.
14.1.0.1 Construction pipeline.
Domain Q&A items are produced through a four-stage construction pipeline:
Source curation. Domain practitioners select or compile authoritative source documents that a qualified professional would consult. Sources span SEC filings, slide decks, spreadsheets, and operational documents.
Question and answer authoring. Experts draft realistic prompts grounded in the source documents and produce reference answers that a qualified practitioner would recognize as correct and complete. Each Q&A is authored by 2-3 domain experts.
Rubric construction. Each Q&A pair is paired with a rubric composed of atomic assertions - single, verifiable claims that a correct response should satisfy. We use multiple authoring approaches: rubrics authored independently of the reference answer (capturing what any correct response should demonstrate), rubrics derived from the reference answer (decomposing it into verifiable claims), and rubrics authored by domain experts independent of the original Q&A author. Each approach has different evaluative properties; together they reduce the benchmark’s dependence on any single rubric-construction convention.
Quality assurance. A separate reviewer, distinct from the original prompt and rubric authors, verifies prompt construction, rubric design, and consistency across items.
Model evaluation against these rubrics is not part of the construction pipeline; it is the downstream evaluation procedure described in §4.
14.1.0.2 Scoring.
We report assertion-level accuracy as the headline metric for the Domain Q&A track: a model’s score is the total number of atomic assertions it satisfies, divided by the total number of assertions in the track (see §4 for the precise formulation). Every atomic assertion contributes equally, so queries with more assertions have proportionally more influence on the score.
Each assertion also carries an expert-assigned importance weight, but schema heterogeneity and uncalibrated rater severity make weighted scores interpretable only within a single rubric rather than as an absolute signal across the benchmark; we treat weighted scores as a secondary signal (reported in §24, where they agree with unweighted scores on model rankings).
14.2 File Fidelity Q&A pipeline↩︎
File Fidelity Q&A tests whether a system can accurately perceive and interpret the structural and visual content of Office files - text, tables, charts, images, formatting, and app-specific artifacts. The authoring methodology applies a common four-stage pipeline across all three applications (Word, Excel, PowerPoint), with app-specific adaptations at each stage.
14.2.0.1 Document sourcing and curation.
For all three applications, source documents are drawn from a broad pool of publicly available files (Fortune 500 filings, government agency publications, educational institutions). We apply coarse filtering to remove corrupted files, near-empty documents, and pure templates, and keep only English-language documents. App-specific implementation choices, document-to-text conversion (Word via Markdown, Excel via per-sheet structured text, PowerPoint via slide-level extraction) and the modality switches that support groundedness filtering, are documented in §20.
Iterative coverage targeting. Document selection is iterative: we begin with a broad pool, generate candidate questions (described below), and revisit document selection if coverage of any artifact type or app-specific element is sparse. The goal is for the final corpus to support meaningful question generation across all the artifact types in our taxonomy. We track page counts (Word), slide counts (PowerPoint), and sheet counts (Excel) as auxiliary metadata to support stratified sampling.
Human verification. Human annotators review the selected documents to confirm structural diversity (e.g., headings, tables, images, text boxes, headers/footers, charts, formulas, multi-sheet structure), and validate that documents contain sufficiently rich content to support meaningful question generation.
14.2.0.2 LLM-assisted Q&A generation.
Questions target information explicitly present in the document across different modalities and structural elements. We generate questions grounded in multiple artifact categories: text, tables, images, charts, and app-specific elements (Word: headers, footers, text boxes, equations, hyperlinks, font styles; Excel: formulas, cross-sheet references, named ranges; PowerPoint: slide layouts, speaker notes, embedded charts).
Q&A generation. We use frontier LLMs with prompts designed to generate candidate question–answer pairs grounded in specific document elements. For text, tables, images, and charts, the generation prompt emphasizes creating questions that require reading and understanding the targeted element. For app-specific structural elements, we explicitly extract formatting and layout components and generate questions that test understanding of document structure and presentation. The prompt design discourages reliance on general knowledge or other parts of the document. Human curators then review, edit, and supplement the LLM-generated candidates. The full generation prompts are reproduced in §18.
Writing guidelines. A portion of items are authored or substantially rewritten by hand, for example, when curators edit LLM-generated candidates during review, or when under-covered artifact types require questions written from scratch. For both LLM-generated and manually-authored questions, we enforce two guidelines: questions must be (1) grounded, answerable solely from the file, and (2) free from underspecification, minimizing cases with multiple equally valid answers unless explicitly allowed. The same guidelines inform the prompts used in LLM-assisted generation, so manually and automatically authored questions remain stylistically consistent.
14.2.0.3 Automatic filtering for groundedness.
Each candidate question undergoes a multi-stage automatic filtering pipeline designed to ensure the question genuinely requires the targeted document element:
No-context check. We prompt the LLM to answer the question without any document context. Questions answerable from the model’s training knowledge are discarded.
Element-specific checks. The filtering strategy adapts to artifact type. For text-based questions, we provide the full document with the source chunk removed. For table questions, we provide the document with all tables except the target table, and separately test with text-only content (no tables). For image-based questions, we provide text-only document content (no images). For app-specific element questions, we provide the document without the specific structural element being tested (e.g., without headers/footers, without specific formulas, or without specific slide layouts). Questions correctly answerable without the target element are discarded.
Quality grading. Surviving question–answer pairs are evaluated by an LLM grader calibrated to human quality judgments, scoring each Q&A across three dimensions: question clarity, answer precision, and information value.
14.2.0.4 Human verification and quality control.
Multi-annotator review. Each generated Q&A pair is independently evaluated by two human annotators. Annotators verify answer correctness, locate and mark the specific document element containing the evidence (text span, table cell, image region, formula, slide region, or structural component), and grade question quality. When the two annotators disagree on correctness or quality, a third annotator adjudicates and provides the final judgment.
Aggregation and quality filtering. For Q&A pairs where the two initial annotators agree, the agreed judgment is taken as final. For pairs that required a third annotator, the adjudicator’s decision is used. Q&A pairs where annotators cannot reliably locate supporting evidence are discarded.
Iterative refinement. Questions flagged during human review are revised or discarded. Common revisions include narrowing overly broad questions, adding specificity to eliminate ambiguity, correcting reference answers based on annotator evidence, and updating questions where multiple interpretations exist. Reference answers may consist of a single atomic statement or several; in either case they are stored as a collection of atomic statements that the evaluation procedure (§4) assesses independently.
15 Domain Q&A Collection Methodologies↩︎
The Domain Q&A track was assembled across three methodologies that differ along the rubric-authorship dimension. Table 4 maps each onto the four-stage construction pipeline described in §3.0.0.1. We organize by rubric authorship rather than by vendor, since this is the dimension along which the collections’ evaluative properties differ.
| Stage | Independent rubric | Cross-org layered | Derived from golden |
|---|---|---|---|
| Domains | Investor Relations, FP&A | Supply Chain, Manufacturing, Accounting | 12 industries |
| Source curation | SMEs select company; compile public filings (10-K, 10-Q, transcripts) | Experts curate documents across Word, PPT, Excel; peer and human-data-manager review | Source documents provided to experts as Q&A grounding |
| Q&A authoring | SME drafts realistic prompt; expert authors golden answer from sources only | Experts author prompts and golden responses grounded in the curated source documents | Two-expert authoring: Expert A writes Q + ideal A; Expert B answers independently, then synthesizes both into a single golden answer |
| Rubric construction | Model-agnostic rubric authored independently of the golden response; criteria span knowledge verification, logical deduction, quantitative reasoning | Atomic rubrics authored by a different organization than the Q&A authors; cross-org separation reduces anchoring on the original author’s framing | Atomic rubrics derived from the golden answer by decomposition into atomic assertions |
| Weighting | Primary / secondary per assertion | Per-criterion, normalized post-hoc | Per-criterion, normalized post-hoc |
| QA review | Independent reviewer verifies prompts, rubrics, scoring | Leads verify rubric consistency and clarity | Lead verifies clarity, consistency, grammar across both authoring phases |
5pt
The cross-org layered methodology is worth flagging explicitly: the Q&A authors and the rubric authors came from different expert organizations. This separation produces rubrics that reflect what an independent expert considers necessary and sufficient for a correct response, rather than a decomposition of the original author’s framing.
15.0.0.1 Per-industry query distribution.
Figure 8 shows the distribution of Domain Q&A queries across the 12 industries (referenced in main paper §2). Per-industry shares range from \(5.0\%\) to \(12.5\%\) of the \(120\) queries; coverage is roughly balanced rather than weighted by economic contribution.
16 Rubric Construction Process↩︎
This appendix describes the iterative process used to refine domain-expert-authored assertions into atomic, LLM-evaluable rubric items. §[sec:assertionquality] summarized the failure modes we encountered; here we provide the full taxonomy with examples and describe the review loop.
16.1 Review loop↩︎
Each rubric was passed through a three-step review loop:
Automated triage. Every candidate assertion was scored by a frontier LLM along the failure-mode dimensions enumerated below. The LLM output a structured flag set (e.g.,
{compound: true, ambiguous: false, ...}) and a brief justification per flag. We did not act on these flags directly; they served only to prioritize human review.Expert decision. A domain expert (the rubric author or a peer reviewer) examined each flagged assertion and selected one of: keep (false positive), modify (rewrite for clarity or specificity), split (decompose a compound assertion into multiple atomic ones), merge (collapse parallel assertions into one general claim), or delete (remove off-topic or unverifiable assertions).
Cross-check. An independent reviewer re-ran the automated triage on the revised rubric and resolved any remaining flags. Rubrics typically required two to three loop iterations to stabilize.
16.2 Failure mode taxonomy with examples↩︎
Examples below are drawn from real rubrics across our domain authoring collections. Identifying details have been preserved where they illustrate the failure mode and abstracted otherwise.
16.2.0.1 (i) Duplicate assertions.
Two assertions express the same claim in different surface forms, inflating the score for any model that produces the underlying claim once.
Before:
Identifies ID.RA-09 as justification.
States NIST CSF 2.0 Function ID.RA-09 as defensible security posture.
After: States NIST CSF 2.0 Function ID.RA-09 as defensible security posture.
16.2.0.2 (ii) Compound assertions (split).
A single assertion bundles two or more independently verifiable claims, preventing binary grading.
Before: States that CO2 injection is less associated with carbon removal from a climate-change perspective because the duration of storage may be shorter and the injection is typically used to recover more oil and gas.
After (split into two):
States that CO2 injection is less associated with carbon removal because the duration of storage may be shorter.
States that CO2 injection is less associated with carbon removal because the injection is typically used to recover more oil and gas.
16.2.0.3 (iii) Mergeable parallel assertions.
Several near-identical assertions vary only on a single slot value; collapsing them into a single more general claim removes redundancy without weakening the rubric.
Before:
Identifies untrusted devices should only have view access.
Identifies unmanaged devices should only have view access.
After (merged): Identifies that untrusted or unmanaged devices should be restricted to view access.
16.2.0.4 (iv) Ambiguous assertions.
The assertion reads correctly when surrounded by the reference answer’s context but becomes unverifiable once extracted, because the relevant qualifiers (subject, scope, condition) are implicit.
Before: States downloads should be blocked.
After: States access/downloads of sensitive documents should be blocked on non-compliant endpoints.
Before: Defines attack surface properly.
After: States that any endpoint that can authenticate to organizational resources becomes part of the organization’s attack surface.
16.2.0.5 (v) Broad assertions.
The assertion is too general to discriminate between a substantive answer and a superficial one - both pass.
Before: States the board’s structure can limit the CEO’s power.
After: States that the current board structure (CEO plus two private investors) can still provide balance to the CEO’s influence through governance mechanisms.
16.2.0.6 (vi) Structural / presentation assertions.
The assertion grades the form of the response rather than its content - whether it begins with a paragraph, uses bullet formatting, or adopts particular terminology. We removed these from the rubric entirely: presentation requirements belong in the prompt, not the graded content rubric.
Removed examples:
Response begins with an introductory paragraph.
Presents technical recommendations as a list.
Presents answer using terminology appropriate for security practitioners.
16.2.0.7 (vii) Prompt-restating assertions.
The assertion tests information already established by the question itself, rewarding models for reproducing prompt content rather than producing answer content.
- Removed example: States there are three members on the Board currently. (The question already specified the board size; verifying this in the response tests reading comprehension of the prompt, not domain reasoning.)
16.2.0.8 (viii) Inappropriate illustrative-example assertions.
The assertion demands one specific illustrative example when many are equally valid, penalizing correct responses that produce a different example.
Before: States to increase percentage of CSBG participants achieving self-sufficiency from 18% to 35% over five years.
After: Provides a concrete, measurable example of a family-level self-sufficiency goal with specific targets and timeframes.
17 Expert Pool Composition↩︎
Domain Q&A items were authored by domain practitioners across finance, accounting, manufacturing, supply chain, healthcare, cybersecurity, construction, government, education, and other industries. Across the benchmark, experts averaged approximately 10 years of professional experience in their domains, with a substantial fraction having more than 10 years and roughly a quarter having more than 15 years. The pool included 49 experts spanning 12 industries contributing to the broader rubric authoring effort, with a minimum of two qualified annotators per domain.
17.0.0.1 Vendor-managed expert vetting.
Experts were sourced and vetted by our annotation vendors, each of which operates a structured selection workflow. Vendor-managed vetting included verifying domain alignment through skill assessments, AI- or recruiter-led interviews to confirm depth in the relevant practice area, soft-skills evaluation to ensure experts could produce clear written prompts and reference answers, and review of prior employer credentials and seniority.
17.0.0.2 Representative employers.
Across the 12 industries covered by the benchmark, experts had prior or current experience at organizations including PwC, BDO, Amazon, Mercedes-Benz, Samsung, Continental Automotive, Kaiser Permanente, UnitedHealth Group, Palantir, U.S.Department of Defense, FEMA, CDC Foundation, UPS, Nike, Hyatt Hotels, and Target, among others.
17.0.0.3 Industry coverage.
The Domain Q&A track covers 12 industries: Accounting; Corporate Governance; Educational Services; Energy; Finance; Government; Healthcare & Social Assistance; Information; Manufacturing; Supply Chain; Waste Management & Environmental Services; and Wholesale/Retail Trade.
18 Q&A Generation Prompts↩︎
This appendix documents the prompts used to generate question–answer pairs across the File Fidelity track. Four prompts target distinct content modalities: (i) textual content extracted from document body text, (ii) visual content from figures and
charts, (iii) tabular content, and (iv) Word-specific fidelity attributes (formatting, metadata, structural elements). Each prompt is parameterized by a generation budget (e.g., {{QUESTIONS_PER_CHUNK}}) that controls density per artifact. The
prompts shown below are simplified from production versions, with redundant few-shot examples and boilerplate omitted; the core task specification, quality constraints, and output schema are preserved verbatim.
18.1 Textual Q&A Generation Prompt↩︎
Operates over text chunks extracted from document body content. To reduce hallucination, three candidate answers (detailed, terse, balanced) are generated independently and reconciled via majority vote before the final pair is emitted.
<role> You extract explicit, verifiable facts from a document and generate question-answer pairs grounded in those facts. </role>
<task> 1. Identify facts explicitly stated in the document (timelines, named entities, roles, system features, numeric values). Skip anything that requires inference.
2. Generate up to QUESTIONS_PER_CHUNK high-quality questions. Prioritize questions that: - Are unambiguous with clear scope - Are answerable from the provided text alone - Target high-value content: KPIs, financial figures, technical specifications, research findings, actionable insights - Expect atomic, extractable data points (numbers, dates, names)
3. For each question, draft three candidate answers: - Detailed: thorough explanation with context - TL;DR: concise factual one-liner - Balanced: key fact plus brief rationale Reconcile via majority vote. Final answer is short (one sentence or a few words). </task>
<restrictions> - Use only information explicitly stated in the document. - Do not speculate or infer. - If no explicit facts are found, return "qas": []. </restrictions>
<output> "qas": [ "question": "...", "answer": "..." ] </output>
<input> <|startoftext|> chunk <|endoftext|> </input>
18.2 Visual Q&A Generation Prompt↩︎
Targets figures, charts, and other visual artifacts. The first stage filters out non-informative images (logos, decorative elements, stock photos); the second stage generates SQuAD-style [38] atomic answers tied to specific visual content. Each pair is emitted in two question forms (with and without an explicit figure reference) to support both retrieval-style and reading-comprehension-style framings downstream.
<role> You generate vision-grounded QA pairs for images extracted from documents. </role>
<input> - IMAGE_INPUT: base-64 PNG of one figure. - FIGURE_NAME (optional): caption or label from the source document. </input>
<relevance_check> SKIP the image (return "qas": []) if it is: - A logo, brand mark, decorative icon, or generic stock photo - A headshot, watermark, signature, or simple background - Raw scientific imagery without labels or annotations
PROCEED only for charts, plots, infographics, diagrams, annotated maps, schematics, screenshots with information, comparison matrices, or labeled visualizations carrying quantitative or structured content. </relevance_check>
<task> For relevant images, produce exactly QA_GENERATION_QUESTIONS_PER_IMAGE QA pairs. Each pair contains: - question: standard form, no figure reference - question_reference: same question with a concise figure reference ("Fig. 3", "Profit Function chart"); null if FIGURE_NAME is absent or non-informative - answer: atomic SQuAD-style span (typically <=5 words; specific entity, number, color, or short phrase)
Avoid trivial questions (axis labels, headline colors), subjective interpretation, and any answer that cannot be objectively verified from the image. </task>
<output> "qas": [ "question": "...", "question_reference": "..." | null, "answer": "..." ] </output>
18.3 Table Q&A Generation Prompt↩︎
Operates over tables extracted from documents. The model receives the raw table HTML alongside the surrounding narrative (with table positions marked by placeholders), enabling questions to disambiguate via local context such as captions or nearby section headings. Questions are restricted to lookup and identification - no arithmetic or aggregation - to keep answer verification deterministic.
<role> You generate QA pairs grounded strictly in the provided table. </role>
<input> - table_number_placeholder: zero-indexed table position. Tables appear in the surrounding markdown as <!– TABLE-N –> markers. - EXTRACTED_TABLE_HTML: the table content as HTML. - DOCUMENT_WITH_PLACEHOLDER_TABLES: surrounding narrative for context. </input>
<task> First check whether the table carries enough information for QA generation. If it is empty, header-only, or a blank template, return "qas": []. Otherwise produce up to number_of_questions_per_table diverse QA pairs.
Each QA pair contains: - question: standard form, no table reference - question_reference: same question with an explicit table reference drawn from the caption, a nearby heading, or distinguishing column/row headers (never the table index) - answer: short grounded phrase from a single cell or cell-level lookup </task>
<rules> - Lookup or identification only. No arithmetic, aggregation, or multi-step reasoning. - Prefer WH / How Many / Which / What forms over yes/no. - Do not use phrases like "according to the table" in the standard question. - When cell values repeat, disambiguate via row/column context. - Each answer must be derivable from the table alone. </rules>
<output> "qas": [ "question": "...", "question_reference": "...", "answer": "..." ] </output>
<input_data> <|startoftable|> table_markdown <|endoftable|>
<|startoftext|> document_text_only <|endoftext|> </input_data>
18.4 Word Fidelity Q&A Generation Prompt↩︎
Produces questions that probe Word-specific fidelity attributes unanswerable from plain text alone - formatting, metadata, structural elements, and embedded objects. The prompt receives a structured fidelity context (a list of typed facts extracted from the DOCX) and emits typed questions whose answers verify preservation of those attributes. Type-level priorities counter a known imbalance in the generated set, which would otherwise skew heavily toward font questions.
<role> You generate QA pairs that test Word-specific fidelity attributes (formatting, metadata, structural elements). Answers derive from provided fidelity facts; questions must not be answerable from plain text content alone. </role>
<task> Generate exactly QUESTIONS_PER_DOCUMENT QA pairs from the fidelity context. Each pair must: - Depend on a fidelity attribute (not extractable from raw text) - Reference an unambiguous, identifiable element - Test a single attribute or a coherent combination of related ones - Cite the supporting fact_ids </task>
<question_types> font, highlight, header, footer, comment, hyperlink, footnote, equation, textbox, strikeout, layout, metadata. </question_types>
<priority_balance> Font questions are overrepresented; cap at 2-3 per document. Prioritize underserved types when corresponding facts exist: - equation, comment, strikeout: at least 2 questions if facts exist - textbox: at least 1 question if facts exist - header, layout, footnote: prefer over font when facts exist </priority_balance>
<quality_rules> 1. Subject text must be meaningful. If a fact references placeholder content ("______", "..."), describe the element by purpose ("the signature line", "the location number field") rather than quoting the placeholder. 2. Color answers must be human-readable names, not hex codes ("red" not "#FF0000"). 3. Skip low-value facts: CUSTOM_PROPERTY entries (SharePoint metadata, ContentTypeId) and trivial hyperlinks where the URL matches the display text. 4. CORE_PROPERTY metadata (author, title, created date) and hyperlinks where the URL meaningfully differs from display text are in scope. 5. Comparative or aggregate questions are encouraged when multiple related facts support them ("What is the largest font size used in the document?"). </quality_rules>
<output> "qas": [ "question": "...", "answer": "...", "question_type": "<one of the types above>", "fact_ids": ["FACT_ID_001", "..."] ] </output>
<input> <|startofcontext|> fidelity_context <|endofcontext|> </input>
19 Per-App File Fidelity Taxonomy↩︎
§2.2 lists representative object-centric category labels applicable across applications. This appendix provides the full per-app artifact taxonomy.
19.1 Word artifact types↩︎
The Word artifact taxonomy comprises 15 categories spanning textual content, structural elements, formatting cues, and embedded objects. Each query is labeled with its primary artifact type; queries exercising multiple artifacts may be tagged with more than one.
Table: tabular content with row/column structure, including header rows, merged cells, and cell-level values.
Text: paragraphs, bullets, numbered lists, and other free-form body content.
Font: typeface, font size, weight, italics, underline, font color, and other character-level styling.
Layout: page layout, column structure, alignment, indentation, and inter-paragraph spacing.
Hyperlink: clickable links to external URLs or intra-document anchors.
Metadata: document properties (title, author, creation and modification dates, custom properties).
Footnote: footnotes and endnotes referenced from body text.
Highlight: text highlighting (yellow, green, etc.) used to mark or emphasize content.
Footer: bottom-of-page repeating content, including page numbers and footer text.
Comment: review comments and annotations attached to specific text ranges.
Header: top-of-page repeating content, including section titles and document identifiers.
Equation: mathematical equations rendered via OMML or MathML.
Strikeout: strikethrough text indicating deletion or deprecation.
Textbox: free-floating text boxes positioned independently of the main text flow.
Video: embedded video objects.
| Artifact type | Queries |
|---|---|
| Table | 143 |
| Text | 62 |
| Font | 29 |
| Layout | 18 |
| Hyperlink | 18 |
| Metadata | 17 |
| Footnote | 16 |
| Highlight | 14 |
| Footer | 13 |
| Comment | 11 |
| Header | 11 |
| Equation | 10 |
| Strikeout | 10 |
| Textbox | 9 |
| Video | 2 |
| Total | 383 |
19.2 Excel artifact types↩︎
The Excel artifact taxonomy comprises 10 categories covering both structured spreadsheet objects (formal Tables, PivotTables, Charts) and the more loosely organized cell ranges that dominate real-world workbooks.
TLR (Table-Like Range): tabular data laid out across a contiguous cell range without being formally registered as an Excel Table object. TLRs are the most common form of structured data in real-world workbooks and require row/column inference rather than direct schema lookup.
Table: formally structured Excel Table objects with declared headers, named ranges, and structured references.
Unstructured data: free-form cell content that is not organized in a tabular layout (e.g., scattered values, notes, free-text cells).
Formula: cell formulas, derived values, cross-cell and cross-sheet references, and named-range expressions.
Sheet: worksheet-level structure, including sheet names, sheet ordering, hidden sheets, and multi-sheet workbooks.
Chart: embedded charts, including chart types, data sources, axes, legends, and data labels.
Image: embedded images and screenshots.
PivotTable: pivot tables, including their fields, filters, and aggregations.
Shape: shapes positioned over the worksheet grid.
Other: residual category for queries that do not fall cleanly into the categories above.
| Artifact type | Queries |
|---|---|
| TLR (Table-Like Range) | 133 |
| Table | 72 |
| Unstructured data | 30 |
| Formula | 15 |
| Sheet | 9 |
| Chart | 9 |
| Image | 6 |
| PivotTable | 5 |
| Shape | 1 |
| Other | 1 |
| Total | 281 |
19.3 PowerPoint artifact types↩︎
The PowerPoint artifact taxonomy comprises 21 categories spanning slide content, spatial layout, embedded objects, and presentation-level structure. Compared to Word and Excel, the PowerPoint taxonomy includes a heavier weighting toward visual and spatial elements (positioning, shape attributes, color coding) reflecting the format’s presentation-centric nature.
Slide Text: text content on slides, including titles, body text, and bullet points.
Position / Association / Grouping: spatial relationships between slide elements, including grouping, alignment, and proximity-based associations.
Tables / Values: table cell values rendered within slides.
Image: embedded images, screenshots, and photographs.
Chart: embedded charts and their data, labels, and legends.
Text Highlight: highlighted text used for emphasis.
Shape / Text: text content rendered inside shape objects (callouts, banners, etc.).
Equation (or Symbol): mathematical equations and special symbols.
Hyperlink: clickable links to external URLs or other slides.
Header / Footer / SlideNum / DateTime: master-level repeating elements (slide numbers, footers, date/time placeholders).
Slide Note: speaker notes attached to slides.
Language: language tagging and per-element language attributes.
Metadata: presentation-level properties (title, author, created/modified dates).
Shapes / Type & Color: shape attributes including shape type, fill color, and outline.
Ink: handwritten ink annotations.
Tables / Cell color coding: color-coded table cells where the color carries semantic meaning (e.g., red/yellow/green status indicators).
SmartArt / Type & Text: SmartArt diagrams, including diagram type and embedded text.
SmartArt / Semantics: structural relationships encoded by SmartArt (hierarchy, sequence, cycle).
Slide Properties - Hidden: hidden slides not visible during normal slideshow playback.
Animations: animation effects applied to slide elements.
Section: slide-deck sections used to organize slides into groups.
| Artifact type | Queries | Artifact type | Queries |
|---|---|---|---|
| Slide Text | 79 | Language | 3 |
| Position / Association / Grouping | 38 | Metadata | 3 |
| Tables / Values | 20 | Shapes / Type & Color | 3 |
| Image | 20 | Ink | 3 |
| Chart | 13 | Tables / Cell color coding | 2 |
| Text Highlight | 13 | SmartArt / Type & Text | 2 |
| Shape / Text | 7 | SmartArt / Semantics | 2 |
| Equation (or Symbol) | 7 | Slide Properties – Hidden | 2 |
| Hyperlink | 5 | Animations | 2 |
| Header / Footer / SlideNum / DateTime | 5 | Section | 2 |
| Slide Note | 5 | Video | 1 |
| Icons | 1 | ||
| Total: 238 | |||
6pt
20 App-Specific File Fidelity Implementation Details↩︎
§[sec:filefidelity] describes a unified four-stage pipeline applying to all three applications. This appendix documents the app-specific implementation choices that the main paper abstracted over.
20.1 Document representation for LLM ingestion↩︎
20.1.0.1 Word documents.
Word documents are converted to Markdown using pandoc with custom filters tailored to each modality. For text-based questions, we use standard Markdown conversion. For table-grounded questions, tables are extracted as standalone HTML files
and replaced with placeholders in the Markdown to enable selective inclusion or exclusion during groundedness filtering. For visual elements (images and charts), media files are extracted and referenced via Markdown image syntax, allowing text-only
variants to be constructed by omitting these references. A combined mode applies both table and visual extraction in a single pass, producing a unified representation that supports element-level manipulation for groundedness filtering.
20.1.0.2 Excel documents.
Excel files are processed sheet-by-sheet, with each worksheet rendered into a structured text representation that preserves cell coordinates, values, and formulas. For each cell, we extract three parallel signals: the displayed value, the underlying formula (if any), and salient formatting cues such as number format, fill color, and bold/italic emphasis where these encode meaning (e.g., totals rows, color-coded status). Formal Excel Table objects are preserved with their declared headers and structured references; table-like ranges are detected via header-row and contiguous-range heuristics and rendered as Markdown tables. Charts are extracted with their metadata (chart type, source range, axis titles, legend labels, data labels) alongside a rendered image of the chart, allowing chart-grounded questions to reference either the structural metadata or the visual rendering. Embedded images, shapes, and PivotTables are extracted as separate artifacts with placeholders in the cell representation. Multi-sheet workbooks are presented with a leading sheet index followed by per-sheet content. As with Word, this modular extraction enables selective inclusion or exclusion of specific elements during groundedness filtering - e.g., providing the workbook with a target chart removed, with all formulas replaced by their computed values, or with non-target sheets stripped.
20.1.0.3 PowerPoint documents.
PowerPoint files are processed slide-by-slide, with each slide represented along three parallel modalities: (i) extracted text content (titles, body text, bullets, text within shapes, and speaker notes), (ii) structural metadata (slide layout, shape positions, grouping relationships, animation order, hidden-slide flags), and (iii) a rendered image of the slide as it would appear during playback. Embedded objects - images, charts, tables, SmartArt diagrams, ink annotations - are additionally extracted as standalone artifacts so they can be referenced or removed independently of the slide they appear on. Speaker notes are kept separate from on-slide text so that questions targeting either modality can be filtered appropriately. The three-modality representation is essential for groundedness filtering on PowerPoint: questions targeting visual layout (positioning, grouping, color coding) require the rendered image, questions targeting text content require the extracted text, and questions targeting speaker notes require notes-only inputs. Master-slide elements (headers, footers, slide numbers, date/time placeholders) are extracted once at the deck level and referenced from each slide, mirroring how PowerPoint itself stores them.
20.2 Word document quality ranking↩︎
To identify high-quality Word documents suitable for benchmark evaluation, we implement a pairwise document comparison framework with LLM-based grading. Documents are converted to Markdown for text representation and compared across five dimensions: (1) structure and navigation clarity, (2) presence of core document components, (3) clarity and precision of language, (4) technical cleanliness for extraction, and (5) real-world authenticity signals. The evaluation rubric was calibrated through iterative refinement with three human annotators.
20.2.0.1 Pair selection.
Pair selection follows a two-phase strategy. In a bootstrap phase, we use heuristic selection combining semantically similar (“near”) and dissimilar (“far”) document pairs to establish initial rankings. In a rank-aware phase, we generate additional pairs between documents with adjacent Elo scores to improve discrimination at similar quality levels.
20.2.0.2 Score aggregation.
Pairwise outcomes are aggregated into global quality scores using Elo ratings. To reduce sensitivity to evaluation order, we average scores across multiple randomized orderings of the comparison sequence. We select the top-ranked documents per domain for question generation, ensuring the final set represents diverse, high-quality exemplars of professional Word documents.
20.3 Excel and PowerPoint document selection↩︎
Unlike Word, where the large candidate pool and primarily-textual quality signals enabled a fully automated Elo-based pairwise ranking, document selection for Excel and PowerPoint was performed manually by human curators. We attempted to extend the pairwise LLM-grading approach to both applications and found it did not transfer reliably:
Excel. Spreadsheet quality depends heavily on signals that are difficult to compare via LLM-based pairwise grading over a text serialization - the interplay between layout, formula structure, formatting, and multi-sheet organization rarely surfaces cleanly in the linearized representation. LLM judges produced inconsistent rankings on Excel pairs, with low inter-run agreement across randomized orderings. We therefore relied on human curators to select workbooks based on structural richness (multi-sheet workbooks, mix of formulas and values, presence of charts and PivotTables), domain authenticity (real-world filings rather than templates), and content diversity across the artifact taxonomy.
PowerPoint. Presentation quality is a fundamentally visual property: layout balance, visual hierarchy, color coordination, and slide-design coherence are not adequately captured by extracted text alone, and LLM-based comparison over rendered slide images proved unstable across runs and sensitive to incidental visual features (image content, color palette) rather than the structural and design qualities we cared about. Curators manually reviewed candidate decks for diversity across slide layouts, embedded artifact types (charts, tables, SmartArt, ink), and content domains.
In both cases, manual selection bounded the candidate pool size relative to Word but ensured the final document set covers the full artifact taxonomy described in Appendix 19. We view automating quality ranking for spreadsheets and presentations as an open problem and a useful direction for future work, since manual curation is the principal scaling bottleneck for extending OCB to larger Excel and PowerPoint corpora.
21 Variance Analysis — Extended Discussion↩︎
§4.4 reports the variance decomposition and a two-finding summary. This appendix expands the discussion with the points that inform our reporting and budgeting choices for future benchmark runs.
21.0.0.1 Scrape variance dominates eval variance.
Across all three subject models, response-sampling noise is the dominant source of run-to-run variance: Scrape Var is roughly \(1.6\times\)–\(3.1\times\) Eval Var, with the ratios spread across models (Claude \(1.6\times\), Gemini \(2.0\times\), GPT-5.5 Thinking \(3.1\times\)). This is consistent with the empirical pattern reported by [17] across a broader set of benchmarks, and validates the design choice of holding the judge ensemble fixed and instead investing the evaluation budget into multiple response scrapes.
21.0.0.2 Low eval variance is consistent with high inter-judge agreement.
The very low Eval Var (\(\leq 0.18\) percentage points for all three models) is consistent with the high inter-judge agreement reported in §4.3: residual disagreement between GPT-5.4 Thinking, Gemini 3.1 Pro, and Claude Opus 4.6 contributes only marginally to overall benchmark variance. Future work that wants to tighten the reported \(\pm\) ranges should therefore focus on increasing the number of response scrapes rather than the number of judge re-runs.
21.0.0.3 CIs justify the reported ranking.
GPT-5.5 Thinking exhibits somewhat higher response-sampling variance than the other two systems (Scrape Var \(0.45\) vs.Claude \(0.25\) and Gemini \(0.37\)), and our scrape-level CI honestly reflects the uncertainty inherent in only \(3\) response samples per model. The top-two CIs are non-overlapping (GPT-5.5: \([58.24, 60.46]\); Claude: \([56.22, 57.44]\)), with a cushion of \(\sim\) \(0.8\)pp between them; we describe GPT-5.5 Thinking and Claude Opus 4.7 in the main paper as a co-leading top tier in light of the small number of scrapes. Gemini 3.1 Pro’s CI (\([44.84, 46.66]\)) is clearly separated from both top-tier systems by \(>\) \(9\)pp.
22 LLM Judge Agreement↩︎
We assess the reliability of the three-judge ensemble (GPT-5.4 Thinking, Gemini 3.1 Pro, and Claude Opus 4.6) by examining agreement on assertion-level verdicts on Domain Q&A.
22.0.0.1 Direction of disagreement.
Decomposing each pair’s outcome into both pass / both fail / disagree (Figure 9) reveals that disagreement is not symmetric noise but reflects systematic strictness differences. GPT-5.4 and Claude 4.6 most often agree to pass (\(52.8\%\) of judgments), while Gemini 3.1 agrees with Claude on a fail in \(36.5\%\) of cases and disagrees with Claude in \(22.1\%\), the largest gap in the ensemble. This pattern is consistent with Gemini 3.1 being the strictest judge of the three.
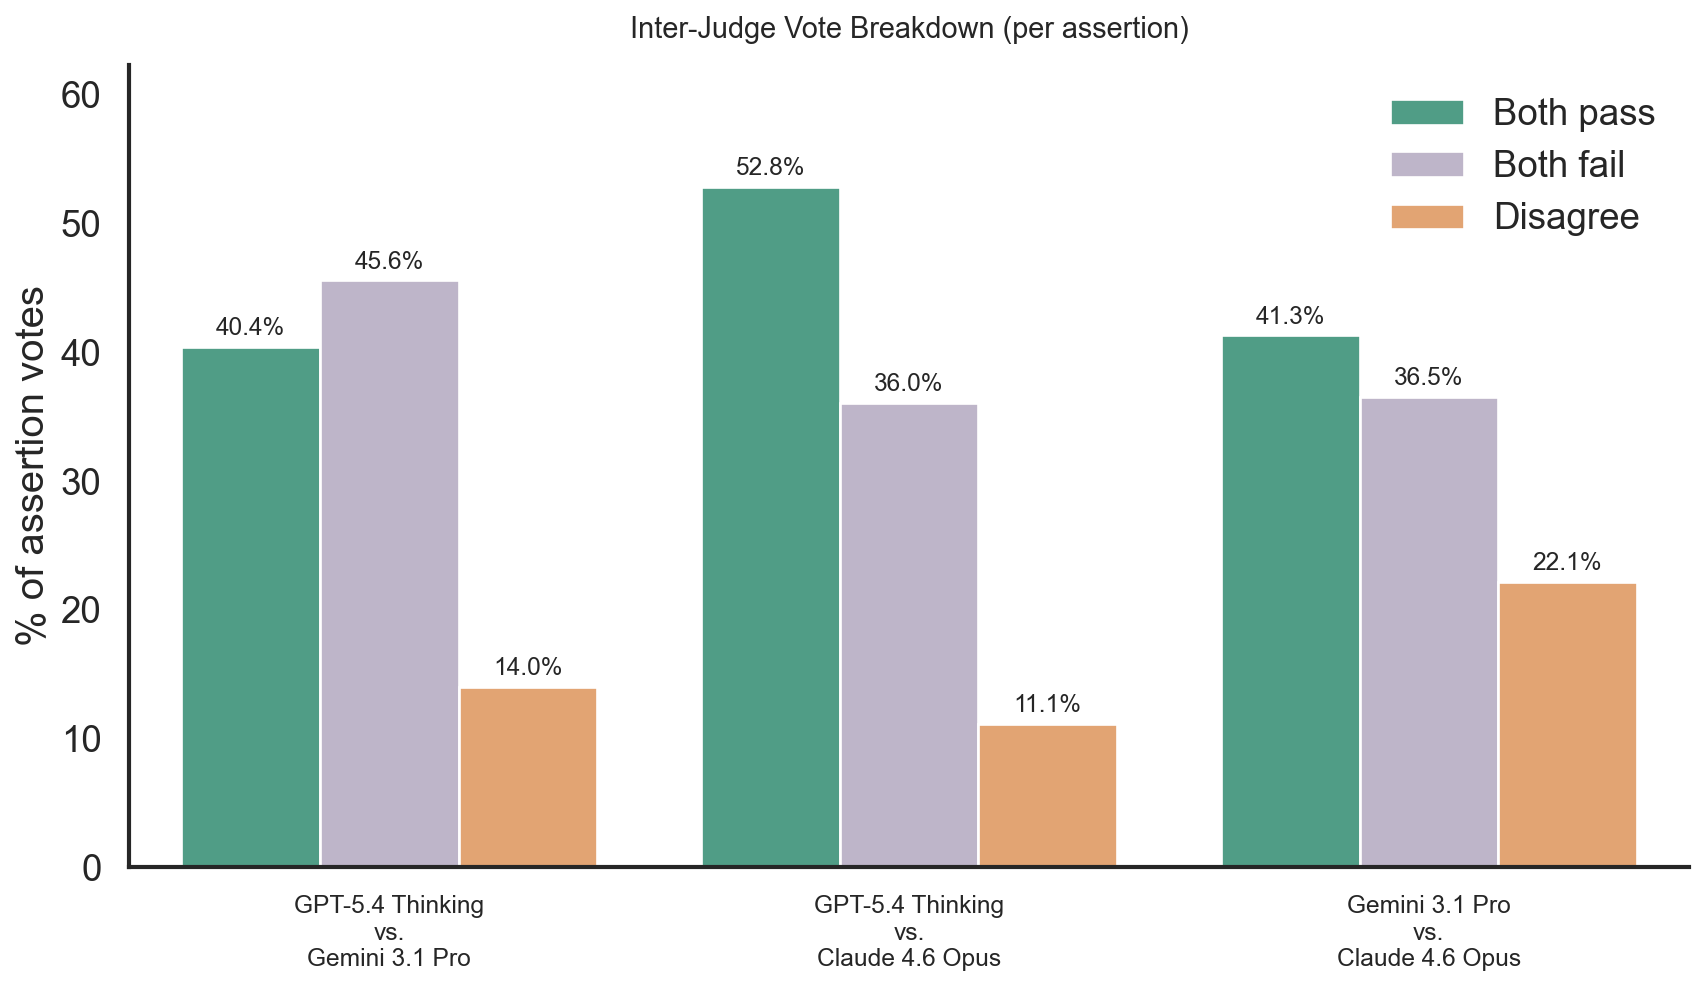
The \(3\)-judge majority vote reduces idiosyncratic strictness bias from any single model. Combined with the low evaluation-noise variance reported in §4.4, the high pairwise agreement supports treating the majority verdict as a stable measurement.
22.0.0.2 Leave-one-out judge ablation.
To quantify each judge’s marginal contribution to the 3-judge majority vote, we hold out one judge at a time and look at the verdict produced by the remaining two. A pair is decisive when the two remaining judges agree (the full 3-judge majority must match them); otherwise the pair ties and the held-out judge is the sole tie-breaker. To characterise how coherent the surviving pair is on its own, we also report Cohen’s \(\kappa\) on the same set of assertions.
| Held-out judge | 2-judge decisive | 2-judge tie | Cohen \(\kappa\) | ||||||
|---|---|---|---|---|---|---|---|---|---|
| Claude 4.6 Opus | % | % | |||||||
| Gemini 3.1 Pro | % | % | |||||||
| GPT-5.4 Thinking | % | % |
4pt
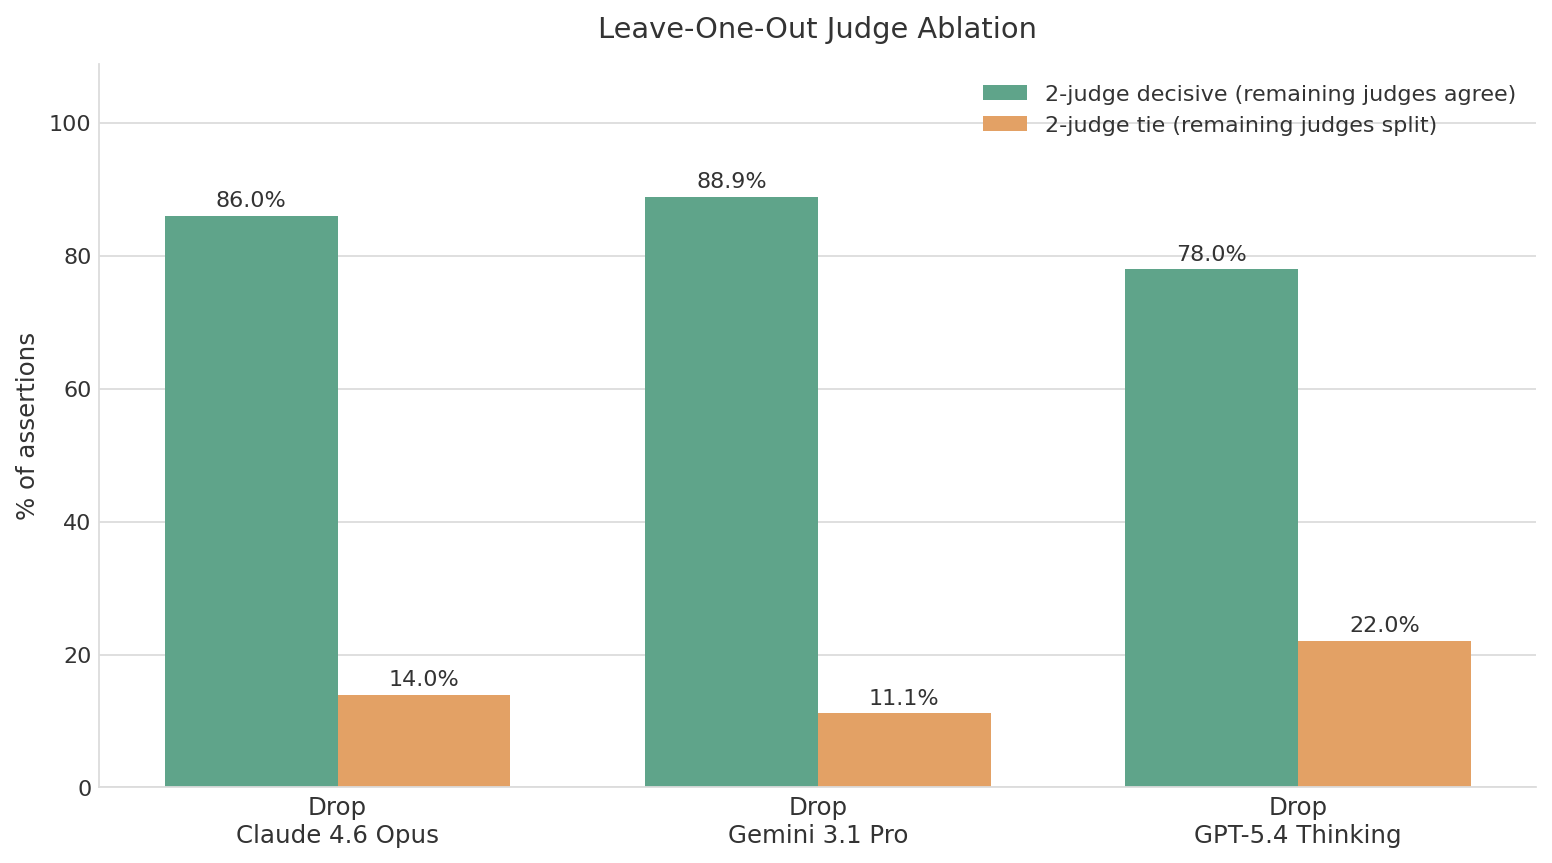
The analysis yields three main observations:
GPT-5.4 Thinking is the most stabilising judge. Removing it leaves Claude and Gemini tied on 22.0% of assertions and gives the weakest pair-level agreement (\(\kappa = 0.579\)) — roughly double the tie rate observed when either Claude or Gemini is removed, consistent with GPT-5.4’s central pass rate (53.6%) sitting between Claude’s (63.5%) and Gemini’s (41.7%).
Claude + GPT-5.4 is the most coherent 2-judge subset. Dropping Gemini yields the lowest tie rate (11.1%) and the highest chance-corrected agreement (\(\kappa = 0.773\)), so this pair alone already reproduces 88.9% of the panel’s decisions.
No single pair dominates. Even the strongest pair leaves \(\sim\)11% of assertions undetermined, and the weakest leaves 22%. The third judge therefore contributes a non-trivial deciding vote on a meaningful fraction of cases in every configuration.
Together these results justify keeping all three judges: every 2-judge subset shows a materially higher tie rate than the full panel resolves, and the spread of \(\kappa\) values (0.58–0.77) confirms that the three judges are not redundant.
23 Query-Level Macro-Average Accuracy↩︎
The headline metric in §4 is assertion-level (micro-average) accuracy: every assertion contributes equally, so queries with more assertions contribute proportionally more to the score. As a robustness check we also compute a query-level macro-average, where each query’s per-assertion pass rate is computed first and the resulting per-query rates are averaged with equal weight: \[\mathrm{Acc}_{\mathrm{macro}} = \frac{1}{|Q|} \sum_{q \in Q} \frac{\sum_{i} y_{q,i}}{|A_q|},\] where \(|Q|\) is the number of queries and \(|A_q|\) is the assertion count for query \(q\). This weighting is more sensitive to short queries (which contribute less under the assertion-level definition) and dampens the influence of long queries with many assertions.
Table 9 reports the query-level numbers with the same scrape-level \(95\%\) CI construction used in §4.4. The model ranking is identical to the assertion-level ranking and all qualitative findings carry over: GPT-5.5 Thinking and Claude Opus 4.7 form a top tier with non-overlapping CIs, and Gemini 3.1 Pro is clearly separated. Absolute scores are roughly \(3\)pp higher than assertion-level across all three models, indicating that shorter queries (with fewer assertions) tend to be answered more accurately than longer ones on average.
| Model | Accuracy | Overall Var | Scrape Var | Eval Var | \(95\%\) CI (\(\pm\)) |
|---|---|---|---|---|---|
| GPT-5.5 Thinking | \(62.70\%\) | \(0.42\) | \(0.45\) | \(0.15\) | \(\pm 1.13\) |
| Claude Opus 4.7 | \(59.97\%\) | \(0.32\) | \(0.34\) | \(0.14\) | \(\pm 0.84\) |
| Gemini 3.1 Pro | \(49.21\%\) | \(0.80\) | \(0.91\) | \(0.20\) | \(\pm 2.25\) |
3pt
24 Weighted Domain Q&A Scores↩︎
§3.0.0.1 reports unweighted assertion accuracy as the headline metric and notes that per-assertion weights are reported in this appendix as a secondary signal. We do so for transparency: although weights are not calibrated across raters and are not directly comparable across rubrics, readers may want to see how scores shift when expert-assigned importance is taken into account.
24.0.0.1 Weighting scheme.
Weights are normalized post-hoc as described in §3.0.0.1: the independent-rubric collection uses a primary/secondary distinction normalized to 7.5/2.5 per assertion (treating primary as 3\(\times\) more important than secondary); the other two collections have weights on a 1–10 scale; Within each query, a model’s weighted score is \(\sum_i w_i y_{q,i} / \sum_i w_i\), where \(w_i\) is the normalized weight of assertion \(i\) and \(y_{q,i}\) is the binary judge verdict.
24.0.0.2 Weighted headline results.
Table 10 reports weighted assertion accuracy for the three evaluated systems on the Domain Q&A track, alongside the unweighted headline scores reported in the main paper (§5).
| Model | Unweighted (%) | Weighted (%) |
|---|---|---|
| OpenAI GPT-5.5 Thinking | 59.3 | 61.0 |
| Anthropic Claude Opus 4.7 | 56.8 | 59.2 |
| Google Gemini 3.1 Pro | 45.7 | 47.3 |
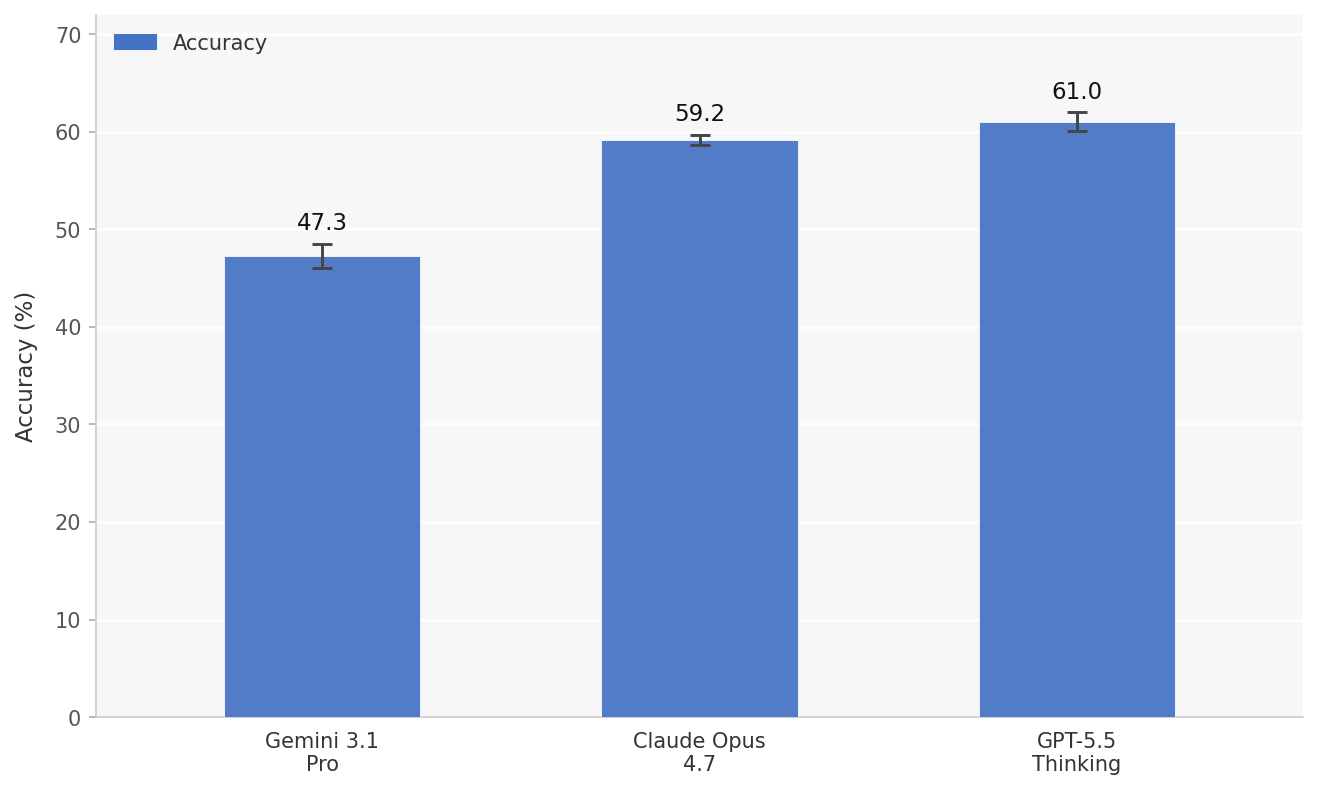
24.0.0.3 Comparison of rankings.
Weighted and unweighted scores agree on model rankings: GPT-5.5 Thinking ranks first, followed by Claude Opus 4.7, with Gemini 3.1 Pro trailing. The unweighted-to-weighted gain is uneven across systems, \(+1.7\)pp for GPT-5.5 Thinking, \(+2.4\)pp for Claude Opus 4.7, and \(+1.6\)pp for Gemini 3.1 Pro, so weighting modestly narrows the top-two gap from \(2.5\)pp under unweighted scoring (59.3% vs.%) to \(1.8\)pp under weighted scoring (61.0% vs.%). Expert-assigned weights therefore favor Claude slightly relative to the per-assertion average, but not enough to change the headline ordering.
24.0.0.4 Weighted breakdown by file type.
Figure 12 shows weighted accuracy across the five file-type buckets. Per-file-type leaders are identical to the unweighted picture in §7: GPT-5.5 Thinking leads on Word (70.1%) and Word\(+\)PPT (69.3%); Claude Opus 4.7 leads on Excel (53.8%) and the mixed Word\(+\)Excel input (55.0%); GPT-5.5 Thinking marginally leads on PowerPoint (60.9% vs.%). Weighting shifts per-bucket point estimates by under \(3\)pp across the board, and the Claude-vs-GPT gap on Word\(+\)Excel widens slightly from \(\sim\) \(7\)pp under unweighted scoring to \(\sim\) \(8\)pp under weighted scoring; otherwise weighting does not change the cross-system story on any file-type bucket.
![Figure 12: Weighted Domain Q&A accuracy by file type. Equivalent to Figure [fig:filetypes] but with per-assertion expert importance weights applied.](/article/2607.01245/pics/weighted/model_breakdown_by_filetype.png "fig:")
24.0.0.5 Weighted breakdown by industry.
Figure 13 shows weighted accuracy across the 12 industries. The broad sector-difficulty pattern is preserved, Healthcare & Social Assistance and Wholesale/Retail Trade remain the easiest sectors across systems, Corporate Governance, Supply Chain and Accounting remain the hardest. Per-industry leadership between the top two systems is also largely preserved: GPT-5.5 Thinking leads in \(5\) of \(12\) sectors under weighted scoring vs.\(6\) unweighted, and Claude Opus 4.7 leads in \(7\) vs.\(6\). The single sector that flips from GPT-5.5 to Claude under weighting (Educational Services, \(60.5\% \rightarrow 62.9\%\)) had a within-\(2\)pp margin under unweighted scoring, so the swap is consistent with weighting acting as a small re-ordering of assertions of comparable systems rather than a substantive shift. Gemini 3.1 Pro remains the per-industry leader in zero sectors under either scheme.
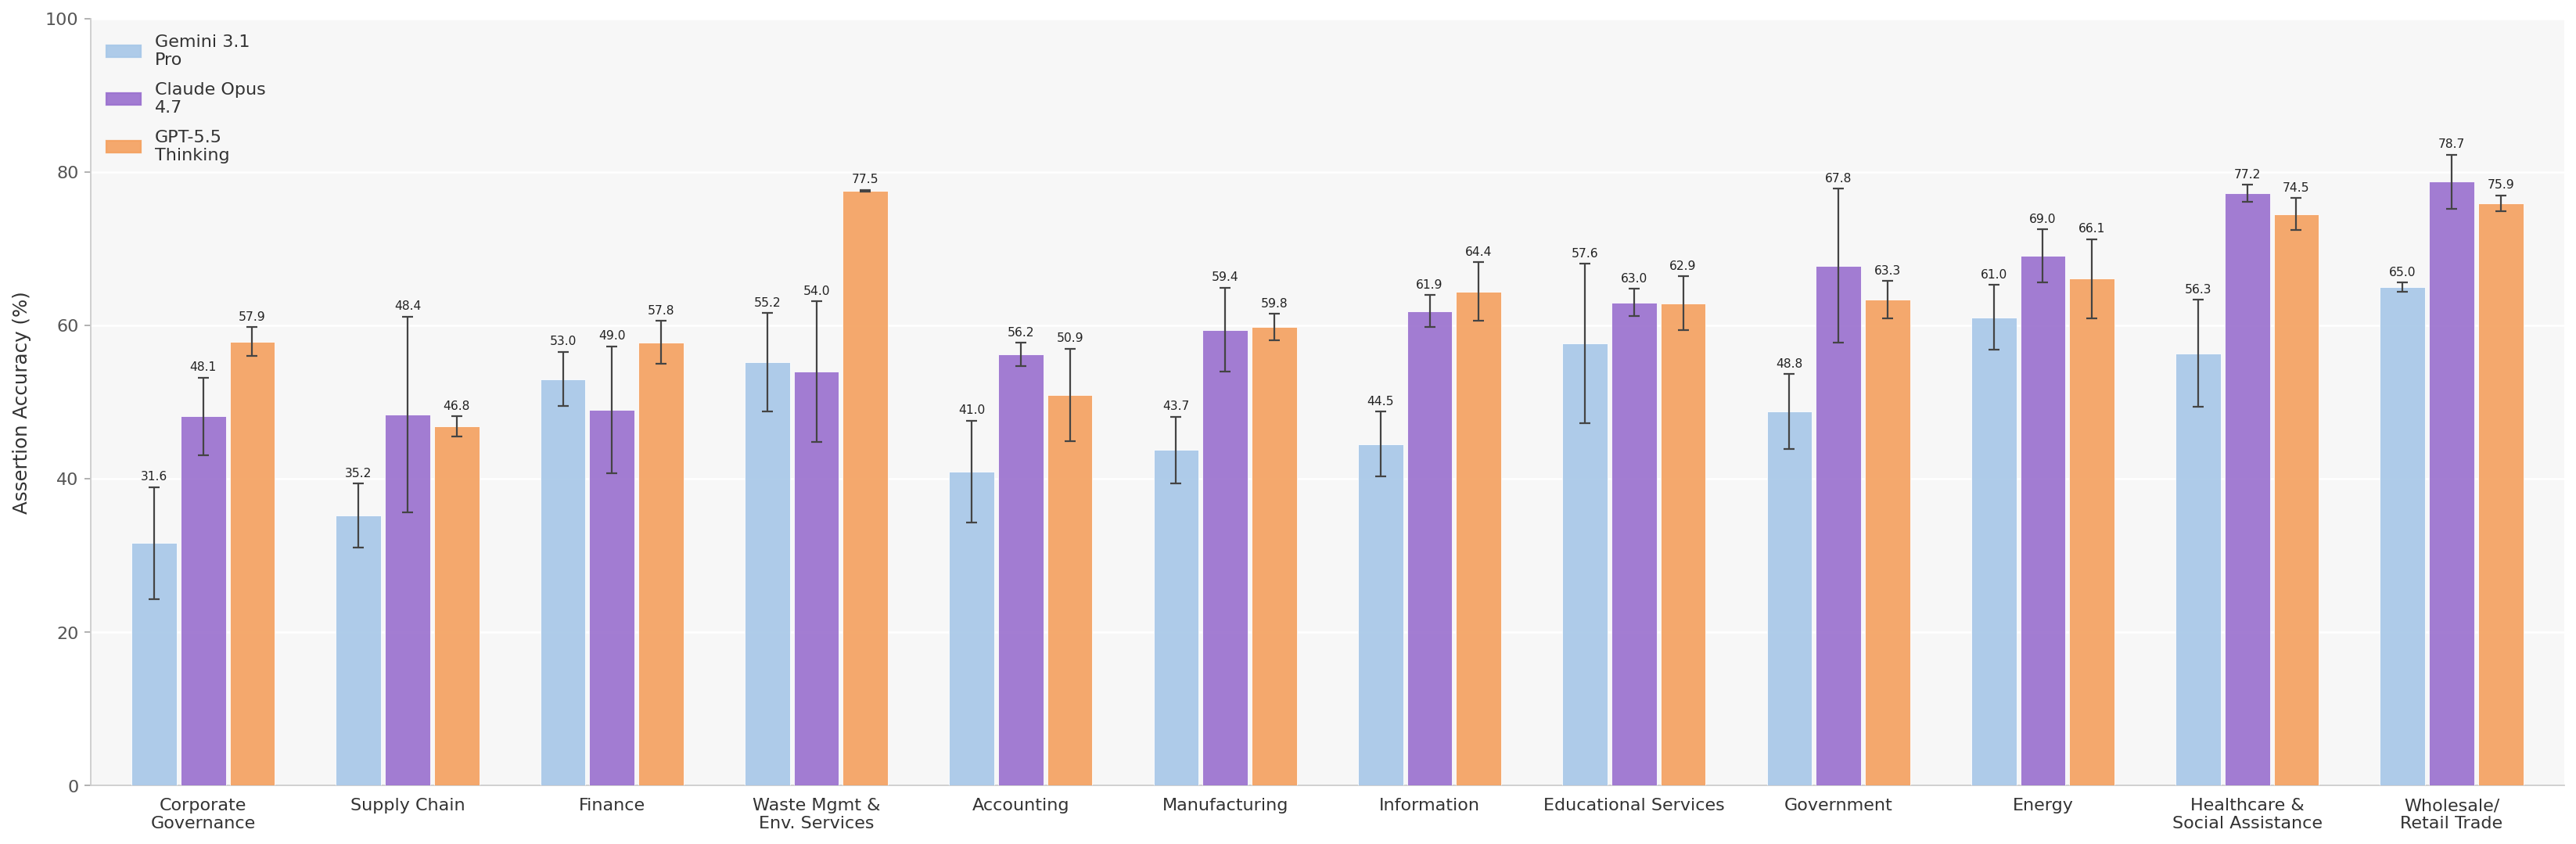
24.0.0.6 Caveat: rater-level weight calibration.
As noted in §3.0.0.1, different experts may apply importance weights with different levels of strictness. For example, some raters assign high importance to many assertions or mark most assertions as primary, while others reserve high weights or primary status only for the most essential claims. Since importance weights were not calibrated across raters during collection, weighted scores should be interpreted as meaningful within a given rubric or slice, rather than as fully absolute signals across the entire benchmark. Readers comparing weighted scores across OCB slices should account for this potential rater-level variation. The per-industry leader shift discussed above, in particular, may partly reflect rater-level weighting practice rather than a model capability difference.
25 Test-Time Compute Ablations — Numerical Results↩︎
Table 11 reports the full numerical results behind the test-time compute ablation figures in §8.
| Model | Mode | Accuracy | Acc. CI (\(\pm\)) | Time (s) | Time CI (\(\pm\)) |
|---|---|---|---|---|---|
| Claude Opus 4.7 | Standard-Thinking | \(56.83\%\) | \(\pm 0.61\) | \(98.0\) | \(\pm 13.8\) |
| Claude Opus 4.7 | Adaptive-Thinking | \(58.93\%\) | \(\pm 2.05\) | \(138.6\) | \(\pm 6.4\) |
| GPT-5.5 | Thinking-Light | \(59.11\%\) | \(\pm 3.07\) | \(53.0\) | \(\pm 18.9\) |
| GPT-5.5 | Thinking-Standard | \(59.35\%\) | \(\pm 1.11\) | \(62.3\) | \(\pm 4.3\) |
| GPT-5.5 | Thinking-Extended | \(59.79\%\) | \(\pm 0.84\) | \(91.3\) | \(\pm 22.4\) |
| GPT-5.5 | Thinking-Heavy | \(59.81\%\) | \(\pm 0.77\) | \(105.3\) | \(\pm 21.4\) |
| GPT-5.5 | Pro-Standard | \(61.55\%\) | \(\pm 0.79\) | \(239.6\) | \(\pm 25.1\) |
| GPT-5.5 | Pro-Extended | \(\mathbf{63.09\%}\) | \(\pm 3.57\) | \(358.3\) | \(\pm 50.0\) |
4pt
26 Human-Annotator Baseline on File Fidelity↩︎
To anchor the File Fidelity headline numbers against a human reference, we collected accuracy from human annotators on a substantial subset of File Fidelity Q&A queries. The dashed horizontal lines in Figure 2 (§5) report the per-application annotator accuracy: \(78.6\%\) on Word, \(68.3\%\) on PowerPoint, and \(45.9\%\) on Excel.
26.0.0.1 Annotator pool.
Annotators are familiar with general office literacy (proficient with Word, Excel, and PowerPoint at a working-professional level) rather than specialized domain expertise. This is important context for interpreting the Excel result, where many File Fidelity queries require quantitative reasoning (formula tracing, cross-sheet aggregations, computing aggregates over filtered ranges) that domain-matched annotators would likely answer more accurately. The Word and PowerPoint annotator baselines are correspondingly more informative of an attainable single-rater ceiling than the Excel baseline.
26.0.0.2 Coverage.
Annotators answered a substantial subset of File Fidelity queries per application: \(96.6\%\) of PowerPoint queries, \(91.9\%\) of Word queries, and \(76\%\) of Excel queries. The unanswered fraction reflects queries that were added to the benchmark after the annotation pass completed, not selective exclusion of harder items.
26.0.0.3 Setup.
Annotators received the file and the question with the same single-pass setup used for the LLM systems: the source file is provided, the question is asked once, and the annotator produces a free-form response. Each query was answered by one annotator. Annotator responses were scored against the same atomic assertion rubrics used for the LLM responses, so the human-annotator and LLM-system numbers are directly comparable on a query-by-query, assertion-by-assertion basis.
26.0.0.4 Caveats.
The baseline has two methodological limitations, also acknowledged in the main paper’s Limitations section. First, with one rater per query, no inter-rater agreement is measured; reported accuracy reflects a single rater’s judgment and does not bound the variance of a multi-rater consensus. Second, the annotator pool was selected for general office literacy rather than specialized expertise, which particularly affects categories requiring numerical or analytical reasoning. A larger multi-rater baseline with domain-matched annotators is left to future work.
27 File Fidelity Q&A — Per-App Performance Breakdowns↩︎
This appendix expands §6 with the full per-application breakdowns: accuracy decomposed across the artifact-type taxonomy of §19 and accuracy as a function of file size, separately for each of Word, Excel, and PowerPoint. Size buckets are defined per-app using the natural document unit, pages for Word, worksheets for Excel, and slides for PowerPoint, with thresholds stated in each subsection below.
27.1 Word↩︎
27.1.0.1 Accuracy by feature.
Figure 14 shows per-artifact accuracy for the 15 Word artifact categories defined in Appendix 19. Claude Opus 4.7 dominates across nearly every category, scoring 100% on Comment, Equation, Hyperlink, and Text, and remaining above 80% on Table, Font, Textbox, Layout, Strikeout, Footnote, and Footer. GPT-5.5 Thinking is competitive on text-centric artifacts (Text 100%, Table 96%, Footnote 89%, Comment 75%) but drops sharply on formatting and structural artifacts (Hyperlink 6%, Font 17%, Header 17%, Textbox 27%, Layout 29%, Footer 36%, Metadata 6%). Gemini 3.1 Pro shows the most uneven profile: strong on plain text and tables (Text 96%, Table 90%, Equation 83%) but near-zero on structural and metadata artifacts (Comment 8%, Hyperlink 11%, Font 14%, Layout 10%, Header 8%, Footer 0%, Highlight 8%, Metadata 0%). The divergence on structural artifacts is the dominant source of the overall Word performance gap between Claude Opus 4.7 and the other two systems.
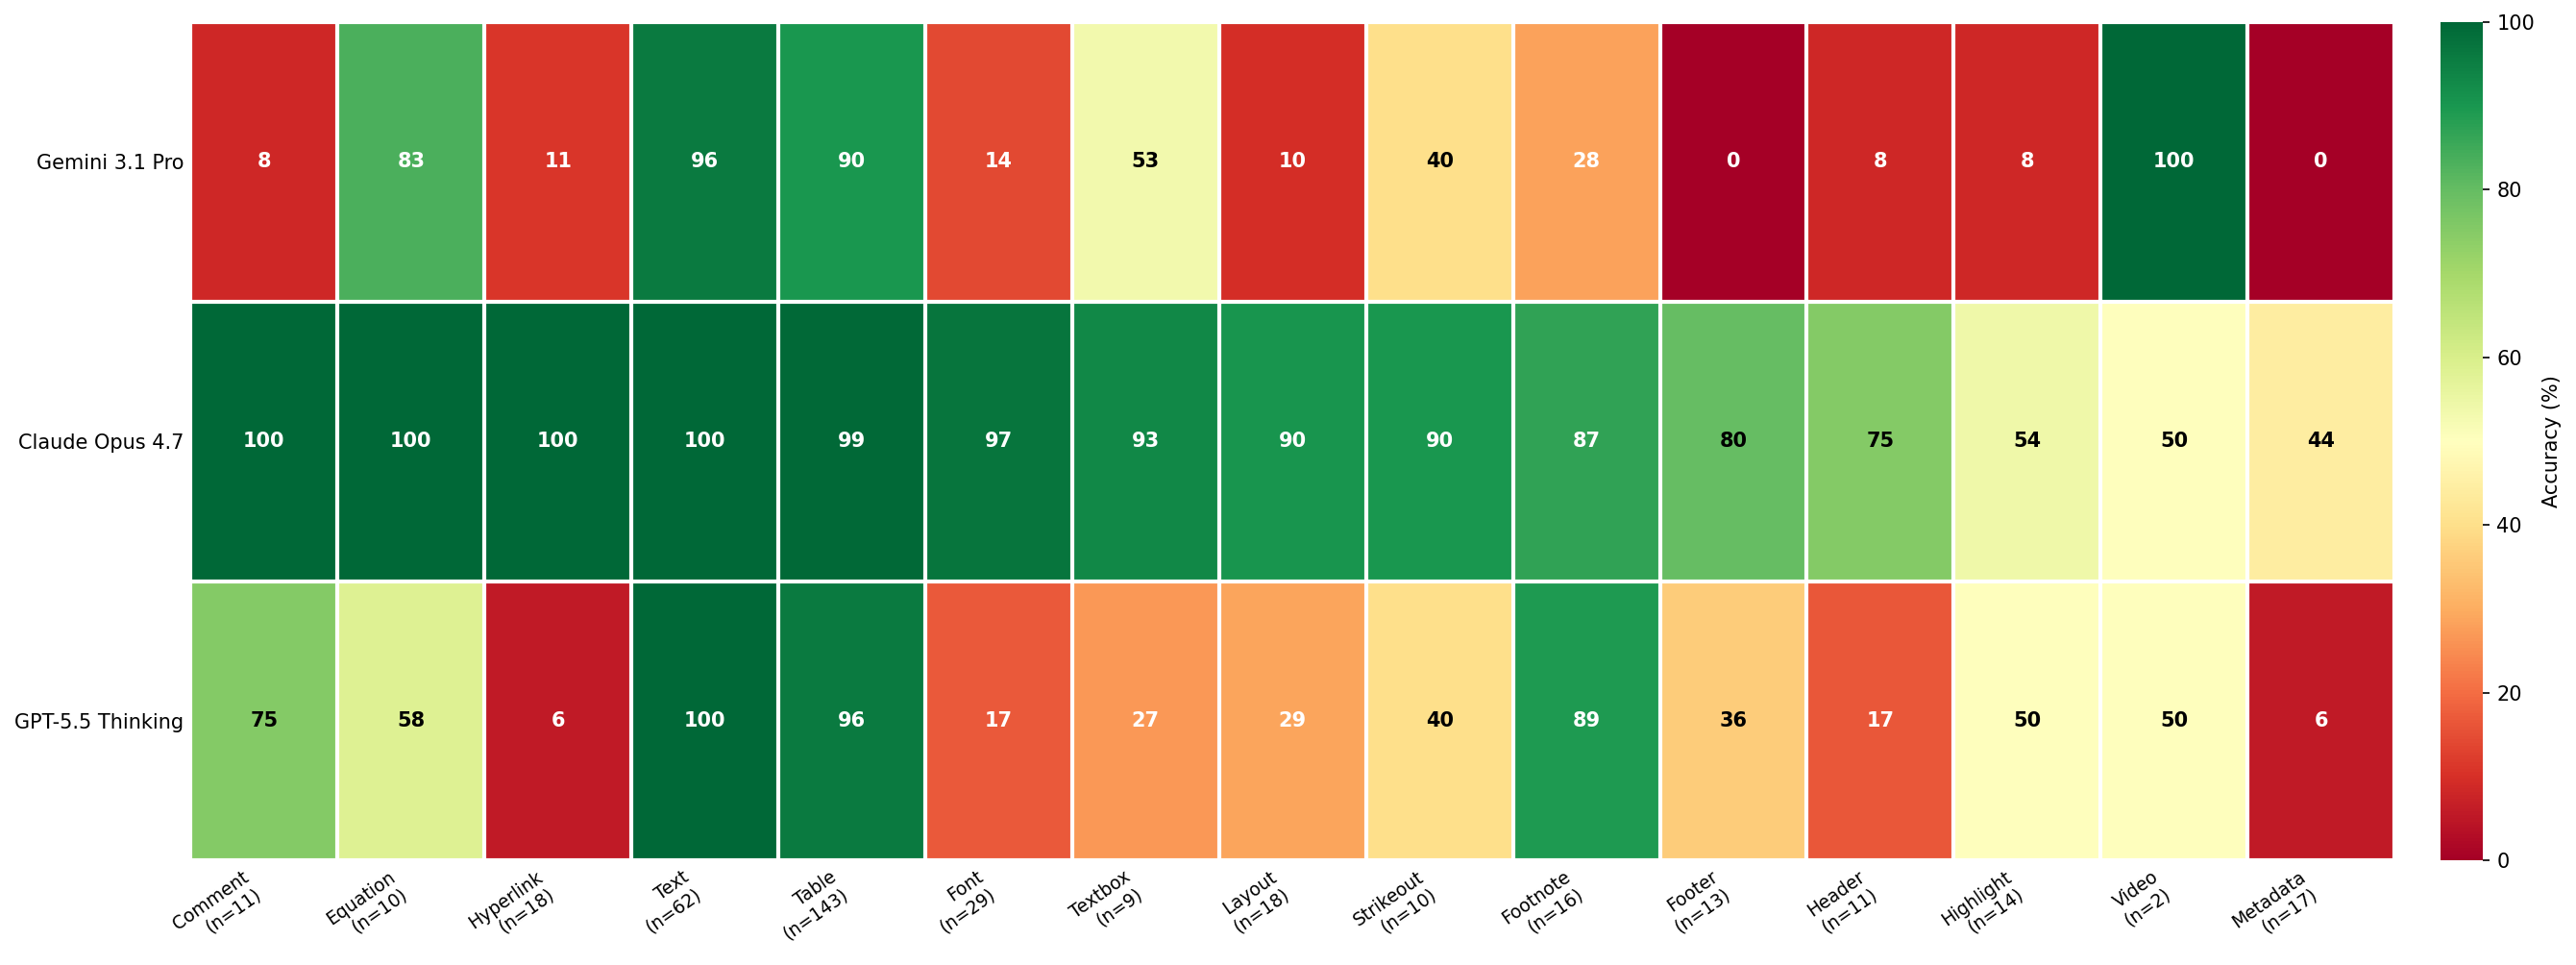
27.1.0.2 Accuracy by file size.
Documents are bucketed by page count: Small (\(\leq\)10 pages), Medium (11–30 pages), and Long (\(>\)30 pages). Figure 15 shows accuracy stratified by document length (Small / Medium / Long). Claude Opus 4.7 maintains high accuracy across all three buckets (96% / 81% / 88%), with only modest degradation on medium documents. GPT-5.5 Thinking and Gemini 3.1 Pro both show a pronounced cliff between Small and Medium/Long: GPT-5.5 drops from 83% on Small to 48% / 39% on Medium / Long, and Gemini 3.1 Pro drops from 71% on Small to 27% / 32%. Long-document robustness is therefore a clear differentiator on the Word track.

27.2 Excel↩︎
27.2.0.1 Accuracy by feature.
Figure 16 shows per-artifact accuracy across the Excel taxonomy. The three systems perform comparably on the structured spreadsheet objects, formal Tables (Gemini 78%, Claude 81%, GPT-5.5 86%) and Sheets (94% / 88% / 100%). Claude and GPT-5.5 reach 100% on PivotTables, while Gemini reaches 80% (\(n{=}5\), so these should be read with caution). Differences emerge on formula-grounded queries, where Claude Opus 4.7 (76%) and GPT-5.5 Thinking (80%) substantially outperform Gemini 3.1 Pro (44%), and on embedded images, where Gemini 3.1 Pro scores 0% versus 50% (Claude) and 86% (GPT-5.5). Table-Like Ranges (TLR), the largest category in the Excel benchmark with 133 queries, remains the hardest artifact for all systems, Gemini 48%, GPT-5.5 55%, Claude 58%, reflecting the difficulty of inferring row/column structure from contiguous cell ranges that are not formally registered as Excel Tables.
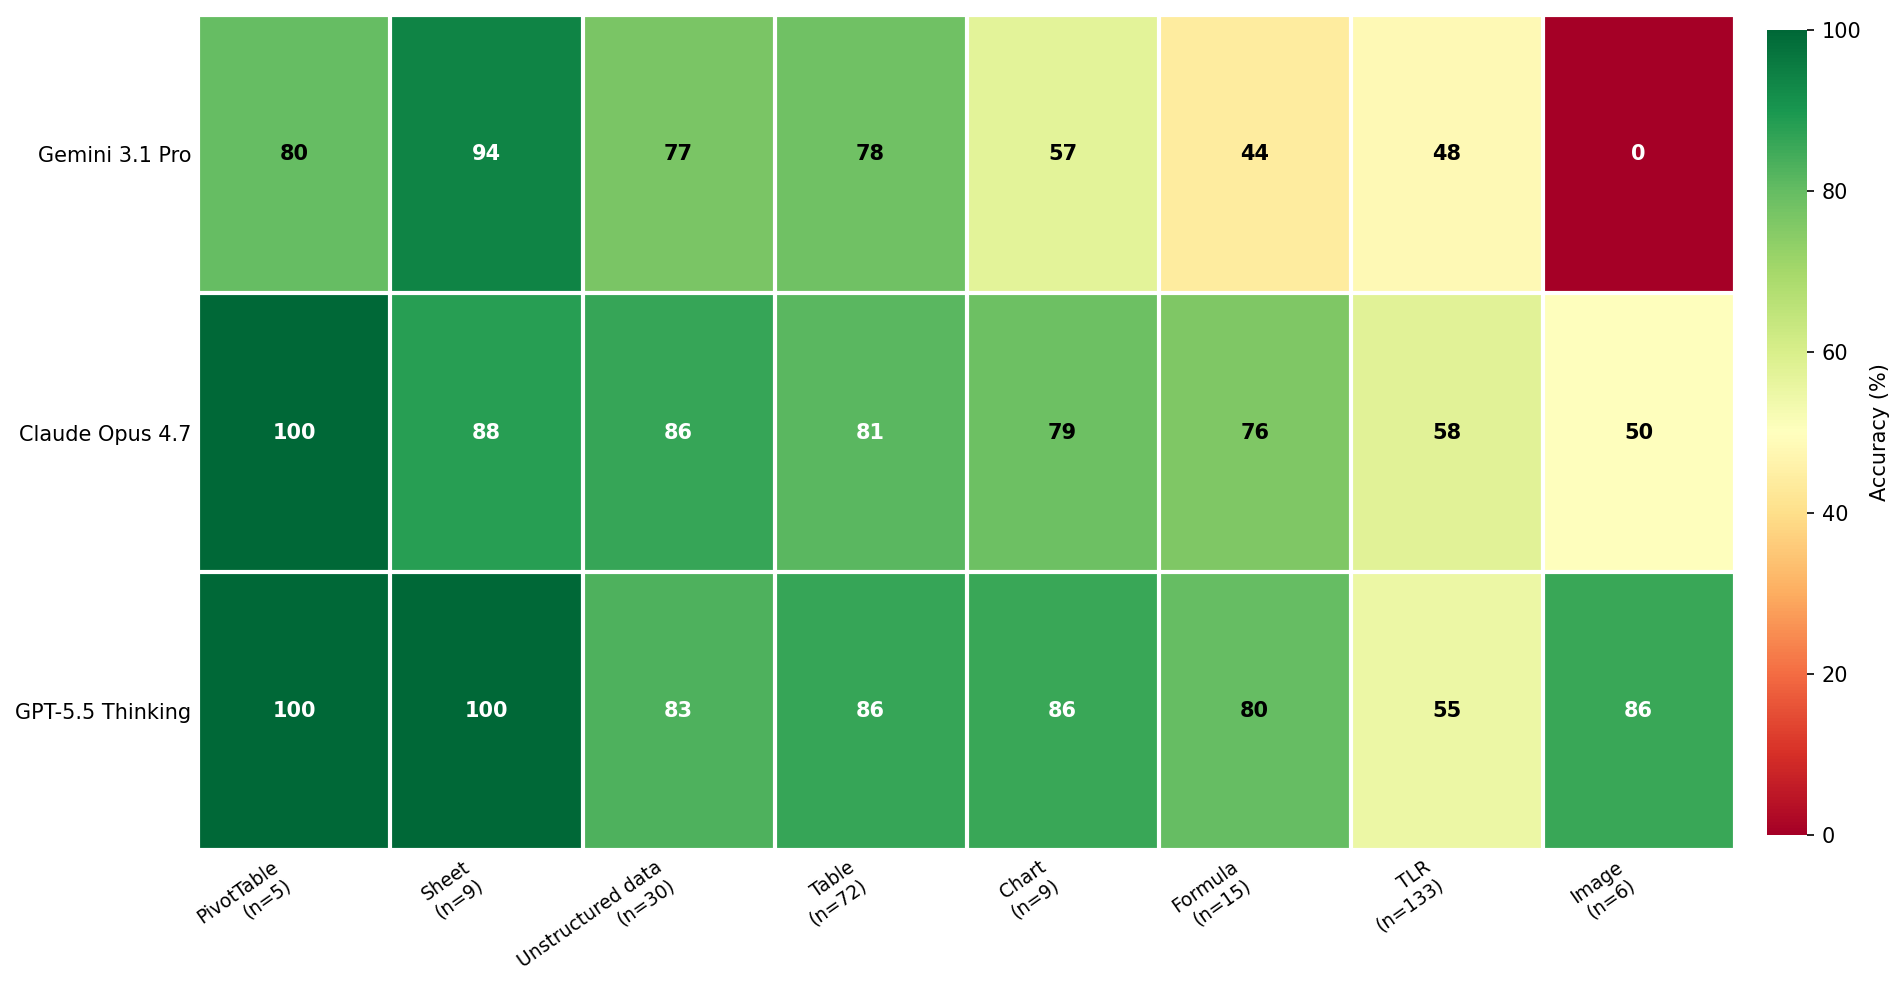
27.2.0.2 Accuracy by file size.
Workbooks are bucketed by worksheet count: Small (1–3 sheets), Medium (4–8 sheets), and Long (\(>\)8 sheets). The Long bucket is dominated by a single 87-sheet workbook contributing 12 of the queries in that bucket, so per-system Long-bucket scores should be interpreted as a small-sample signal rather than a robust estimate. Figure 17 shows accuracy by workbook size. From Small to Medium, all three systems improve markedly, Claude Opus 4.7 from 65% to 81%, GPT-5.5 Thinking from 64% to 89%, and Gemini 3.1 Pro from 54% to 72%. We attribute this Small-to-Medium gain to a composition shift rather than a true size effect: Small-bucket workbooks are dominated by sparse, loosely structured layouts heavy in TLR and unstructured content, whereas Medium-bucket workbooks more often contain formal Tables, named Sheets, and well-defined formulas, which all three models handle more reliably. The Long-bucket numbers (Claude 96%, GPT-5.5 92%, Gemini 85%) extend the apparent trend but, as noted above, reflect a single 87-sheet workbook with 12 queries; we therefore treat them as a single-document signal rather than evidence of a continued size effect, and we caution against reading Medium-to-Long as a robust trajectory.
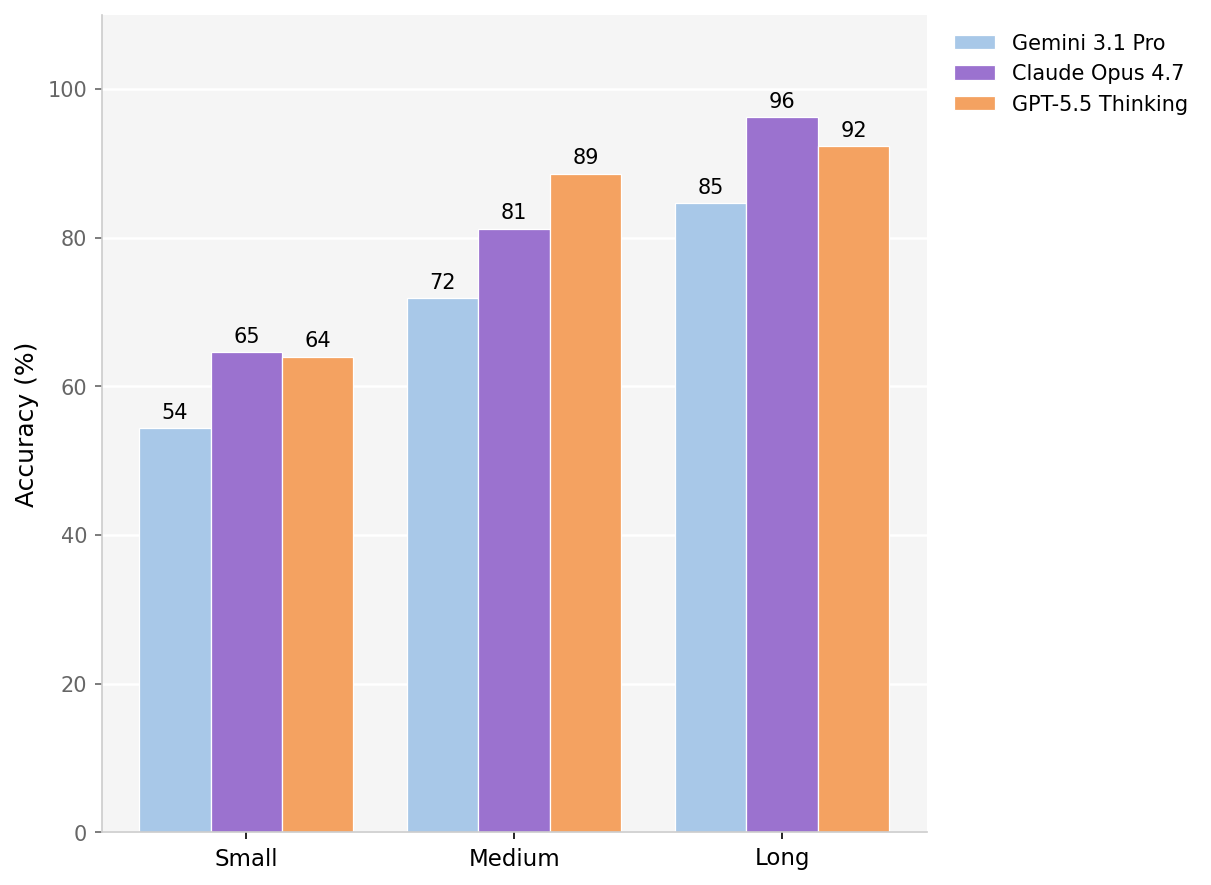
27.3 PowerPoint↩︎
27.3.0.1 Accuracy by feature.
Figure 18 shows per-artifact accuracy across the 21 PowerPoint categories defined in Appendix 19. Claude Opus 4.7 is the strongest system on PowerPoint, scoring 100% on Animations, Equation, Language, Metadata, Shapes / Type & Color, Slide Properties, Hidden, SmartArt / Semantics, Tables / Cell color coding, Tables / Values, and Text Highlight, and remaining above 80% on the bulk of the remaining categories (Image 92%, Chart 86%, Hyperlink 86%, Position/Association/Grouping 85%, Slide Text 85%, Header/Footer/SlideNum/DateTime 80%). GPT-5.5 Thinking is close behind on text and tabular artifacts but drops on Metadata (67%), Header/Footer/SlideNum/DateTime (60%), Shape/Text (56%), and Ink (33%). Gemini 3.1 Pro again shows the widest spread, with strong results on Language (100%), SmartArt / Semantics (100%), Tables / Cell color coding (100%), and Hyperlink (86%), but near-zero on Slide Note (0%) and Section (0%), and weak performance on Shape/Text (22%), Metadata (33%), Chart (36%), and Header/Footer/SlideNum/DateTime (40%). Many of the smallest categories (\(n=2\) or \(n=3\)) should be interpreted with caution, but the broad pattern, Claude \(>\) GPT-5.5 \(>\) Gemini, with the gap widening on app-specific structural artifacts, is consistent.
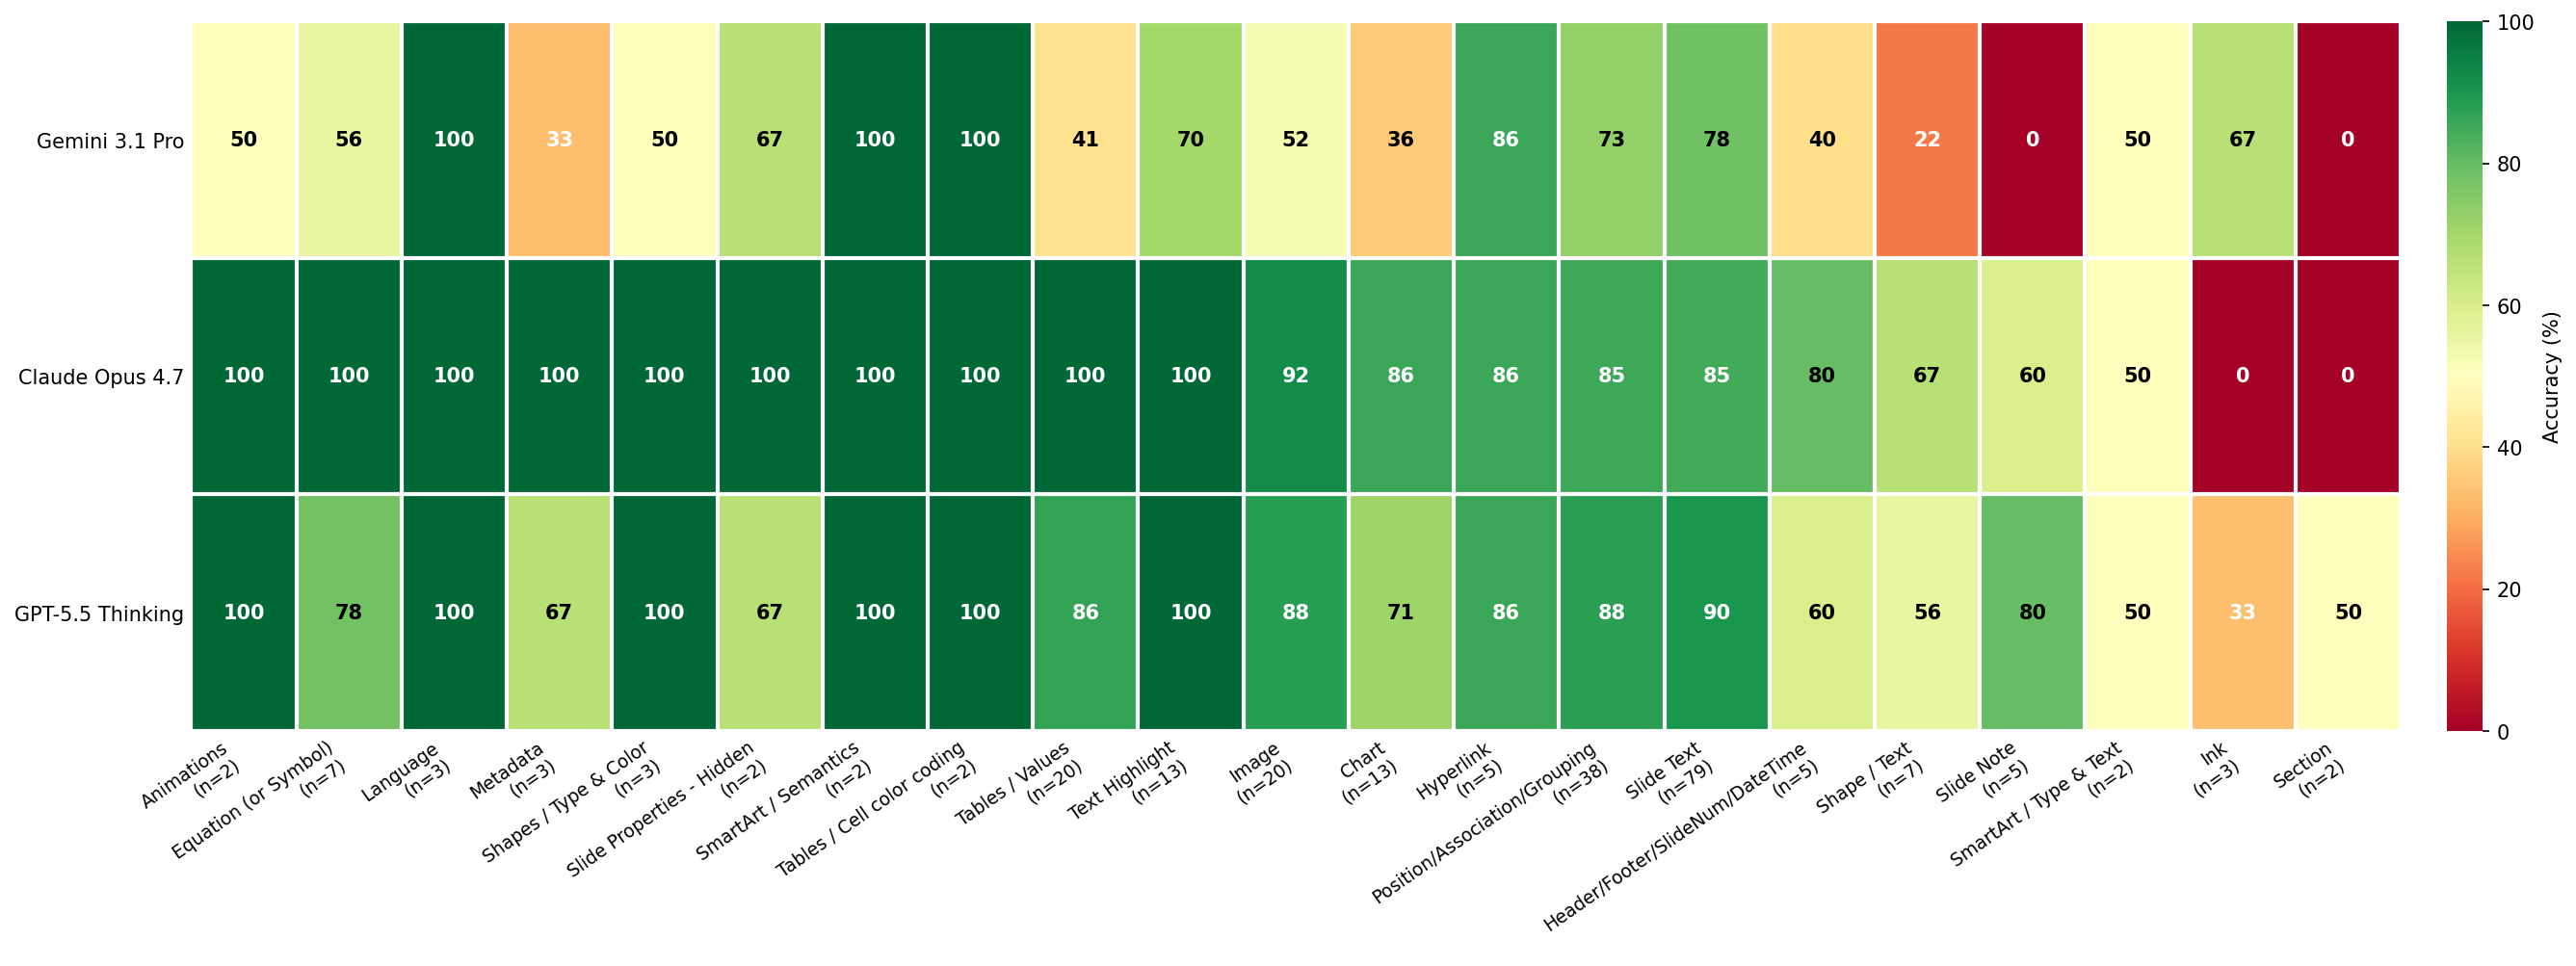
27.3.0.2 Accuracy by file size.
Decks are bucketed by slide count: Small (\(\leq\)10 slides), Medium (11–30 slides), and Long (\(>\)30 slides). Figure 19 shows accuracy stratified by deck size. Claude Opus 4.7 and GPT-5.5 Thinking are essentially flat across Small, Medium, and Long decks (Claude: 87% / 86% / 87%; GPT-5.5: 87% / 86% / 85%), indicating that PowerPoint comprehension for these systems is not strongly limited by deck length. Gemini 3.1 Pro is weaker overall (61% / 70% / 61%) and shows a non-monotonic pattern, peaking on Medium decks.
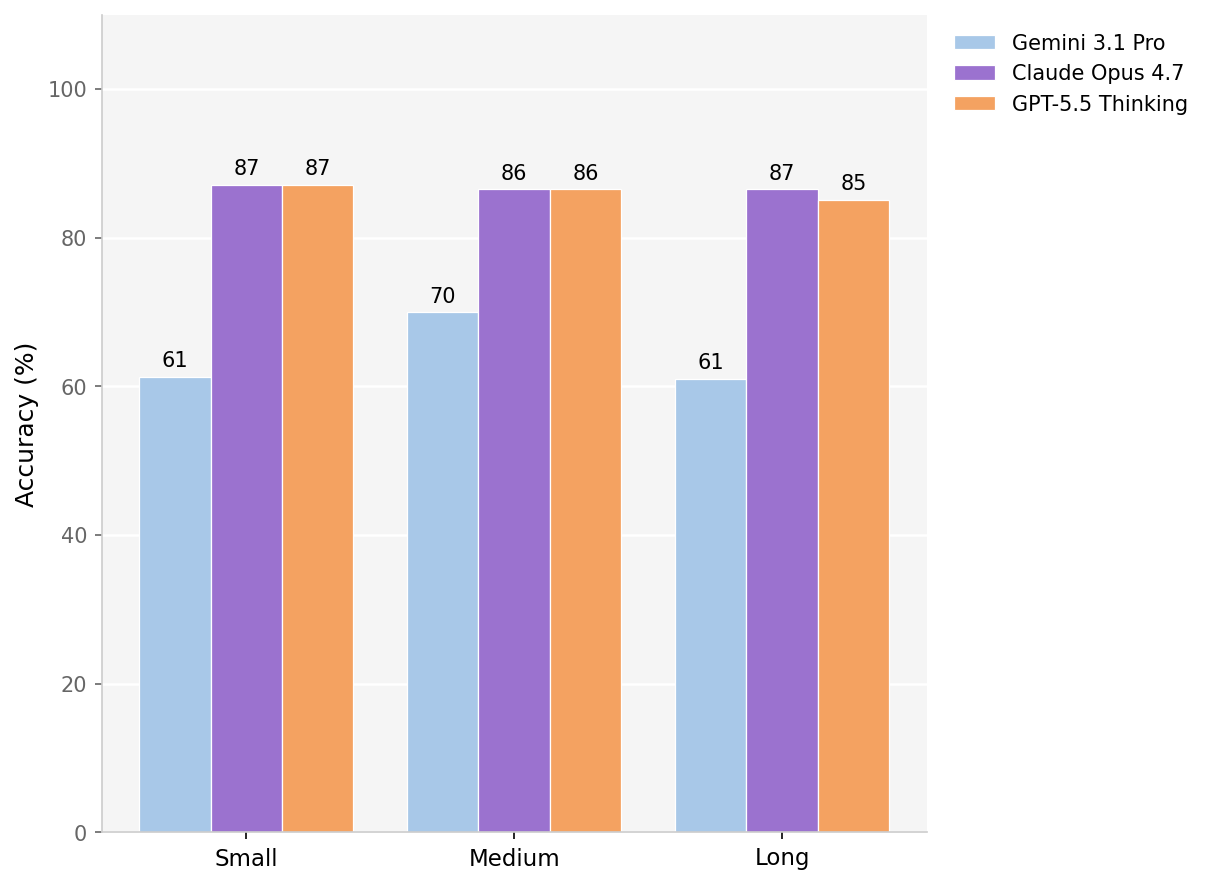
4pt
28 Differentiation from Other Document-Comprehension Benchmarks↩︎
Table 12 summarizes the difference between our benchmark and other existing benchmark, showcasing the gaps that we are attempting to fill.
References↩︎
Subject LLM systems are queried through their public web chat interfaces rather than via API, so that evaluation jointly stresses native file parsing and end-to-end reasoning. Scrapes were collected between April 2, 2026 and May 18, 2026; reported results therefore reflect the state of each system’s deployed web chat interface during that window. GPT-5.5 Thinking and Claude Opus 4.7 use their Standard thinking setting; Gemini 3.1 Pro has no analogous setting. Models are instructed not to perform web search or ask clarifying questions. A small set of queries that include supporting URLs and explicitly require web retrieval are exempted from this. Claude Opus 4.7 and GPT-5.5 Thinking are also instructed to reply in chat, since both otherwise tend to return downloadable
.xlsxor.docxartifacts for analytical queries.↩︎Treating the \(9\) runs as independent would understate uncertainty because eval reps within a scrape share the same model response and are positively correlated, the classical clustered-data problem [16]. We therefore construct the headline CI from scrape-level variance, the cluster-level estimator recommended by [15], and use sample standard deviations (\(n{-}1\)) throughout. Empirically, response-sampling noise also dominates judge noise for typical LLM benchmarks [17], which we confirm below.↩︎
The 3-scrape, 3-evaluation protocol is applied only to Domain Q&A, where open-ended analytical responses and large per-query assertion sets make run-to-run variance the most consequential. For File Fidelity Q&A, where each query is scoped to a single artifact and per-assertion variance is much lower, we run a single scrape and a single evaluation pass per model.↩︎