Comparing the Emotional Impact of Thematic Versus Episodic Framing in Visualization Text
June 30, 2026
Textual elements in data visualizations—such as titles, annotations, and captions—play a central role in shaping how viewers attend to and interpret visualizations. These elements guide attention and serve as anchors for interpretation, influencing what viewers remember and ultimately take away from a visualization [1]–[5]. A growing body of research has examined how textual framing in visualization influences comprehension, recall, and perceptions of bias or neutrality [6]–[8], where framing refers to shaping how people interpret issues by emphasizing certain aspects while omitting others [9]. However, textual framing is not just about cognitive resonance, but also about emotional processes [10]. By selectively emphasizing certain aspects of a dataset, framing can shape not only what people think, but also how they feel [11]. This emotional dimension of framing is particularly important in visualizations that communicate about contentious or socially significant issues, where emotional responses may influence interpretation, engagement, and attitudes [12], [13].
Prior visualization research has shown that framing techniques such as proximity-based framing can influence viewers’ emotional responses [14]. However, political communication and journalism studies identify a richer typology of framing strategies that remain underexplored in visualization contexts [15]. In this work, we focus on one such distinction: episodic versus thematic framing [16]. Episodic frames foreground specific events or individuals, emphasizing concrete and vivid instances, whereas thematic frames highlight broader patterns and trends. In text-based political communication, these two frame types are known to evoke systematically different emotional responses, and their relative persuasive force is conditioned by emotion [10]. This distinction has not been examined in the context of visualizations and we investigate this gap in the domain of mass shooting visualizations—a high-stakes and emotionally charged setting where framing effects are particularly consequential for public discourse [17], [18].
We report a preregistered between-subjects online experiment (N = 800) in which all participants viewed identical bar charts of U.S. mass shooting data from 2001 to 2024, with number of deaths shown in the top chart and incidents in the bottom chart (see Figure [fig:teaser]). Participants were randomly assigned to one of three conditions that varied only in textual framing: (1) a thematic title alone (T), (2) the same thematic title paired with an event annotation (T+Ann), or (3) an episodic title foregrounding a specific incident paired with the same annotation (E+Ann). We measured emotional valence and support for gun control policies both before and after exposure. This design allowed us to examine whether text-driven framing shifts emotional responses and attitudes, and whether emotional change mediates any observed attitude change.
We found that textual framing significantly influenced emotional responses but not policy attitudes directly. While all participants reported more negative emotional valence after viewing the visualization, this decrease was significantly larger under episodic framing; in contrast, adding an annotation to a thematic title did not significantly alter emotional impact. Although framing did not significantly affect post-exposure support for gun control after controlling for baseline attitudes, mediation analysis revealed a significant indirect effect: increased negative emotion under episodic framing predicted greater support for gun control, indicating that framing operates primarily through affect rather than direct persuasion.
This work makes three key contributions. First, it establishes emotional response as a critical, yet underexamined, dimension of textual framing in visualization, showing that titles and annotations shape not only interpretation but also affect. Second, it examines episodic versus thematic framing in visualization, providing empirical evidence that these strategies differ in their emotional impact. Third, it identifies an emotion-mediated pathway linking framing to attitudes, demonstrating that visualizations can influence public opinion indirectly through affect even in the absence of direct persuasive effects. Together, these contributions advance our understanding of textual framing as a rhetorical mechanism in communicative visualizations and highlight the importance of considering both emotional and cognitive effects in visualization design.
1 Background↩︎
1.1 Text in Data Visualization↩︎
Recent visualization research has established that textual elements are not peripheral to charts—they are central to how readers interpret them. Eye-tracking studies have shown that viewers often fixate first on text elements such as titles, legends, and captions, using them as anchors to guide interpretation before examining the underlying data [2]. These elements influence what readers remember and take away from a visualization: titles that emphasize particular aspects of the data can direct attention toward some features while downplaying others [1], [6].
Annotations further extend this role by connecting visualized data to contextual or real-world meaning. Prior work distinguishes between observational text, which describes features of the data, and additive text, which introduces external information [19]. Event annotations—such as labeling a specific incident within a trend—fall into this latter category, embedding real-world context directly within the visualization. Frameworks of semantic levels in visualization text position such contextual annotations as particularly influential, as they introduce external knowledge that can reshape interpretation [20]. Indeed, viewers often prefer text-rich visualizations, valuing the interpretive guidance that annotations provide even at the cost of increased visual complexity [4].
Recent work recognizes that text in visualizations can convey affective meaning, for instance through “valenced subtext” that introduces emotionally charged or value-laden language [21]. However, while such work highlights the presence of emotional framing in visualization text, its impact on viewers’ emotional responses remains largely unexamined.
1.2 Episodic and Thematic Framing↩︎
A widely studied distinction in political communication is between episodic and thematic framing [16]. Episodic frames typically elicit stronger emotional reactions than thematic frames [10], [22]. Additionally, their persuasive effectiveness is shaped by emotion: episodic frames gain persuasive strength as emotional arousal intensifies, because they provide a specific focal point at which emotional reactions can be directed, whereas thematic frames—lacking this focal point—rely more on statistical and rational appeals [10], [22]. We draw on this body of work to inform our hypotheses.
Although episodic and thematic framing are often presented as distinct categories, they are better understood as points along a continuum. Communication artifacts frequently contain both episodic and thematic elements to varying degrees. In this work, we examine one operationalization of episodic and thematic framing by manipulating the accompanying textual framing while holding the visualization design constant.
2 Experiment↩︎
We set up our study as an online survey on Qualtrics and tested the following hypotheses:
H1: Episodic framing will produce more negative emotional change than thematic framing, with emotional change expected to be most negative under episodic framing, followed by thematic with annotation, and least under thematic alone (E+Ann
\(<\) T+Ann \(<\) T).
H2: Episodic framing will lead to greater increases in support for gun control than thematic framing. Accordingly, we expect policy support to be highest under episodic framing, followed by thematic framing with annotation, and lowest
under thematic framing alone (E+Ann \(>\) T+Ann \(>\) T).
H3: Changes in emotional valence will mediate the relationship between framing condition and policy support.
Additional analyses included manipulation checks (perceived framing and policy direction and annotation detection), and baseline equivalence.
Participants: We recruited 800 participants through the Prolific platform. Participants were required to be at least 18 years old, be fluent in English, be located in the United States, and complete the survey on a desktop or laptop device. The median completion time across all experimental conditions was approximately six minutes, and the participants were paid $1.50 for their participation. The target sample size was preregistered based on an a priori power analysis and increased to account for anticipated exclusions and planned exploratory analyses.
Study Material: All participants viewed the same underlying visualization, consisting of two vertically stacked bar charts: the top chart shows the number of people killed, and the bottom chart shows the number of incidents from 2001 to 2024 (see Figure [fig:teaser]). The visualization design, including the use of vertically stacked charts and annotation style, was inspired by similar examples in data journalism, particularly those published by The New York Times [23]. Data for the conditions were obtained from the Violence Project Mass Shooter Database [24], with the source indicated in the visualization across all conditions. Across conditions, the charts were identical in terms of data, axes, colors, and layout. Only the textual elements (title and annotation) were manipulated to vary framing. For the thematic condition, we drew on common headline styles in news articles that emphasize aggregate trends [25] to construct the title “949 people have died in mass shootings since 2001.”
For episodic framing, we selected the Robb Elementary School shooting in Uvalde, Texas (2022) as the focal event. This event was chosen because it is recent, widely recognized, and represents a salient instance within the dataset, frequently highlighted in media coverage [25]. The episodic title foregrounded this event while situating it within the broader trend (“In Uvalde, 19 children lost their lives—one of many mass shootings devastating families since 2001.”)
Because the episodic title explicitly foregrounds a specific event, we paired it with an annotation labeling that event (“Robb Elementary School, Uvalde, Texas”) to create an ecologically realistic instantiation of episodic framing. Without such a reference, readers might expect to locate the highlighted event in the chart. Our goal was to compare a realistic episodic framing strategy against thematic alternatives. We therefore also included a thematic-title-plus-annotation condition to assess whether any observed effects were attributable to the annotation itself. We acknowledge that a fully crossed design including an episodic-title-without-annotation condition would allow a cleaner separation of title and annotation effects and represents an important direction for future work.
Survey Procedure: Participants first provided informed consent and then completed pre-exposure measures of emotional valence (using the 9-point Self-Assessment Manikin [SAM] scale [26]) and support for gun control policies. Support for gun control was assessed by asking whether firearm laws should be made stricter, rated on a 5-point Likert scale ranging from “Strongly disagree” to “Strongly agree”.
Participants were then randomly assigned to one of the three experimental conditions and were required to view the visualization for at least 15 seconds before proceeding. To ensure engagement, we included two factual questions based on the visualization’s content. After viewing the visualization, participants completed post-exposure measures of emotional valence and policy attitudes. This was followed by manipulation checks assessing perceived framing (episodic vs. thematic) and whether participants noticed the annotated event, as well as a verification question to confirm recognition of the topic. Finally, participants provided demographic information, including age, gender, education, and political ideology, and were debriefed.
3 Results↩︎
We excluded participants who incorrectly answered the topic verification question, as well as those that failed to answer both the factual questions. In total, 17 of the 800 participants were removed. There were 263, 259, and 261 participants in the T, T+Ann, and E+Ann conditions, respectively.
3.1 Manipulation Checks↩︎
Manipulation checks were included to ensure that the framing manipulations were interpreted by participants as intended:
Perceived framing. Participants perceived the framing hierarchy as intended, with episodic emphasis increasing from T to T+Ann to E+Ann (linear trend estimate = 1.89, t(780) = 11.50, p \(<\) .001).
Annotation noticed. Participants were substantially more likely to report noticing an annotation in annotation-present conditions (odds ratios \(>\) 400, ps \(<\)
.001), confirming that the annotation manipulation was highly salient.
Perceived policy direction. Although we expected no differences in perceived policy direction (pro-gun) across conditions, a significant effect was observed, F(2, 780) = 7.26, p \(<\) .001, with the
episodic condition perceived as more pro–gun control than the thematic condition.
Baseline equivalence. There were no significant differences in pre-exposure valence or gun-control support across conditions.
3.2 H1: Emotional Response (Valence Change)↩︎
To test H1, we fit a linear mixed-effects model predicting valence with Time (Pre vs.Post) as a within-subject factor and Condition (T, T+Ann, E+Ann) as a between-subject factor, with a random intercept for participant.
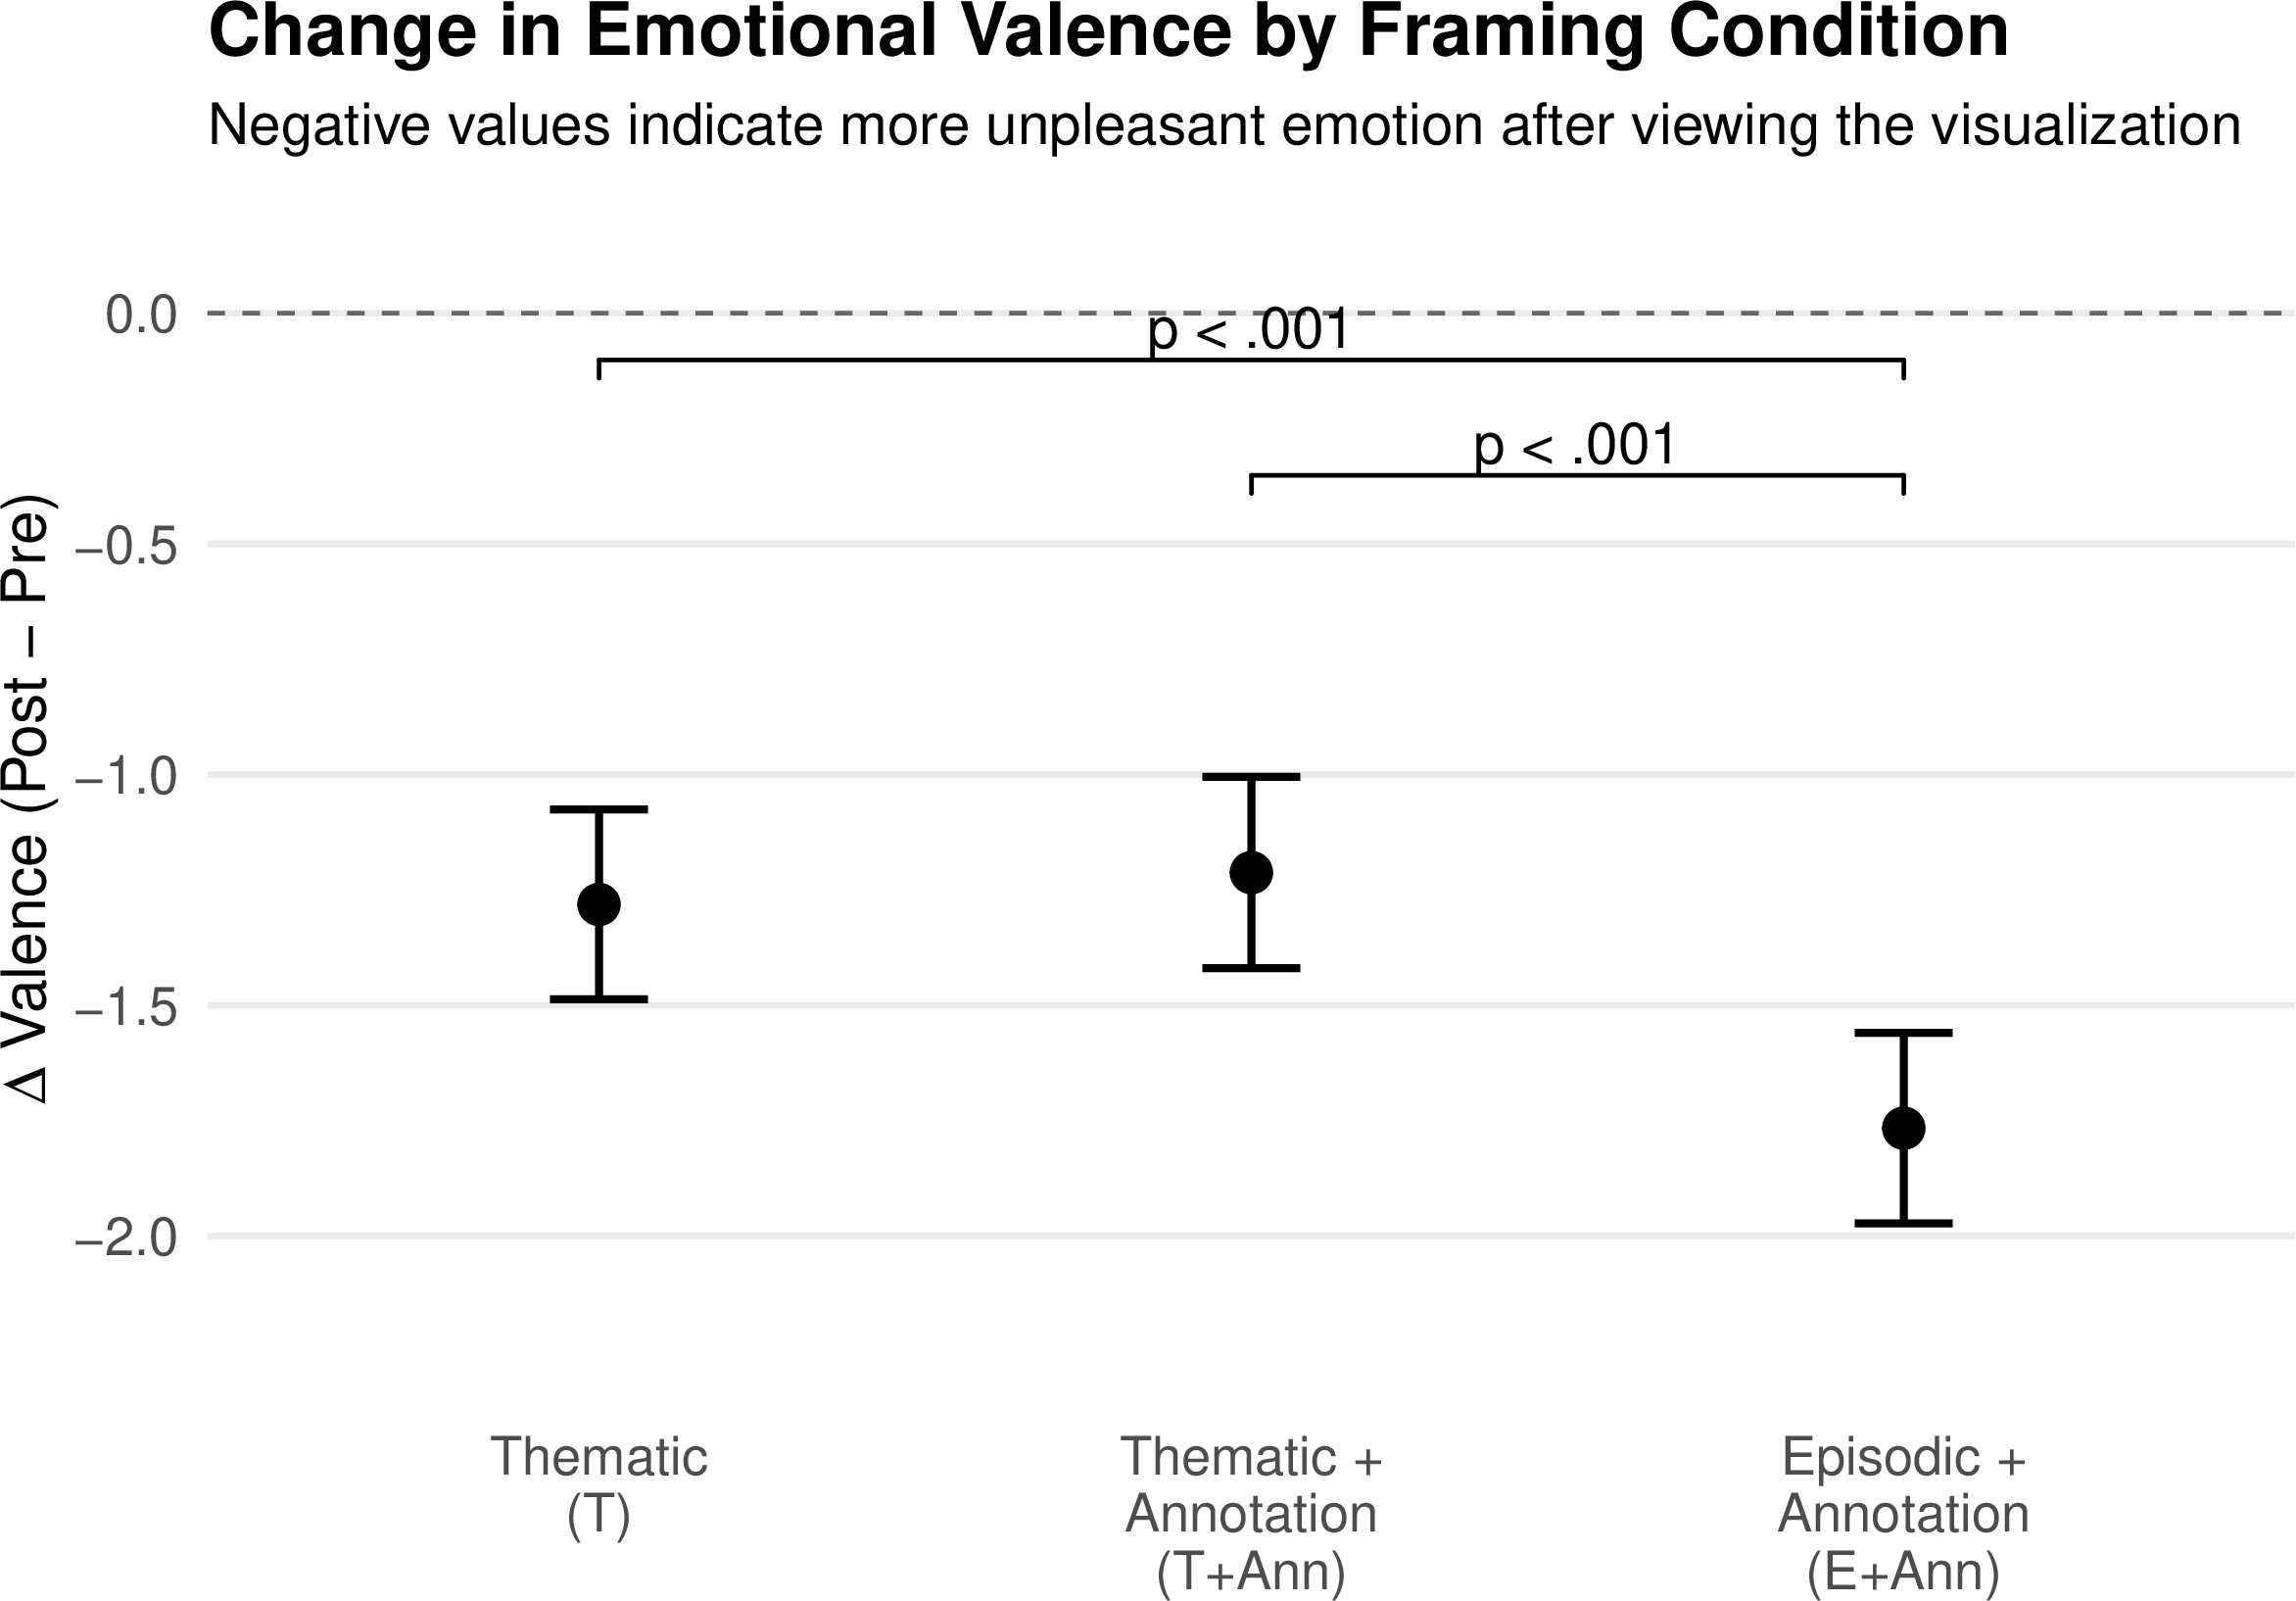
There was a significant main effect of Time, \(F(1, 780) = 546.52\), \(p < .001\), indicating that participants reported lower (more negative) valence after viewing the visualization. Crucially, the Time \(\times\) Condition interaction was also significant, \(F(2, 780) = 8.22\), \(p < .001\), indicating that the magnitude of emotional change differed across framing conditions (see Figure 1).
Within-condition contrasts showed that all conditions produced a significant decrease in valence (all \(p\)s \(< .001\)):
T: \(\Delta = -1.28\), 95% CI [\(-1.49\), \(-1.08\)]
T+Ann: \(\Delta = -1.21\), 95% CI [\(-1.42\), \(-1.01\)]
E+Ann: \(\Delta = -1.77\), 95% CI [\(-1.97\), \(-1.56\)]
Planned contrasts on change scores showed that E+Ann produced a significantly larger decrease in valence than both T and T+Ann (both \(p\)s \(< .001\)), while no difference was observed between T and T+Ann (\(p = .64\)).
These results indicate that episodic framing produced significantly stronger negative emotional responses than thematic framing, while adding an annotation to a thematic title had no measurable effect. Thus, H1 is partially supported.
3.3 H2: Attitude Change (Support for Gun Control)↩︎
To test H2, we fit an ANCOVA predicting post-exposure support with Condition as a factor and pre-support as a covariate, with ideology included as a control. There was no significant effect of Condition, \(F(2, 771) = 1.46\), \(p = .23\).
Adjusted means were nearly identical across conditions:
T: \(4.06\) [4.02, 4.11]
T+Ann: \(4.06\) [4.01, 4.10]
E+Ann: \(4.11\) [4.06, 4.15]
Planned contrasts were non-significant (all \(p\)s \(> .10\)). These results indicate that framing did not significantly influence policy attitudes after controlling for baseline support. Hence H2 is not supported.
3.4 H3: Mediation via Emotional Response↩︎
We tested whether emotional change mediated the relationship between framing and policy attitudes using a mediation model with bootstrapped standard errors (5,000 samples).
Episodic framing (E+Ann vs. T+Ann) significantly increased negative emotional change (\(a_2 = -0.34\), \(p < .001\)), and greater negative emotional change was associated with higher post-exposure support for gun control after controlling for baseline support and political ideology (\(b = -0.04\), \(p < .001\)). The indirect effect was significant (\(\mathrm{ind}_2 = 0.013\), \(p = .011\)), while the direct effect was not (\(p = .36\)).
In contrast, the annotation-only contrast (T+Ann vs.T) showed no significant effects on emotional change or mediation pathways. These results indicate that episodic framing influenced policy attitudes indirectly through increased negative emotion, despite the absence of a direct effect. Hence H3 is supported.
4 Discussion and Design Implications↩︎
4.1 Emotional Effects of Episodic Framing↩︎
The most robust finding of our study is that episodic framing produced significantly stronger negative emotional responses than thematic framing. Participants in the episodic condition (E+Ann) exhibited a substantially larger decrease in valence compared to both thematic conditions, while the addition of an annotation alone (T+Ann) did not alter emotional responses.
These findings are consistent with theories of episodic and thematic framing [16]. By foregrounding a specific event or individual, episodic framing may anchor attention to a concrete referent, intensifying emotional responses relative to trend-focused framing.
Finally, adding an event annotation to a thematic title did not significantly increase emotional responses, suggesting that simply labeling a specific event was insufficient to amplify emotion. One possible explanation is that the annotation may assume some familiarity with the event, whereas the episodic title explicitly states that 19 children lost their lives, communicating the emotional significance directly even to readers without prior knowledge. These findings are consistent with prior work suggesting that titles play an important role in establishing the interpretive frame of a visualization [1], [6], [7].
Design Implication 1. Use episodic framing to increase emotional engagement, but recognize its editorial tradeoffs. Episodic framing may make abstract, large-scale data more emotionally accessible by grounding it in a concrete human experience. However, media coverage of mass shootings disproportionately emphasizes a small number of highly salient events, shaping public understanding at the expense of less prominent cases [17]. Consequently, foregrounding an event such as Uvalde represents an editorial choice about which incidents become emotional anchors for interpreting the broader dataset.
4.2 Emotion Without Direct Persuasion↩︎
Despite strong emotional effects, we did not observe a direct effect of framing on policy attitudes. This result is consistent with prior work suggesting that deeply held attitudes—particularly on politically charged issues—are often resistant to change following a single visualization exposure [6], [12], [27], [28].
However, mediation analysis revealed a more nuanced pattern. Greater negative emotional change was associated with greater increases in support for gun control, suggesting that textual framing may influence attitudes indirectly by first shaping viewers’ emotional responses.
Design Implication 2. Emotional engagement alone may not be sufficient for immediate attitude change. Designers seeking to influence attitudes over time may need to more explicitly connect the emotional experience elicited by a visualization to its broader societal or policy implications.
4.3 Effects of Perceived Policy Direction↩︎
An interesting finding was that participants perceived the episodic condition as more pro–gun control, despite all conditions presenting the same data and a broadly pro–gun control framing.
Prior work has shown that textual elements in visualizations can strongly influence perceptions of author bias and the neutrality of the data [8]. Extending this work, our results suggest that emphasizing a specific event can also shift readers’ perceptions of the communicator’s policy stance, even when the underlying visualization and data remain unchanged.
Design Implication 3. Textual framing can shape perceived editorial stance independently of the data. Designers working in contexts where credibility and perceived neutrality are important should evaluate textual framing alongside visualization design. Choices about which events are foregrounded contribute to the rhetorical message of a visualization and may influence readers’ perceptions of advocacy and editorial intent.
5 Limitations and Future Work↩︎
This study focuses on a single domain—mass shootings in the United States—which is highly salient and emotionally charged. While appropriate for studying framing effects, future work should examine whether these findings generalize to other domains.
Our manipulation represents one operationalization of episodic and thematic framing. For example, an even more episodic title could identify a specific victim by name and personal details. Likewise, our visualization itself presents aggregate counts over time, reflecting a primarily thematic visual structure. More generally, visualization design can also shape episodic and thematic interpretations—for example, Periscopic’s U.S. Gun Deaths visualization [29] transitions from individual victims to an aggregate overview—while prior work has shown that design choices such as aggregation level influence reasoning about individual cases versus broader population-level patterns [30], [31]. Future work should investigate how textual and visual framing jointly shape viewers’ emotions and interpretations.
We also examine a specific form of annotation inspired by journalistic practice—event-based annotations highlighting a particular incident and its location (e.g., [23]). This represents only a small subset of the broader annotation design space, which includes textual, graphical, and hybrid forms varying in function, placement, and level of detail [19]. Future work should investigate how different annotation types interact with framing to shape emotional and cognitive responses.
Finally, political communication research identifies a much broader range of framing strategies [15]. Exploring how other types of frames operate in visualization contexts may provide a useful direction for future research.
6 Conclusion↩︎
This study demonstrates that textual framing in data visualizations shapes not only how people interpret data, but also how they feel about it. Episodic framing amplifies emotional responses, and these emotional shifts can indirectly influence attitudes even in the absence of direct persuasion. These results may seem unsurprising—foregrounding 19 children killed in Uvalde is inherently more affecting than presenting an aggregate death toll. But our results reveal tensions that visualization designers and data journalists must navigate: episodic framing appears to drive emotional engagement at the cost of perceived neutrality, with participants reading identical data as more advocacy-oriented when framed episodically. By anchoring emotional responses to a specific event, it also risks privileging certain narratives over others. The choice between episodic and thematic framing is not merely stylistic—it carries measurable consequences for how audiences feel, what they believe the communicator intends, and whose stories get told.
7 Preregistration and Supplementary Materials↩︎
The preregistration for the study can be found at https://osf.io/mcy7h/overview and the supplementary materials can be found at https://osf.io/fe9k6/.