The Limits of LLM Forecasting:
Parametric Knowledge Gaps Across Conflict Zones
May 29, 2026
Abstract
Media coverage of armed conflict is deeply asymmetric: we document a 224\(\times\) gap between the most and least covered conflict zones in English-language media across 22 countries (2020–2026). We evaluate zero-shot conflict escalation forecasting across all 22 countries on a 660-case held-out test set, comparing Llama-3.3-70B and GPT-4o against three structured baselines.
The central finding is not a performance gradient but a qualitative failure: LLMs do not forecast conflict—they categorize it. Llama predicts escalation on every under-covered case, matching the trivial Always-YES baseline to three decimals; GPT-4o predicts NO on every over-covered case, missing all five actual escalation events. A logistic regression using only eleven observation-window features with no country information achieves F1 = 0.402, outperforming both LLMs in every measurable tier. This failure cannot be resolved at inference time: adding structured ACLED evidence degrades performance on under-covered zones (GPT-4o F1: 0.323 \(\to\) 0.168) and falls below LR by a factor of 2.4. The bottleneck is not data availability but the LLM’s interpretation of temporal signal under a country-categorical prior.
Under-covered populations receive not just less accurate AI, but qualitatively different AI that cannot distinguish stable from escalating periods. We call for coverage-stratified benchmarking, conflict NLP datasets for under-covered zones, and training data documentation standards for geographic conflict representation.
1 Introduction↩︎
AI systems for humanitarian decision support increasingly rely on LLMs for conflict early warning, displacement forecasting, and resource allocation [1]–[3]. Yet these systems inherit world knowledge from training corpora shaped by highly uneven English-language media coverage. This paper asks whether media attention asymmetries translate into asymmetries in how LLMs reason about conflict, and what this means for humanitarian AI.
Western media bias in conflict and disaster coverage is well documented. Prior work shows that proximity, cultural consonance, elite-nation involvement, and framing shape which crises become salient [4], [5]. Quantitative studies further show that news attention affects real-world aid allocation: [6] found that African disasters require far more casualties than comparable Eastern European disasters to receive similar US television coverage. Recent computational work confirms persistent under-coverage of conflicts in Sub-Saharan Africa and Southeast Asia relative to Europe and the Middle East, even after accounting for conflict intensity [7]. What remains unknown is whether such asymmetries propagate into LLM-based conflict reasoning.
This question matters because LLMs are increasingly considered as reasoning engines for forecasting, while prior conflict prediction work has mostly relied on structured datasets and hand-engineered features [8], [9]. At the same time, NLP research shows that models inherit biases from web-scale corpora [10]–[12], including geographic bias in prediction tasks [13], multilingual instability [14], [15], and downstream failures in humanitarian contexts [16]. However, geographic conflict coverage asymmetry has not been studied as a source of qualitative reasoning failure.
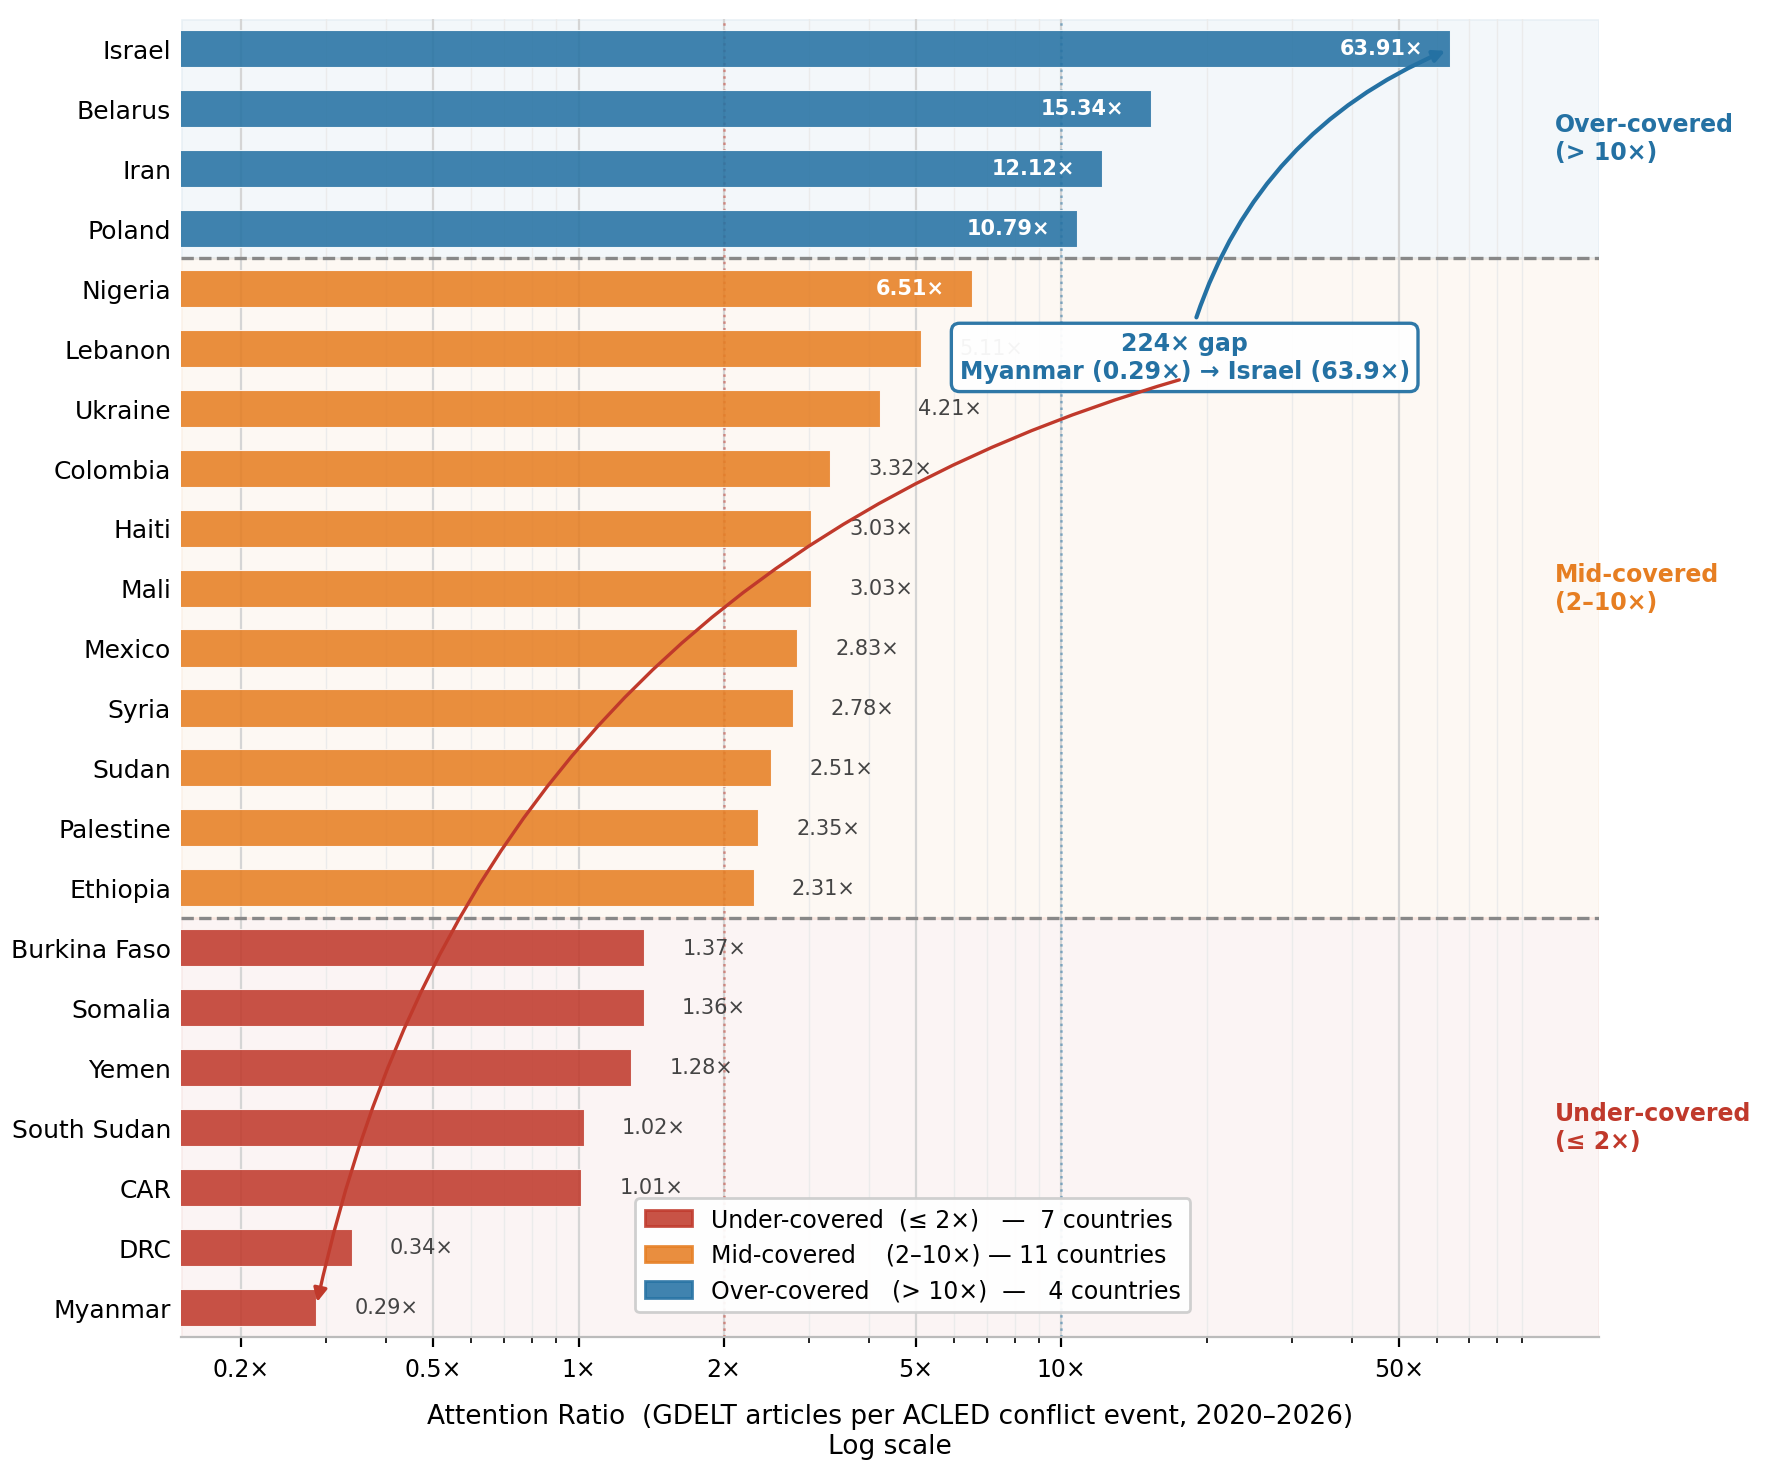
We make five contributions. First, using ACLED event data [17] and GDELT media coverage [18] from 2020–2026, we document a 224\(\times\) English-language media attention gap across 22 active conflict zones, from Myanmar at 0.29 articles per event to Israel at 63.9.
Second, we show that this asymmetry produces not merely unequal accuracy, but different reasoning modes. On a 660-case held-out test set, Llama predicts escalation for all 210 under-covered cases, matching an Always-YES baseline, while GPT-4o predicts no escalation for all 120 over-covered cases, missing every true escalation event. The models do not forecast conflict dynamics; they categorize conflict contexts.
Third, we show that the task is forecastable from temporal signal alone: a logistic regression using only eleven observation-window features and no country information achieves F1 = 0.402, outperforming both LLMs in their parametric condition. This indicates that LLM failure stems from country-level categorical priors overriding available temporal evidence.
Fourth, structured evidence at inference time does not fix the problem. Adding ACLED event counts degrades LLM performance on under-covered zones, with GPT-4o-evidence falling to F1 = 0.168, far below logistic regression. The bottleneck is therefore not data availability, but how LLMs interpret temporal evidence under geographic priors.
Fifth, we argue that this is a first-class fairness problem: under-covered populations receive not only less accurate AI, but qualitatively different AI that cannot distinguish stable from escalating periods within their conflicts. We call for coverage-stratified benchmarking, stronger conflict NLP datasets for under-covered regions, and training-data documentation standards for geographic conflict representation.
2 Measuring the Gap↩︎
2.1 Data Sources↩︎
We operationalize media attention using two independent data sources that together provide ground-truth conflict intensity and media coverage volume across 22 active conflict zones from January 2020 through February 2026.
Conflict ground truth: ACLED. The Armed Conflict Location and Event Dataset [17] provides event-level records of political violence and protest events, coded from news reports, NGO communications, and government sources. We use ACLED as our measure of actual conflict intensity, aggregating monthly event counts per country. ACLED’s systematic global coverage and real-time coding make it the standard ground truth for conflict research [19]. Crucially, ACLED itself is subject to reporting bias — events in countries with less media access are systematically under-coded [17] — meaning our attention gap estimates are conservative: the true asymmetry between conflict intensity and media coverage is likely larger than we measure.
Media coverage: GDELT. The Global Database of Events, Language and Tone [18] indexes English-language news articles from thousands of outlets worldwide, coding events using the CAMEO conflict taxonomy. We query the GDELT BigQuery dataset for conflict-relevant CAMEO event codes (codes 14–20, 173, 180–196, 200–203) and aggregate monthly counts of distinct source URLs per country. URL-level deduplication is essential: each news event in GDELT generates multiple rows (one per actor pair, one per event code), so raw row counts massively overcount article volume. We use distinct URLs as the closest available proxy for distinct articles. We note that GDELT’s coverage is substantially English-language biased, systematically under-indexing local-language reporting on conflicts in Sub-Saharan Africa and Southeast Asia. This is not a limitation we correct for — it is precisely the bias we seek to measure, since English-language web text constitutes a substantial portion of LLM pretraining corpora [11].
Country selection. We select 22 countries spanning five regions: Sub-Saharan Africa (Sudan, Ethiopia, Somalia, DRC, South Sudan, Nigeria, Mali, Burkina Faso, Central African Republic), Southeast Asia (Myanmar), Eastern Europe (Ukraine, Belarus, Poland), Middle East and North Africa (Israel, Palestine, Lebanon, Iran, Yemen, Syria), and Latin America (Colombia, Haiti, Mexico). Countries were selected to provide structural diversity across conflict types — interstate war, post-coup civil conflict, protracted insurgency, multi-actor fragmented conflict, and political crisis — while ensuring sufficient ACLED event density for meaningful monthly statistics. Countries with near-zero ACLED event counts (Belarus, Poland) are retained as implicit controls for the model behavior analysis in Section 4.
2.2 The Attention Ratio↩︎
We define the media attention ratio for country \(c\) as:
\[\text{AttentionRatio}(c) = \frac{\overline{A}_{\text{GDELT}}(c)}{\overline{E}_{\text{ACLED}}(c)}\]
where both quantities are averaged over the 74-month study period. This ratio captures media attention per unit of conflict activity: a high ratio indicates that each conflict event generates many articles (over-covered); a low ratio indicates that conflict events generate few articles (under-covered).
2.3 Results: A 224\(\times\) Attention Gap↩︎
Figure 1 reports the attention ratio for all 22 countries, sorted from least to most covered. The gap between the most and least covered active conflict zones spans 224\(\times\): Myanmar receives 0.29 articles per conflict event while Belarus receives 15.34\(\times\) and Israel 63.9\(\times\). Restricting to countries with substantial active conflict (ACLED events \(>\) 1,000 over the study period) narrows the comparison but preserves the essential finding: Myanmar (0.29\(\times\)) and South Sudan (1.02\(\times\)) receive approximately 15–220\(\times\) less media attention per conflict event than Ukraine (4.21\(\times\)), Lebanon (6.51\(\times\)), or Iran (12.12\(\times\)).
Three structural patterns are visible. First, the seven most under-covered active conflict zones are without exception located in Sub-Saharan Africa or Southeast Asia: Myanmar, DRC, South Sudan, CAR, Yemen, Somalia, and Burkina Faso. Second, the most over-covered zones — Israel, Belarus, Iran, Poland — share a common feature: their media coverage reflects geopolitical salience rather than conflict intensity. Poland’s coverage reflects spillover from the Ukraine refugee crisis rather than domestic armed conflict. Third, Ukraine’s ratio (4.21\(\times\)) falls in the mid-covered tier despite being the largest absolute recipient of media attention in our dataset (1.1 million articles), because its ACLED event count is also the largest (266,664 events). High absolute coverage does not necessarily imply high relative coverage.
2.4 Methodological Notes↩︎
Two limitations deserve explicit acknowledgment. First, GDELT indexes primarily English-language sources. Local-language reporting on conflicts in Bambara, Hausa, Tigrinya, or Burmese is substantially absent, meaning our attention ratios understate the true coverage available to locally-informed observers. Since LLM pretraining corpora also predominantly reflect English-language sources [11], this shared bias is precisely what we seek to characterize rather than correct. Second, the attention ratio captures volume but not quality of coverage: a country may receive many articles but superficial treatment, or few articles but detailed analysis. We treat volume as a proxy for training signal density, acknowledging that this is an approximation. Future work employing document-level analysis of coverage depth could refine this measure.
3 Experimental Setup↩︎
We evaluate zero-shot conflict escalation forecasting across all 22 countries using two LLM backbones: Llama-3.3-70B [20] served via the Groq inference API, and GPT-4o [21]. The zero-shot parametric design is deliberate: we provide only the country name and prediction period, with no evidence bundle, no few-shot examples, and no contextual data. Any performance difference across coverage tiers must therefore reflect parametric knowledge — what each model learned during pretraining — rather than evidence quality or prompting strategy.
The zero-shot design follows the evaluation paradigm established in [22]: by withholding in-context examples, we isolate what the model has internalized during pretraining from what it can infer from prompt context. This is the appropriate design for our research question, which concerns parametric knowledge rather than in-context reasoning.
The task is binary escalation forecasting: given a country and a 30-day prediction window, predict whether armed conflict fatalities will exceed 130% of the recent baseline. Ground truth is derived from ACLED as described in Section 2. We evaluate across the full 1,628-case dataset (74 cases per country, 2020–2026), using temperature \(T=0\) for deterministic output and a single run per model.
We compare against two baselines. The majority-class baseline predicts the most frequent label per country; because all 22 countries have escalation rates below 0.5, this always predicts NO, yielding F1 = 0.000 everywhere and providing no discriminative signal. The Always-YES baseline predicts escalation on every case, maximizing recall at the cost of precision. Because the majority-class baseline is trivially uninformative, Always-YES serves as the operative comparison: it represents the simplest possible strategy for catching escalation events in chronically conflicted zones, and any claimed improvement should be measured against it.
To test whether structured evidence can close the performance gap on under-covered zones, we run a second condition (evidence-augmented) in which each prompt includes the three-month ACLED event count trend preceding the prediction window. This ablation directly addresses the hypothesis that the parametric condition’s failures stem from insufficient information rather than miscalibrated priors. We report evidence-augmented results for both models in Section 5.
4 LLM Behavior Under Attention Asymmetry↩︎
4.1 Establishing the Signal: Structured Baselines↩︎
Before evaluating LLM behavior, we establish that the task contains exploitable temporal signal. If simple structured models using only observation-window features can outperform trivial baselines, then any LLM failure on the same task cannot be attributed to task difficulty — it must reflect a failure to use information that is empirically present in the data.
We evaluate three structured baselines on a per-country chronological train/test split of the 1,628-case dataset: the earliest 60% of months per country are used for training (968 cases, 178 positives) and the most recent 40% are held out for evaluation (660 cases, 132 positives; per-tier positives are 53 under-covered, 74 mid-covered, and 5 over-covered). All conditions in this paper — structured and LLM alike — are evaluated on the same 660-case held-out test set, so all F1 comparisons are case-aligned.
Always-YES predicts escalation on every case. Persistence predicts escalation if the observation window’s recency ratio exceeds 1.3 — that is, if fatalities in the last 14 days of the observation window were more than 1.3\(\times\) the fatalities of the prior 14 days. This is the same 1.3\(\times\) threshold used to define the label, applied as an "is violence already accelerating" rule using only past data. Logistic regression (LR) uses eleven pre-computed observation-window features: eight numeric aggregates (total fatalities, event count, maximum event fatalities, average daily fatalities, fatalities per event, volatility, 14-day recency ratio, and 2-week baseline) plus a one-hot encoding of the trend category (stable, increasing, decreasing). The LR receives no country identity information of any kind: no country name, no country fixed effects, no coverage tier feature. Its predictions are functions only of the observation window’s internal temporal structure. Hyperparameters are class-balanced L2-regularized logistic regression with \(C=1.0\), standard-scaled features.
Table 1 reports tier-stratified F1. Logistic regression using only observation-window features, with no country information, outperforms Always-YES overall (F1 = 0.402 vs.) and in two of three tiers, with the only exception being a 0.003-point gap on under-covered (LR = 0.400 vs. Always-YES = 0.403) where both achieve similar F1 through very different precision-recall profiles. The LR’s Spearman correlation between attention ratio and F1 is \(\rho = -0.019\) (\(p = 0.94\)), essentially zero — confirming that country-blind temporal features yield country-invariant performance.
| Condition | Under | Mid | Over |
|---|---|---|---|
| Always-YES | 0.403 | 0.366 | 0.080 |
| Persistence | 0.362 | 0.273 | 0.231 |
| LR (no country) | 0.400 | 0.408 | 0.370 |
These results reframe the evaluation question for the LLM conditions. The signal is exploitable. The signal does not require country identity. The question becomes not whether LLMs can forecast under uncertainty, but whether they can extract from country names and parametric knowledge the same information that eleven feature values encode directly.
4.2 Results: Two Models, Two Failure Modes↩︎
Table 2 reports per-tier performance for both LLMs alongside the three structured baselines, all evaluated on the same 660-case held-out test set. The headline finding is not a gradient of forecasting skill correlated with attention ratio — it is a qualitative divergence in how each model handles uncertainty about unfamiliar conflict zones, relative to baselines that exploit temporal signal without country identity.
| Condition | Tier | F1 | P | R | N+ |
|---|---|---|---|---|---|
| Always-YES | Under | 0.403 | 0.252 | 1.000 | 53 |
| Mid | 0.366 | 0.224 | 1.000 | 74 | |
| Over | 0.080 | 0.042 | 1.000 | 5 | |
| Persistence | Under | 0.362 | 0.333 | 0.396 | 53 |
| Mid | 0.273 | 0.292 | 0.257 | 74 | |
| Over | 0.231 | 0.143 | 0.600 | 5 | |
| LR (no country info) | Under | 0.400 | 0.291 | 0.641 | 53 |
| Mid | 0.408 | 0.333 | 0.527 | 74 | |
| Over | 0.370 | 0.227 | 1.000 | 5 | |
| Llama-3.3-70B (parametric) | Under | 0.403 | 0.252 | 1.000 | 53 |
| Mid | 0.386 | 0.261 | 0.743 | 74 | |
| Over | 0.100 | 0.057 | 0.400 | 5 | |
| GPT-4o (parametric) | Under | 0.323 | 0.221 | 0.604 | 53 |
| Mid | 0.356 | 0.281 | 0.486 | 74 | |
| Over | 0.000 | 0.000 | 0.000 | 5 |
Finding 1: Llama under-covered behavior is exactly Always-YES. Llama achieves under-covered F1 = 0.403, precision = 0.252, recall = 1.000 — values that are identical to the Always-YES baseline to three decimal places. On 210 under-covered cases spanning seven countries (Burkina Faso, Central African Republic, DRC, Myanmar, Somalia, South Sudan, Yemen) and six years of monthly observations, Llama predicts escalation on every single case. A frontier 70-billion parameter model trained on a substantial portion of the public web reduces, on the world’s most neglected conflict zones, to the trivial predictor that says "yes" to everything. This is the cleanest possible empirical instantiation of categorization-rather-than-forecasting.
Finding 2: GPT-4o predicts NO on every over-covered case. GPT-4o achieves over-covered F1 = 0.000, recall = 0.000. Across 120 cases in Belarus, Iran, Israel, and Poland, GPT-4o does not predict escalation once — missing all five actual escalation events, including the October 2023 escalation in Israel. This is the mirror image of Llama’s failure on under-covered zones: where Llama applies a universal YES prior, GPT-4o applies a universal NO prior. More capable parametric knowledge produces more confident miscategorization, not better discrimination.
Finding 3: Structured models outperform LLMs on every tier where positives exist. LR with eleven observation-window features and no country information achieves F1 = 0.402 overall — exceeding both Llama (0.374) and GPT-4o (0.333). The contrast is sharpest on over-covered zones, where LR achieves F1 = 0.370 with recall = 1.000 — catching all 5 escalation events that GPT-4o misses entirely. On mid-covered zones LR also exceeds both LLMs (0.408 vs.Llama 0.386 vs.GPT-4o 0.356). On under-covered zones, LR (0.400), Llama (0.403), and Always-YES (0.403) are essentially tied in F1 — but the precision-recall profiles differ sharply: LR achieves P = 0.291, R = 0.641, the only condition with balanced discrimination, while Llama and Always-YES both achieve their F1 through degenerate recall = 1.000 predictions.
Finding 4: The task is not intractable; LLMs fail to use signal that eleven features encode. LR has less information than either LLM: no country name, no world knowledge of conflict actors, no political context. It receives only eleven numeric and categorical aggregates over a 30-day observation window. Yet it produces a deployable forecast: balanced precision and recall, country-invariant performance (Spearman \(\rho = -0.019\)), and the only F1 above 0.10 on over-covered zones. The LLMs, despite having every piece of information LR has plus full parametric knowledge of conflict history, fail to extract from country names what eleven observation-window numbers encode directly.
5 Ablation: Does Evidence Help?↩︎
The parametric results in Section 4 leave open a natural objection: perhaps LLM failure on under-covered zones reflects not a fundamental knowledge deficit but simply an absence of real-time signal. If so, providing structured conflict evidence at inference time should close the gap. We test this directly by augmenting each prompt with the three-month ACLED event count trend preceding the observation window, and re-evaluating both LLMs on the same 660-case held-out test set.
5.1 Results↩︎
Table 3 reports the full seven-condition comparison: three structured baselines (Always-YES, Persistence, LR), both LLMs in the parametric condition, and both LLMs in the evidence-augmented condition. Three findings stand out.
| Condition | Tier | F1 | P | R | N+ |
|---|---|---|---|---|---|
| Always-YES | Under | 0.403 | 0.252 | 1.000 | 53 |
| Mid | 0.366 | 0.224 | 1.000 | 74 | |
| Over | 0.080 | 0.042 | 1.000 | 5 | |
| Persistence | Under | 0.362 | 0.333 | 0.396 | 53 |
| Mid | 0.273 | 0.292 | 0.257 | 74 | |
| Over | 0.231 | 0.143 | 0.600 | 5 | |
| LR (no country info) | Under | 0.400 | 0.291 | 0.641 | 53 |
| Mid | 0.408 | 0.333 | 0.527 | 74 | |
| Over | 0.370 | 0.227 | 1.000 | 5 | |
| Llama-3.3-70B (parametric) | Under | 0.403 | 0.252 | 1.000 | 53 |
| Mid | 0.386 | 0.261 | 0.743 | 74 | |
| Over | 0.100 | 0.057 | 0.400 | 5 | |
| GPT-4o (parametric) | Under | 0.323 | 0.221 | 0.604 | 53 |
| Mid | 0.356 | 0.281 | 0.486 | 74 | |
| Over | 0.000 | 0.000 | 0.000 | 5 | |
| Llama-3.3-70B (evidence) | Under | 0.342 | 0.300 | 0.396 | 53 |
| Mid | 0.212 | 0.188 | 0.243 | 74 | |
| Over | 0.150 | 0.086 | 0.600 | 5 | |
| GPT-4o (evidence) | Under | 0.167 | 0.186 | 0.151 | 53 |
| Mid | 0.165 | 0.155 | 0.176 | 74 | |
| Over | 0.188 | 0.111 | 0.600 | 5 |
Finding 1: Adding evidence degrades LLM performance everywhere except on the over-covered tier. Reading down each LLM’s column from parametric to evidence: Llama under-covered F1 falls from 0.403 to 0.342; Llama mid-covered F1 falls from 0.386 to 0.212; GPT-4o under-covered F1 falls from 0.323 to 0.167; GPT-4o mid-covered F1 falls from 0.356 to 0.165. Overall, Llama drops from F1 = 0.374 to 0.252 and GPT-4o drops from 0.333 to 0.168. The only places evidence helps are tiers where the parametric prior had collapsed entirely: GPT-4o over-covered moves from F1 = 0.000 to 0.188 (recall from 0.000 to 0.600), and Llama over-covered moves from 0.100 to 0.150. Evidence helps precisely where the model had nothing to begin with, and hurts everywhere else.
Finding 2: Evidence augmentation falls below both Always-YES and structured baselines on under-covered zones. On the populations the paper is centrally about, both evidence conditions are dominated by the trivial Always-YES predictor (F1 = 0.403) and by LR (F1 = 0.400): Llama-evidence achieves F1 = 0.342, GPT-4o-evidence F1 = 0.167. A humanitarian practitioner who replaced the trivial baseline with either evidence-augmented model would catch fewer escalation events in the world’s most neglected conflict zones. The mechanism is interpretable. When presented with event counts, both LLMs attempt to reason about whether the observed trend constitutes meaningful escalation — but they lack country-specific calibration to do so. A three-month count of 200 ACLED events means something very different in Myanmar (chronically high-intensity) than in South Sudan (episodic). The parametric prior — blanket YES for conflict zones, in Llama’s case — is disrupted by the new input, but the LLM does not develop a calibrated trend interpretation to replace it.
Finding 3: The same data, processed by logistic regression, beats every LLM evidence condition by a factor of two. The clearest diagnostic in the table is the direct comparison between LR (F1 = 0.402 overall) and GPT-4o-evidence (F1 = 0.168 overall). Both have access to ACLED-derived numerical features over a recent window preceding the prediction period. LR receives eleven features as a scaled vector and produces a balanced precision-recall forecast across all three tiers, including F1 = 0.370 with recall = 1.000 on over-covered zones. GPT-4o-evidence receives three event counts as text, plus full parametric world knowledge of every country in the dataset, and produces F1 below 0.20 in every tier. The information bottleneck is not the data; it is the LLM’s interpretation of it.
This asymmetry confirms that the failure on under-covered zones is a parametric-knowledge problem rather than a prompting problem. Evidence augmentation is not a viable fix at inference time: it improves performance only where parametric knowledge had completely failed (the over-covered tier, where GPT-4o predicts NO on every case in the parametric condition), and worsens it across the populations where the humanitarian stakes are highest.
5.2 Implications for System Design↩︎
These results carry a direct implication for practitioners building LLM-assisted humanitarian early warning systems. The standard design assumption — that richer prompts produce better forecasts — does not hold across coverage tiers, and inverts on the populations that matter most. On under-covered zones, the parametric Llama model with no evidence (F1 = 0.403) outperforms both evidence-augmented LLMs and matches the trivial Always-YES baseline; on mid-covered zones, the parametric models outperform their own evidence-augmented variants; only on over-covered zones — where the parametric prior had already collapsed to recall = 0.000 for GPT-4o — does adding evidence help.
The appropriate benchmark for any proposed LLM-based early warning system is not Always-YES on well-covered zones; it is a logistic regression on observation-window features in the geographies where the system is most likely to be deployed. None of the four LLM conditions tested here clear that bar on under-covered or mid-covered tiers, and the evidence-augmented conditions do not clear it on any tier. The implication is not that LLMs cannot be useful for humanitarian forecasting — it is that current LLM deployment patterns assume an ability to extract structured temporal signal from natural-language prompts that frontier models do not yet exhibit on the geographic contexts where humanitarian deployment is most consequential.
6 Recommendations↩︎
Our findings motivate three concrete recommendations, framed as actionable research directions with clear precedent.
6.1 Coverage-Stratified Benchmarking↩︎
Conflict NLP evaluations should report performance stratified by media attention ratio alongside aggregate metrics. A system that performs well on Ukraine and Palestine while failing on DRC and Myanmar is not a general-purpose conflict AI system — it is calibrated to well-covered conflicts. We propose a simple standard: report F1 separately for under-covered (\(\leq\)2\(\times\)), mid-covered (2–10\(\times\)), and over-covered (\(>\)10\(\times\)) tiers using the attention ratios we provide. This requires no additional data collection — only a change in reporting practice, analogous to the per-language evaluation norms that exposed systematic disparities in multilingual NLP [14].
6.2 Dataset Creation for Under-Covered Conflict Zones↩︎
The training signal deficit for DRC, Myanmar, South Sudan, and similar contexts cannot be addressed by better architectures or prompting alone — our evidence condition results confirm this directly. We call on the NLP community to treat annotated conflict datasets for under-covered zones as priority infrastructure: creating NLP-ready resources from ACLED and UCDP [23] for under-covered regions, supporting annotation projects involving local researchers, and funding shared tasks targeting these contexts — the same deliberate investment that drove progress in low-resource MT [14]. The data infrastructure exists. What is missing is the community’s attention to it.
6.3 Training Data Documentation↩︎
LLM developers should document geographic conflict coverage statistics — specifically, what fraction of training data discusses each conflict zone and how this correlates with task performance. This instantiates the agenda of [12] and [11] in a domain where underdocumented bias has measurable humanitarian consequences. GPT-4o’s recall of 0.143 on Somalia is not discoverable from any model card; it requires empirical evaluation most humanitarian organizations cannot conduct. We do not claim developers must equalize coverage — only that asymmetry, where it exists, should be documented so deployers can make informed decisions.
7 Conclusion↩︎
LLMs do not forecast conflict — they categorize it. A logistic regression with eleven observation-window features and no country information achieves F1 = 0.402, outperforming both LLMs in every condition. On 210 under-covered cases, Llama matches the trivial Always-YES baseline to three decimals; on 120 over-covered cases, GPT-4o misses every escalation event. Adding structured evidence worsens this: the same ACLED data processed by logistic regression beats GPT-4o-evidence by a factor of 2.4. The bottleneck is not data availability but the LLM’s interpretation of temporal signal under a country-categorical prior.
The communities most affected by conflict and least covered by media receive AI that cannot distinguish a stable month from an escalating one — not because the signal is absent, but because LLMs do not use it. Closing this gap requires coverage-stratified benchmarks, training datasets for under-covered zones, and documentation standards that tell deployers where a model can and cannot be trusted.
Limitations↩︎
We identify eight limitations of the present study.
GDELT as an attention proxy. GDELT indexes primarily English-language outlets, underrepresenting local-language reporting. A conflict zone with rich Arabic, French, or Swahili coverage will appear under-covered in our measure even if it is not under-covered globally. Our attention ratios are therefore conservative estimates: the true asymmetry in LLM training data is likely larger than we report. Additionally, GDELT aggregates across all news types, not conflict-specific reporting, meaning politically salient countries receive inflated ratios relative to their actual conflict coverage.
ACLED coverage and conflict definition. ACLED’s coverage is not uniform — under-covered countries may have thinner event records because ACLED’s own documentation infrastructure is less developed there, not because conflict is less frequent. Our escalation threshold (130% of a 2-week rolling fatality baseline) is operationally motivated but arbitrary; absolute F1 values are threshold-dependent even if the qualitative tier-level pattern is not.
Two LLMs may not generalize. We evaluate two frontier model families. The categorical reasoning pattern we document may not hold for smaller models, models with more recent training cutoffs, models trained on conflict-specific corpora, or reasoning-augmented variants (o1/o3, Claude with extended thinking). Our claim is that the pattern exists in two widely-deployed systems that are plausible candidates for humanitarian AI deployment; extending the evaluation across model families and reasoning architectures is important future work.
Evidence representation. Our evidence-augmented condition provides three monthly ACLED event counts as text, reflecting realistic real-time data availability (fatality counts often lag by days or weeks while event counts are produced first). The logistic regression baseline uses a richer feature set including both event counts and fatality aggregates, and beats every LLM condition by a factor of two. We cannot rule out that LLMs given fatality-augmented or differently-structured evidence would perform better; we leave richer evidence representations as future work. We note, however, that the structured-baseline contrast already establishes that the failure is not about the kind of evidence available — it is about the language model’s capacity to extract a forecasting signal from a numerical text input that a non-language model extracts from features.
Evidence timing. Our evidence covers the three months preceding the observation window, matching the temporal stance of a real-time forecaster who works with finalized monthly aggregates. A reviewer might ask whether LLMs would do better with observation-window event counts directly; we leave this comparison to future work, while noting that the logistic regression baseline has access to observation-window features and still beats LLM-evidence by a wide margin.
Zero-shot evaluation only. Few-shot prompting with conflict-specific examples or retrieval-augmented generation may improve performance on under-covered zones. We regard this as an open question: the evidence-condition results suggest that adding structured data does not fix the calibration problem, but more sophisticated inference-time strategies remain untested.
Training cutoff confounds. Our dataset spans 2020–2026 and both models have training cutoffs within this window. We do not stratify by pre- and post-cutoff periods. However, the stable YES or NO priors we observe across the full 74-month window — and the empirical identity between Llama’s under-covered behavior and the trivial Always-YES baseline (F1, precision, and recall all matching to three decimals) — are inconsistent with a model making genuine use of temporal information; this pattern is most parsimoniously explained by parametric-knowledge structure rather than by event memorization for specific time periods.
Causal interpretation. We document a correlation between media attention ratio and LLM behavior and interpret it as a training data exposure effect. We cannot establish this causally — we have no access to either model’s training data distribution. The alternative explanation (that under-covered countries are harder to forecast due to ACLED sparsity rather than LLM pretraining gaps) is argued against by the structured-baseline results: a logistic regression using the same ACLED data — with no country information — achieves F1 = 0.402 overall, including F1 = 0.400 on under-covered zones. If ACLED sparsity were the cause of LLM failure, LR would fail at the same rate. It does not.
Potential Risks. This work could be misread as discouraging LLM use in humanitarian contexts entirely. Our findings are specific to zero-shot parametric forecasting; we do not evaluate fine-tuned, few-shot, or retrieval-augmented systems. Practitioners should not generalize our negative results beyond the conditions tested.
8 Per-Country Results↩︎
max width=,center
| Llama-3.3-70B | GPT-4o | ||||||||
|---|---|---|---|---|---|---|---|---|---|
| 5-7 (lr)8-10 Tier | Country | N | N+ | F1 | P | R | F1 | P | R |
| Under | Burkina Faso | 30 | 10 | .500 | .333 | 1.000 | .500 | .333 | 1.000 |
| Under | CAR | 30 | 9 | .462 | .300 | 1.000 | .286 | .250 | .333 |
| Under | DRC | 30 | 7 | .378 | .233 | 1.000 | .333 | .207 | .857 |
| Under | Myanmar | 30 | 3 | .182 | .100 | 1.000 | .182 | .100 | 1.000 |
| Under | Somalia | 30 | 7 | .378 | .233 | 1.000 | .125 | .111 | .143 |
| Under | South Sudan | 30 | 9 | .462 | .300 | 1.000 | .364 | .250 | .667 |
| Under | Yemen | 30 | 8 | .421 | .267 | 1.000 | .316 | .273 | .375 |
| 1-10 Under (tier) | 210 | 53 | .403 | .252 | 1.000 | .323 | .221 | .604 | |
| Mid | Colombia | 30 | 6 | .000 | .000 | .000 | .000 | .000 | .000 |
| Mid | Ethiopia | 30 | 11 | .486 | .346 | .818 | .000 | .000 | .000 |
| Mid | Haiti | 30 | 12 | .571 | .400 | 1.000 | .571 | .400 | 1.000 |
| Mid | Lebanon | 30 | 8 | .000 | .000 | .000 | .000 | .000 | .000 |
| Mid | Mali | 30 | 9 | .462 | .300 | 1.000 | .462 | .300 | 1.000 |
| Mid | Mexico | 30 | 0 | .000 | .000 | .000 | .000 | .000 | .000 |
| Mid | Nigeria | 30 | 7 | .389 | .241 | 1.000 | .545 | .750 | .429 |
| Mid | Palestine | 30 | 7 | .378 | .233 | 1.000 | .296 | .200 | .571 |
| Mid | Sudan | 30 | 6 | .333 | .200 | 1.000 | .333 | .200 | 1.000 |
| Mid | Syria | 30 | 5 | .364 | .333 | .400 | .000 | .000 | .000 |
| Mid | Ukraine | 30 | 3 | .182 | .100 | 1.000 | .235 | .143 | .667 |
| 1-10 Mid (tier) | 330 | 74 | .386 | .261 | .743 | .356 | .281 | .486 | |
| Over | Belarus | 30 | 0 | .000 | .000 | .000 | .000 | .000 | .000 |
| Over | Iran | 30 | 4 | .222 | .200 | .250 | .000 | .000 | .000 |
| Over | Israel | 30 | 1 | .065 | .033 | 1.000 | .000 | .000 | .000 |
| Over | Poland | 30 | 0 | .000 | .000 | .000 | .000 | .000 | .000 |
| 1-10 Over (tier) | 120 | 5 | .100 | .057 | .400 | .000 | .000 | .000 | |
max width=,center
| Llama-3.3-70B | GPT-4o | ||||||||
|---|---|---|---|---|---|---|---|---|---|
| 5-7 (lr)8-10 Tier | Country | N | N+ | F1 | P | R | F1 | P | R |
| Under | Burkina Faso | 30 | 10 | .583 | .500 | .700 | .250 | .333 | .200 |
| Under | CAR | 30 | 9 | .571 | .500 | .667 | .133 | .167 | .111 |
| Under | DRC | 30 | 7 | .000 | .000 | .000 | .000 | .000 | .000 |
| Under | Myanmar | 30 | 3 | .500 | .333 | 1.000 | .750 | .600 | 1.000 |
| Under | Somalia | 30 | 7 | .125 | .111 | .143 | .000 | .000 | .000 |
| Under | South Sudan | 30 | 9 | .235 | .250 | .222 | .250 | .286 | .222 |
| Under | Yemen | 30 | 8 | .222 | .200 | .250 | .000 | .000 | .000 |
| 1-10 Under (tier) | 210 | 53 | .342 | .300 | .396 | .167 | .186 | .151 | |
| Mid | Colombia | 30 | 6 | .167 | .167 | .167 | .000 | .000 | .000 |
| Mid | Ethiopia | 30 | 11 | .381 | .400 | .364 | .333 | .429 | .273 |
| Mid | Haiti | 30 | 12 | .333 | .333 | .333 | .333 | .333 | .333 |
| Mid | Lebanon | 30 | 8 | .125 | .125 | .125 | .125 | .125 | .125 |
| Mid | Mali | 30 | 9 | .105 | .100 | .111 | .118 | .125 | .111 |
| Mid | Mexico | 30 | 0 | .000 | .000 | .000 | .000 | .000 | .000 |
| Mid | Nigeria | 30 | 7 | .316 | .250 | .429 | .133 | .125 | .143 |
| Mid | Palestine | 30 | 7 | .118 | .100 | .143 | .143 | .143 | .143 |
| Mid | Sudan | 30 | 6 | .267 | .222 | .333 | .235 | .182 | .333 |
| Mid | Syria | 30 | 5 | .182 | .167 | .200 | .000 | .000 | .000 |
| Mid | Ukraine | 30 | 3 | .000 | .000 | .000 | .000 | .000 | .000 |
| 1-10 Mid (tier) | 330 | 74 | .212 | .188 | .243 | .165 | .155 | .176 | |
| Over | Belarus | 30 | 0 | .000 | .000 | .000 | .000 | .000 | .000 |
| Over | Iran | 30 | 4 | .250 | .167 | .500 | .375 | .250 | .750 |
| Over | Israel | 30 | 1 | .167 | .091 | 1.000 | .000 | .000 | .000 |
| Over | Poland | 30 | 0 | .000 | .000 | .000 | .000 | .000 | .000 |
| 1-10 Over (tier) | 120 | 5 | .150 | .086 | .600 | .188 | .111 | .600 | |