Interface-Variant Dynamics in Software Ecosystems:
Resolver-Induced Selection and Adoption in Package Graphs
June 30, 2026
Abstract
Compatibility research usually treats an interface change as a local writer-reader decision. Distributed software stacks make that decision population structured: an RPC, telemetry, middleware, or service-contract variant is introduced by one provider release and then spreads, stalls, or is mediated across consumers, transitive dependencies, and resolver rules. This paper asks when that observation is a load-bearing software-engineering estimator rather than evolutionary relabeling. We mine interface histories, audit npm, Maven Central, PyPI, and crates.io package graphs, execute 2100 package-manager resolver probes, estimate an ecosystem-specific selection coefficient \(s\) from clean conflict probabilities, and use that measured \(s\) to forward evaluate a pairwise-comparison absorbing process on the observed package graph. We then separate three evidential roles that are often conflated. Fixation is a forward evaluation, not independent evidence: once \(s\) is measured, deviation from \(1/N\) follows mechanically from the non-neutral process. Checker-derived direction carries adoption signal: a direction-permutation null gives checker-direction gap MAE 0.07 versus null median 0.43 (\(p=0.002\)). But because that direction is derived from the same boundary state whose admitting frequency is predicted, it is a diagnostic rather than an orthogonal selection test. The stricter checker-free temporal test asks whether early resolver-channel features predict later blocked-to-admitted flips; in the present data they do not beat age-only (Brier 0.28 versus 0.24, AUC 0.51 versus 0.54). The result is therefore not a closed claim that population dynamics have already been independently validated. It is a reproducible estimator audit that shows exactly where resolver evidence becomes population input and where the current registry data still fail to close the loop.
1 Problem↩︎
Generated interfaces evolve locally, but dependency managers expose their effects at population scale in distributed software stacks. A changed protobuf, IDL, JSON protocol schema, or GraphQL schema creates a contract variant on an RPC, middleware, telemetry, or service-client boundary. Some consumers remain on the old admissible variant, some accept the new one, and some depend on resolver mediation at a version boundary. The engineering question is therefore not only whether one reader accepts one writer. It is whether a locally introduced provider variant can propagate through a client-provider package graph under the update rule imposed by the ecosystem.
The population model is software-native. Packages are carriers, contract versions are variants, dependency neighborhoods define which distributed clients, services, and middleware adapters can be affected, and package-manager resolution supplies the local payoff of being across a variant boundary. The update event is adoption or imitation, not biological reproduction. That still puts the estimator in the mathematical family of evolutionary graph theory and pairwise-comparison dynamics [1]–[4]: a variant starts rare, local interactions induce a payoff difference, and a finite graph either absorbs at extinction or fixation.
The coupling is useful only if the estimator obeys an identifiability discipline: a rule that measures selection must not contain an instance of the selection signal it is asked to prove. Clean resolver outcomes define \(s\); \(s\) drives fixation simulations on the real graph as a forward evaluation; and topology is reported as calibrated \(\Delta\rho\) against graph nulls. Those steps put measured software costs onto a finite-population scale, but they do not by themselves prove that adoption histories follow the same selection channel. The adoption analysis is therefore split into a checker-proximal diagnostic, which tests whether the assignability direction has any real adoption signal, and a checker-free temporal prediction, which tests whether resolver-channel features predict later admission without reusing the checker state as the answer.
The paper makes four concrete contributions:
a calibrated directional-assignability instrument for generated interfaces, with accept-side gates rather than untested compatibility labels;
an ecosystem-specific resolver selection estimator derived from real package-manager executions;
fixation, topology, and power diagnostics on registry-scale package graphs, explicitly reported as forward consequences of measured \(s\) rather than independent evidence; and
a held-out adoption audit mined from time-stamped registry histories, including direction permutation, checker-free temporal flip prediction, hierarchical resolver/adoption consistency, and maintenance-recency stratification.
2 Interface Variants↩︎
For a writer contract \(W\) and reader contract \(R\), write \(W\preceq R\) when every reader obligation is supplied by the writer with a compatible wire representation. The relation is directional: extra writer fields may be ignored by an older reader, whereas missing reader fields and unsafe wire-family changes reject the assignment. The artifact evaluates exact matching, the reader-obligation proxy, and FULL transitive compatibility. The proxy is not presented as a replacement for deployed Avro, protobuf, Confluent, or DDS-XTypes semantics [5]–[8]; it is a declared measurement instrument whose error is estimated before it is used in population claims.
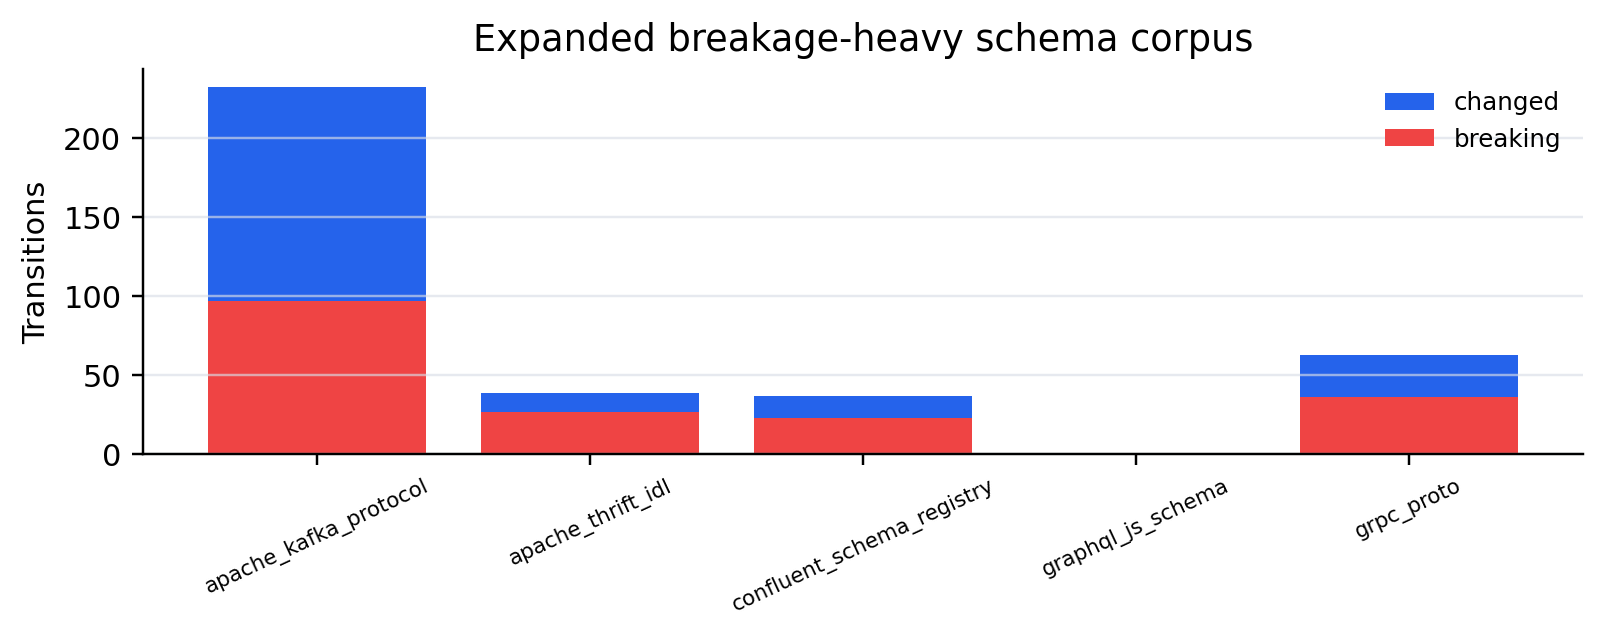
The source-history frame contains ROS 2 and OpenTelemetry interface histories, plus a breakage-heavy schema-history corpus spanning gRPC, Apache Thrift, Kafka protocol JSON, Confluent Schema Registry, and GraphQL histories. These are distributed communication surfaces rather than ordinary in-process APIs: they define message, telemetry, broker, and service contracts that must remain coherent across independently released clients and providers. The histories define the local variant classes and provide external compatibility checks before the registry-scale graph audit.
| Corpus | Kind | Tags | Files | Changed | Breaking |
|---|---|---|---|---|---|
| apache kafka protocol | kafka_json | 58 | 281 | 232 | 97 |
| apache thrift idl | thrift | 29 | 185 | 39 | 27 |
| confluent schema registry | schema | 80 | 95 | 37 | 23 |
| graphql js schema | graphql | 80 | 3 | 1 | 1 |
| grpc proto | proto | 80 | 190 | 63 | 36 |
3 Calibration Gates↩︎
Population claims require the local compatibility instrument to be trustworthy on both rejection and acceptance. We therefore calibrate against three independent references: observed OpenTelemetry protobuf transitions checked with
buf breaking at WIRE compatibility, synthetic Buf-WIRE conformance cases generated from known-safe and known-breaking edit classes, and ROS 2 IDL transitions evaluated with a DDS-XTypes-style backward assignability checker. The accept-side
adoption analysis is enabled only when negative predictive value clears a pre-stated gate.
| Calibration | \(n\) | Reject PPV | Accept NPV | Gate |
|---|---|---|---|---|
| Observed Buf-WIRE | 42 | 0.59 | 0.84 | pass |
| Buf-WIRE conformance | 300 | 1.00 | 1.00 | pass |
| XTypes independent states | 27 | 0.80 | 1.00 | pass |
| Empirical pooled | 69 | 0.67 | 0.90 | pass |
The calibration now supports the direction of the paper. The empirical pooled calibration gives a reject PPV of 66.67% and an accept NPV of 90.48%, while the generated Buf-WIRE conformance suite checks 300 cases with 300 exact matches. Classifier uncertainty is still propagated into graph and adoption quantities: the backward graph-rejection count has bootstrap mean 20.24 with a [15.00, 26.00] 95% interval, and the backward accept-rate interval is 55.56–74.60%.
4 Registry Graphs↩︎
The registry audit asks whether a consumer’s declared constraint still admits the provider’s current release. That latest-provider rejection is a variant-boundary position, not a build-failure label. The audit covers npm, Maven Central, PyPI, and crates.io roots and records both the package graph and the checked constraint outcomes.
| Ecosystem | Roots | Nodes | Edges | Checked | Latest rejects |
|---|---|---|---|---|---|
| cargo | 700 | 935 | 2810 | 2810 | 257 (9.1%) |
| maven | 750 | 1143 | 2879 | 2414 | 496 (20.5%) |
| npm | 750 | 2100 | 2780 | 2780 | 578 (20.8%) |
| pypi | 670 | 1351 | 2022 | 2002 | 254 (12.7%) |
| all | 2920 | 5503 | 10491 | 10006 | 1585 (15.8%) |
Across 2920 roots, the audit records 5503 graph nodes, 10491 dependency edges, and 10006 checked constraints. 1585 checked edges reject the provider’s latest release. The benign-drift baseline separates this boundary position from ordinary version age: latest rejection is 15.84%, below the previous-release baseline 46.52% and the historical-release baseline 80.49%.
| Ecosystem | Edges | Latest | Previous | Historical | Latest-prev. |
|---|---|---|---|---|---|
| cargo | 2810 | 9.1% | 23.1% | 71.0% | -13.9 |
| maven | 2414 | 20.5% | 94.7% | 95.2% | -4.8 |
| npm | 2780 | 20.8% | 66.0% | 88.4% | -45.0 |
| pypi | 2002 | 12.7% | 38.8% | 78.9% | -16.8 |
| all | 10006 | 15.8% | 46.5% | 80.5% | -25.8 |
5 Resolver Selection↩︎
Local registry rejection becomes a population parameter only after executable resolver behavior is measured. Let \(r^-_e\) be the probability that a clean latest-reject probe in ecosystem \(e\) still resolves successfully, and let \(r^+_e\) be the same probability for checker-accepted calibration probes. With Jeffreys smoothing, \[\hat{r}^-_e = \frac{\mathrm{ok}^-_e + 1/2}{n^-_e + 1}, \qquad \hat{r}^+_e = \frac{\mathrm{ok}^+_e + 1/2}{n^+_e + 1}.\] The resolver-derived selection coefficient is \[s_e = \log \frac{\hat{r}^-_e}{\hat{r}^+_e}.\] Thus \(s_e\) is not assigned by vocabulary. It is the log-relative viability of a boundary edge under the ecosystem’s resolver. Values near zero indicate weak mediation cost; large negative values indicate that mixed-version boundaries sharply reduce successful resolution relative to accepted calibration edges.
| Ecosystem | Attempted | Clean | Conflicts | Wilson 95% | Excluded |
|---|---|---|---|---|---|
| cargo | 246 | 246 | 2 (0.8%) | [0.2, 2.9] | 0 |
| maven | 496 | 496 | 376 (75.8%) | [71.8, 79.4] | 0 |
| npm | 578 | 576 | 76 (13.2%) | [10.7, 16.2] | 2 |
| pypi | 249 | 194 | 175 (90.2%) | [85.2, 93.6] | 55 |
Among 1512 clean latest-reject probes, 629 become resolver conflicts (41.60%). The pooled rate is not averaged away because the heterogeneity test is overwhelming (\(p=0.00\)); the heterogeneity is precisely the ecosystem-specific payoff regime that feeds \(s_e\).
Two sensitivity checks keep this measurement from becoming a clean-only artifact. First, the PyPI probe has 55 excluded latest-reject attempts out of 249; treating excluded attempts as all successful or all conflicting gives an intention-to-probe conflict range of 70.28–92.37%, so the extreme PyPI penalty is not created by dropping unavailable versions. Second, the pooled reject PPV is 66.67%, so the selection coefficient is recomputed under a conservative mixture in which false rejects resolve like accepted calibration edges. This propagates reject-side classifier error into \(s_e\) itself rather than only into edge counts.
| Ecosystem | Attempted | Clean conflict | ITT conflict bounds | PPV-adjusted \(s\) |
|---|---|---|---|---|
| npm | 578 | 13.2% | 13.1–13.5% | -0.20 |
| maven | 496 | 75.8% | 75.8–75.8% | -6.77 |
| pypi | 249 | 90.2% | 70.3–92.4% | -5.85 |
| cargo | 246 | 0.8% | 0.8–0.8% | -0.01 |
6 Fixation Model↩︎
For each ecosystem, the directed dependency graph is projected to the largest undirected interaction component \(G_e=(V_e,E_e)\). Each package has state \(x_i\in\{0,1\}\), where 1 is the introduced variant. Let \(m_i(x)\) be the fraction of neighbors of \(i\) with the opposite state. The software payoff is \[\pi_i(x) = s_e\,m_i(x).\] At each update, a focal package \(i\) samples a neighboring model package \(j\) and copies \(j\) with Fermi probability \[P(i\leftarrow j) = \frac{1}{1+\exp[-(\pi_j(x)-\pi_i(x))]}.\] The process starts with one introduced variant and stops at extinction or fixation. The measured output is \(\rho(s_e,G_e)\), estimated by Monte Carlo with Wilson intervals. The neutral benchmark is exact: when \(s_e=0\), the single-variant fixation probability is \(1/|V_e|\).
| Ecosystem | Resolver \(s\) [95%] | Forward \(\rho(s,G)\) [95%] | Neutral \(1/N\) | Regime |
|---|---|---|---|---|
| npm | -0.131 [-0.169, -0.094] | 0.00017 [0.00007, 0.00039] | 0.00059 | suppression |
| maven | -1.286 [-1.457, -1.118] | 0.00000 [0.00000, 0.00013] | 0.00108 | suppression |
| pypi | -2.185 [-2.670, -1.808] | 0.00000 [0.00000, 0.00013] | 0.00106 | suppression |
| cargo | -0.007 [-0.024, 0.008] | 0.00063 [0.00041, 0.00099] | 0.00114 | near-neutral |
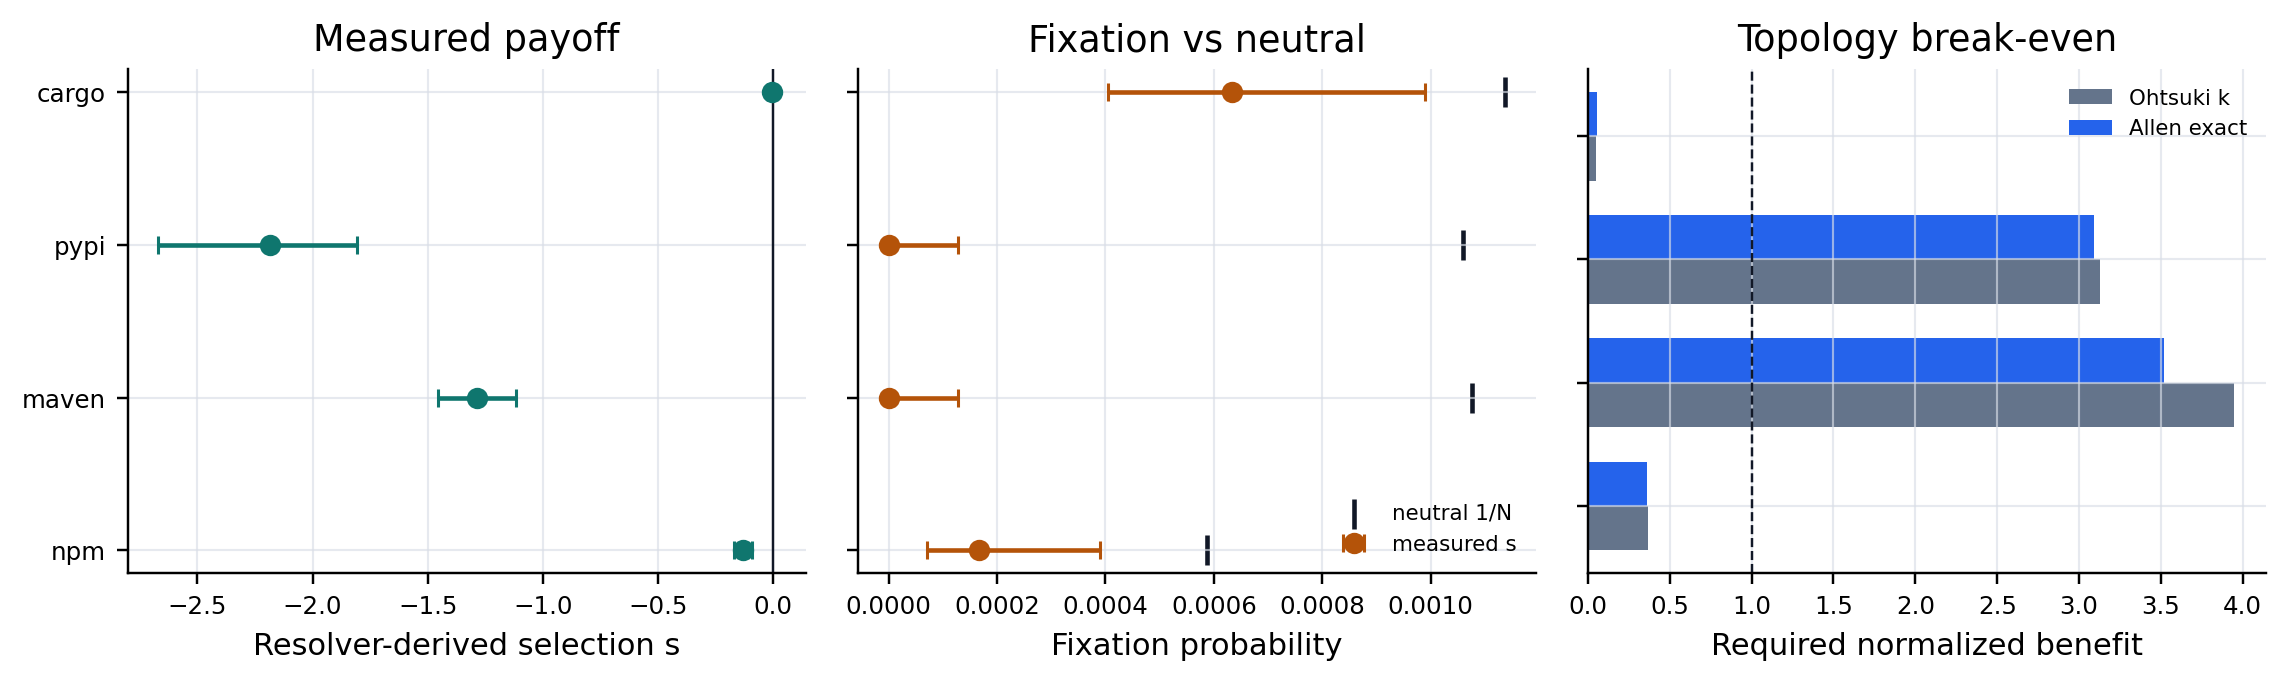
This table is a forward evaluation, not independent evidence for the population hypothesis. Once \(s_e\) is measured, separation from \(1/N\) is the expected consequence of running a non-neutral absorbing process. The result is still useful because it puts the resolver penalty on the registry graph scale, but it is not counted as a second empirical test of the same signal. The cargo row shows why this distinction matters: its resolver interval crosses zero, so the correct interpretation is near-neutral even though the point Monte Carlo interval falls below \(1/N\). Section 8 therefore treats later registry histories as a separate audit and distinguishes checker-proximal adoption signal from checker-free prediction.
7 Topology Conditions↩︎
Topology is reported as a calibrated response rather than a pass/fail population claim. First, the observed graph is evaluated under Ohtsuki’s degree-based rule and Allen et al.’s structure-coefficient formalism. These are diagnostic thresholds for a benefit-favoring regime; the measured resolver regime here is non-positive in all four ecosystems, so the operational target is suppression or near-neutrality, not cooperation amplification. Let \(c_e\) be the incremental conflict cost measured by the resolver audit. The Ohtsuki diagnostic asks whether the required benefit exceeds \(c_e\bar{k}\). For the Allen diagnostic, coalescence samples estimate the structure threshold \[(b/c)^* = \frac{t_2}{t_3-t_1},\] with infinite threshold when the denominator is nonpositive; the required benefit is \(c_e(b/c)^*\). Second, fixation response on the observed graph is compared with three null families: degree-preserving rewiring, clustering-preserving rewiring, and a directed consumer-provider configuration null projected back to an interaction graph. The reported quantity is \(\Delta\rho\), the observed signed fixation response minus the median null response.
| Ecosystem | \(N\) | \(\bar{k}\) | Allen \((b/c)^*\) | \(\Delta\rho_{deg}\) | \(\Delta\rho_{clust}\) | \(\Delta\rho_{c/p}\) |
|---|---|---|---|---|---|---|
| npm | 1704 | 2.98 | 2.90 | -0.00017 | -0.00017 | -0.00017 |
| maven | 929 | 6.17 | 5.50 | 0.00000 | 0.00000 | 0.00000 |
| pypi | 943 | 3.93 | 3.88 | 0.00000 | 0.00000 | 0.00000 |
| cargo | 879 | 5.88 | 6.88 | 0.00003 | 0.00020 | 0.00070 |
4 ecosystems have finite Allen thresholds under the estimated coalescence coefficients, but the measured data do not enter the positive-benefit branch those thresholds favor. The null comparisons instead show whether the observed package graph changes the suppression response relative to matched ensembles. This makes topology load-bearing only where it has an operational target: the sign and magnitude of \(\Delta\rho\) under the measured resolver regime.
8 Adoption Validation↩︎
The fixation model is a finite-population endpoint. The adoption histories are the only place where the population claim can be checked against later registry behavior rather than replayed from the measured resolver coefficient. We mine 2995 consumer-release observations over 274 provider-boundary lineages. A lineage has \[a_\ell = \begin{cases} +1, & \text{provider-favored: the provider boundary is admitted},\\ -1, & \text{consumer-favored: the consumer constraint blocks it}. \end{cases}\] This label is generated by the checker state of the edge. That makes it a useful engineering quantity, but it also creates the central identifiability risk: if the outcome is admitting frequency, then a predictor that contains the same admission state is not independent evidence for selection. The analysis below therefore separates a checker-proximal diagnostic from a checker-free temporal prediction.
First, we ask whether checker direction carries any real adoption signal after holding out ecosystems. The baseline is \[\operatorname{logit}\hat{x}_{\ell e}(t) = \alpha + \beta \log(1+t/90).\] The resolver-directional edge game adds the measured population penalty \(|s^{\mathrm{pop}}_e|=|q_e s_e|\) with its sign supplied by assignability: \[\operatorname{logit}\hat{x}_{\ell e}(t) = \alpha + \beta \log(1+t/90) + \gamma a_\ell |s^{\mathrm{pop}}_e|.\] The checker-direction model estimates a free direction effect, \[\operatorname{logit}\hat{x}_{\ell e}(t) = \alpha + \beta \log(1+t/90) + \eta a_\ell,\] and is reported as a diagnostic, not as an independent inverse estimator, because \(a_\ell\) is derived from the checker state.
| Held-out model | Rows | MAE | Final MAE | Direction-gap MAE |
|---|---|---|---|---|
| Age-only | 29 | 0.24 | 0.21 | 0.42 |
| Resolver-directional | 29 | 0.18 | 0.19 | 0.39 |
| Checker-direction | 29 | 0.13 | 0.16 | 0.07 |
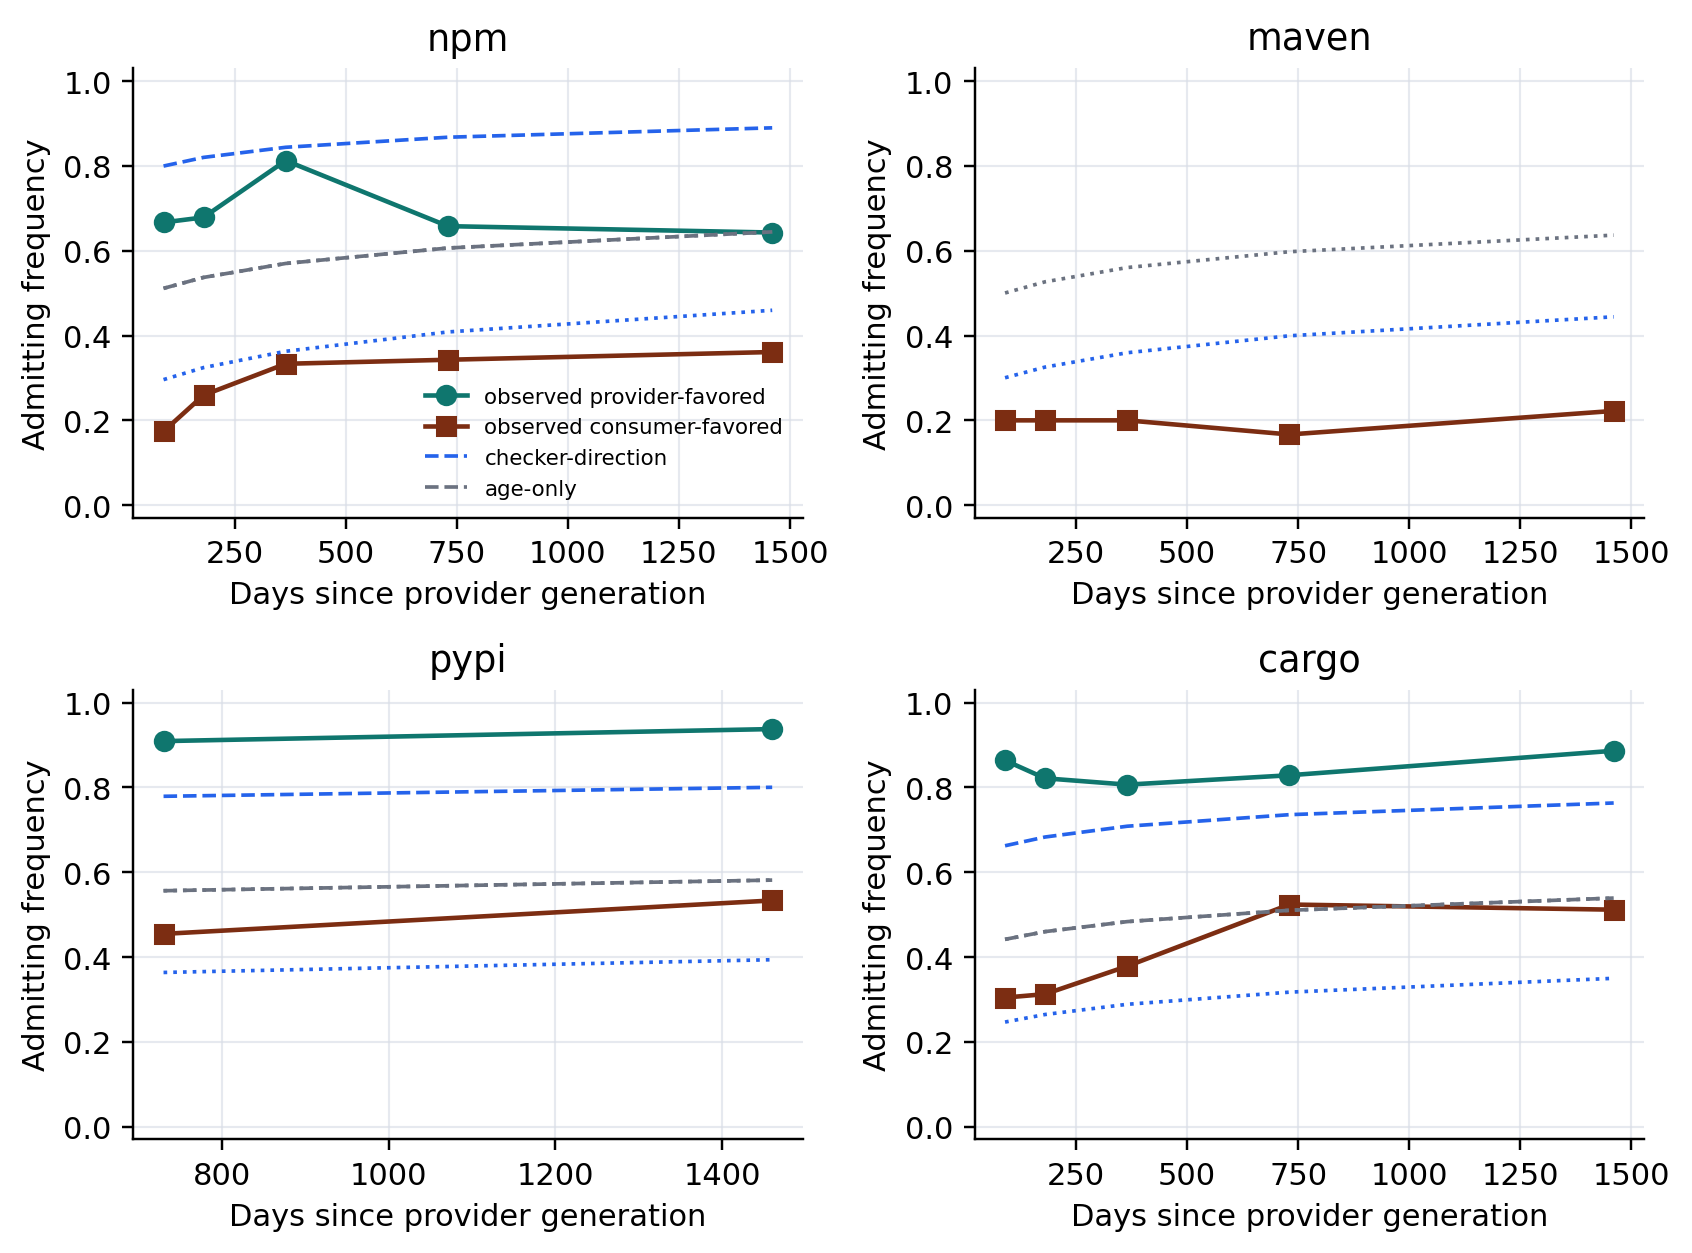
The held-out ecosystem fits none of its own coefficients. Across 29 held-out directional rows, age-only MAE is 0.24, the resolver-directional edge game improves it to 0.18, and the checker-direction diagnostic improves it to 0.13. The equal-age direction-gap error falls from 0.42 to 0.07. That is real signal in the checker state, but it is not yet an orthogonal population estimate: age-only predicts zero direction gap by construction, and the direction label is derived from the same edge state whose admitting frequency is being summarized.
To quantify this limitation, we run 400 direction permutations that swap provider- and consumer-favored labels within ecosystem-horizon cells while preserving the observed adoption frequencies and sample sizes. The checker-direction row remains far outside this null, while the resolver-directional row does not.
| Model | Observed gap MAE | Null median | Null 95% | \(p_{perm}\) |
|---|---|---|---|---|
| Age-only | 0.42 | 0.42 | [0.42, 0.42] | 1.000 |
| Resolver-directional | 0.39 | 0.42 | [0.35, 0.52] | 0.177 |
| Checker-direction | 0.07 | 0.43 | [0.25, 0.52] | 0.002 |
This table rules out the trivial explanation that any arbitrary direction label would fit the adoption gap. It does not rule out signal leakage from the checker into the outcome. The stricter test removes checker direction from the predictor. At 365 days after a provider generation, we retain lineages that are still not admitted and ask whether they flip to admitted by 1460 days. The resolver-channel model uses only age, the observed resolver outcome, and the ecosystem-level resolver penalty; it does not use \(a_\ell\).
| Model | Candidates | Flips | Brier | AUC | Top-half flip |
|---|---|---|---|---|---|
| Age-only | 47 | 16 | 0.24 | 0.54 | 0.35 |
| Resolver-channel | 47 | 16 | 0.28 | 0.51 | 0.26 |
| Checker-direction | 47 | 16 | 0.24 | 0.57 | 0.39 |
This is the strictest adoption check in the present artifact. On 47 candidate lineages with 16 later flips, the resolver-channel model does not beat age-only: its Brier score is 0.28 versus 0.24, and its AUC is 0.51 versus 0.54. The checker-direction diagnostic remains slightly better ranked (0.57 AUC), but that is exactly the checker-proximal signal separated above. Therefore the registry adoption data do not yet license the stronger claim that resolver-measured selection independently predicts future admission.
| Ecosystem | Provider/consumer lineages | \(\hat{s}_{check}\) [95%] | \(|s_{resolver}|\) | \(|s_{pop}|\) |
|---|---|---|---|---|
| npm | 42/36 | 0.81 [0.60, 1.05] | 0.131 | 0.027 |
| maven | 3/18 | 1.48 [0.93, 7.57] | 1.286 | 0.264 |
| pypi | 16/15 | 1.38 [0.78, 7.82] | 2.185 | 0.277 |
| cargo | 44/43 | 1.01 [0.78, 1.29] | 0.007 | 0.001 |
The ecosystem-level checker-direction estimates are positive in all four ecosystems, but a four-point Pearson correlation is not an inferential result. We therefore replace the raw correlation claim with a small hierarchical measurement model that treats both the adoption-side estimate and the resolver-side penalty as noisy observations. The coupling slope is positive in the posterior median, while residual heterogeneity remains large enough that the result should be read as consistency, not closure.
| Quantity | Median | 95% interval | Posterior probability |
|---|---|---|---|
| Coupling slope \(\beta\) | 0.42 | [0.02, 1.30] | \(P(\beta>0)=0.98\) |
| Residual heterogeneity \(\tau\) | 0.29 | [0.00, 1.34] | \(P(\tau<0.5)=0.70\) |
The mismatch is not an error to be hidden. Cargo has near-zero resolver penalty but a strong checker-direction adoption gap, while Maven has only three provider-favored lineages and therefore a wide adoption interval. A maintenance-recency stratification shows another confound: stale providers can have very different admitting frequencies from actively maintained providers, so adoption pressure is not reducible to resolver mechanics alone.
| Ecosystem | Provider recency | Lineages | Provider-favored | Admit freq. |
|---|---|---|---|---|
| cargo | active provider | 72 | 30 | 0.64 |
| cargo | stale provider | 20 | 18 | 0.90 |
| maven | active provider | 19 | 3 | 0.63 |
| maven | stale provider | 29 | 1 | 0.45 |
| npm | active provider | 66 | 32 | 0.44 |
| npm | stale provider | 19 | 13 | 0.79 |
| pypi | active provider | 41 | 17 | 0.80 |
| pypi | stale provider | 8 | 8 | 1.00 |
9 Power Diagnostic↩︎
The fixation power calculation is a design diagnostic, not an empirical validation. It prevents small toy graphs from being mistaken for population evidence by computing the minimum detectable positive and negative mixed-edge selection strength for an exact well-mixed pairwise-comparison fixation probability, evaluated at canonical graph sizes and at the actual registry component sizes. The canonical calculation falls from roughly \(|s|\approx 0.043\) at \(N=8\) to \(|s|\approx 0.013\) at \(N=64\) and \(|s|\approx 0.0036\) around \(N=1024\), which is why tiny release-history graphs are treated as descriptive only. At the observed registry component sizes (\(N=879\) to \(1704\)), the 80% minimum detectable selection strengths are approximately \(0.0020\)–\(0.0030\) for positive selection and \(-0.0029\)–\(-0.0038\) for negative selection.
| Ecosystem | \(N\) | Trajectories | MDE \(s>0\) | MDE \(s<0\) |
|---|---|---|---|---|
| cargo | 879 | 30000 | 0.0030 | -0.0038 |
| maven | 929 | 30000 | 0.0029 | -0.0036 |
| pypi | 943 | 30000 | 0.0028 | -0.0038 |
| npm | 1704 | 30000 | 0.0020 | -0.0029 |
10 Threats To Validity↩︎
The registry audit observes declared dependency constraints and resolver plans, not downstream source builds. Optional extras, native build scripts, environment-specific test suites, and undeclared runtime coupling remain outside this cross-registry
design. Ecosystem-specific mechanisms are only partly represented: npm peer dependencies and overrides, Maven dependencyManagement and BOM import scope, PyPI environment markers and extras, and Cargo feature unification can all alter the
realized boundary state observed by a downstream build.
The directed dependency graph must be projected to an interaction graph for pairwise comparison; the consumer-provider configuration null is included to test the projection’s most obvious structural loss. The endpoint fixation model still uses a symmetric mixed-boundary payoff and is therefore a forward diagnostic, not the decisive population test. The adoption validation relaxes that symmetry by carrying assignability direction into the edge game, but that direction is checker-derived. Consequently the checker-direction results are diagnostic of adoption signal, while the checker-free temporal flip test is the stricter estimator check and is negative in this snapshot.
Calibration corpora are larger than the original release-history frame but still partial, so classifier error is propagated rather than ignored. The registry snapshot is frozen at the observation date, and the artifact records the installed tool versions used for resolver probes. This makes the reported run reproducible, but it does not remove registry drift as a threat to future reruns.
11 Artifact↩︎
The arXiv source package places the article source and root figures at the submission root and records code, data, and reproducibility notes under anc/. The ancillary directory contains the mined histories, registry graphs, resolver probes,
calibration outputs, fixation runs, topology classifications, trajectory predictions, permutation nulls, temporal flip predictions, hierarchical consistency summaries, maintenance-recency strata, tool-version manifests, and table-regeneration code. Table
generation is offline from recorded CSV/JSON outputs; full reproduction reruns mining against upstream Git repositories and package registries.
12 Related Work↩︎
Software evolution work established that useful systems keep changing and that API migration imposes developer cost [9]–[13]. Semantic versioning communicates intent but does not implement assignability or resolver mediation [14]. Avro, Protocol Buffers, Confluent Schema Registry, and DDS-XTypes provide local compatibility baselines [5]–[8]. ROS 2 and DDS provide the distributed middleware setting for generated interfaces and typed message exchange [15]–[17]. Evolutionary graph theory and pairwise-comparison dynamics provide the finite-population language for variants, structured interaction, selection, fixation, and drift [1]–[4]. The contribution here is to instantiate that language with package-manager semantics and executable resolver evidence, while exposing where the resulting estimator is and is not identifiable from registry histories.
13 Conclusion↩︎
Interface evolution in package ecosystems can be analyzed as contract-variant dynamics, but only when the software measurements are allowed to constrain the population model rather than merely rename its terms. This paper makes that boundary explicit. Resolver conflicts estimate ecosystem-specific selection, the real package graph defines a forward fixation diagnostic, and topology is reported as calibrated \(\Delta\rho\) against graph nulls. Adoption histories show that checker-derived direction contains strong adoption signal, and a permutation null confirms that the signal is not an arbitrary label effect. The stricter checker-free temporal test, however, does not yet show that resolver-channel features independently predict future admission. The artifact therefore turns relabeling into a falsifiable estimator pipeline, but it also records the present failure point: the resolver-to-adoption loop is measured, diagnosable, and not yet closed by this snapshot.
References↩︎
Corresponding author:
alpay@lightcap.ai↩︎