No title
January 01, 1970
Visible or Covert? The Causal Effect of Inspector Visibility on Fare Evasion Detection: A Causal Machine Learning and Policy Learning Approach
Hannes Wallimann\(^*\), Cédric Brütsch\(^*\) \(^{\dagger}\) and Martin Huber\(^{\dagger}\)
\(^*\)University of Applied Sciences and Arts Lucerne, Competence Center for Mobility
\(^{\dagger}\)University of Fribourg, Dept. of Economics
2026
Abstract:
Fare evasion generates substantial revenue losses for public transport operators and is typically combated through fare inspections, yet little is known about how the mode of inspection—uniformed versus plainclothes—affects detection efficiency. Using a unique dataset of 21,727 inspection records from PostAuto, the largest regional bus operator in Switzerland, we apply causal machine learning to estimate the causal effect of inspector visibility on inspection efficiency, defined as detected fare evaders per inspection hour. Our results indicate that plainclothes inspections are, on average, significantly more effective than uniformed inspections, with an estimated average treatment effect of \(-\)0.173 incidents per hour, corresponding to a relative reduction of approximately 26%. Heterogeneity analyses find no evidence of systematic effect variation across contextual characteristics, suggesting that the superiority of plainclothes inspections is robust and pervasive across the PostAuto network. When applying optimal policy learning (based on policy trees) to optimally target subgroups by one or the other treatment depending on relative effectiveness, plainclothes inspections are recommended for the large majority of contexts (83.3%), with uniformed inspections suggested only for lines characterised by a below-median share of foreign residents and above-median population size.
Keywords: fare evasion detection, inspection strategy, causal machine learning, optimal policy learning
Acknowledgments: We are indebted to Bruno Zwyssig, Timon Heiland, Luigi Orlando, Simon Schüpbach, and Reto Steiner for their helpful discussions. We used large language models (mainly Claude by Anthropic) as supportive tools for programming assistance and linguistic refinement of the manuscript. All outputs were carefully reviewed and verified by the authors, who take responsibility for the content presented.
1.5 Addresses for correspondence: Hannes Wallimann, hannes.wallimann@hslu.ch; Cédric Brütsch, cedric.bruetsch@hslu.ch; Martin Huber, martin.huber@unifr.ch.
1 Introduction↩︎
Public transport companies can adopt different ticketing systems. One common approach is the proof-of-payment system, an open-access system that allows passengers to board transport vehicles without prior ticket inspection, with fares verified through random spot checks by inspectors. This non-excludability gives rise to fare evasion, defined as the deliberate act of travelling on public transport without purchasing, validating, or correctly selecting the required ticket [1].
Fare evasion can generate substantial economic losses for public transport companies and may also damage their corporate image. To enforce fare payment, public transport companies typically impose monetary fines on detected fare evaders and organise inspection teams with respect to timing and location [1]–[4]. However, fare inspection strategies are not only defined by their intensity and location [4]–[6] but also by their mode of implementation, particularly whether inspections are conducted by uniformed (visible) or plainclothes (covert) staff [1]. Visible enforcement is expected to increase the perceived probability of inspection, thereby discouraging opportunistic fare evasion [2]. Yet, this visibility may simultaneously enable strategic adaptation by passengers, who can evade or adjust their behavior when enforcement is observable. In contrast, plainclothes inspections are less salient but potentially more effective at detecting actual offenders, as they limit opportunities for behavioral adjustment. Empirical evidence in public transport remains scarce, but existing studies suggest that inspection outcomes depend on enforcement visibility: using data from Lyon, [7] show that inspection records are inherently biased by enforcement practices, as visible controls may underestimate true evasion due to systematic avoidance behavior. Similarly, [8] provide indicative evidence that inspection strategies influence observed evasion patterns, though without isolating the causal impact of inspector visibility.
To address this gap in the literature, we analyse a unique inspection dataset from PostAuto, the largest operator of regional bus services in Switzerland. We complement this dataset with potential determinants of fare evasion, including the share of the population holding a public transport subscription, the share of foreign residents, the youth dependency ratio, the number of inhabitants, and the social assistance rate. Our analysis is conditional on inspections being conducted and therefore does not generalise to contexts in which no inspection activity takes place. We identify the causal effect of inspection strategy under a selection-on-observables assumption, arguing that—conditional on the determinants of fare evasion, prior inspection activity, and public transport accessibility—the assignment of inspection strategy can be regarded as good as random.
In a first step, we apply causal machine learning [9] to estimate the effect of the binary treatment of uniformed (Präsenzkontrolle) versus plainclothes (Normalkontrolle) inspections on inspection efficiency, defined as the number of detected fare evaders per unit of inspection time. In other words, we estimate the short-run efficiency losses associated with deploying uniformed rather than plainclothes inspectors. We further examine treatment effect heterogeneity across all observed characteristics. Specifically, we estimate the Best Linear Predictor (BLP) of the conditional average treatment effect (CATE), which tests whether statistically significant heterogeneity exists by projecting the CATE linearly onto a pre-selected set of contextual characteristics. In addition, we estimate the Sorted Group Average Treatment Effects (GATES), which quantify the average treatment effect across groups ranked by their CATE and subsequently test for significant differences between groups. [10].
In a second step, we apply optimal policy learning [11], [12] to determine the inspection strategy that maximises inspection efficiency across contexts. Optimal policy learning aims to optimally allocate an intervention across subgroups based on the size of their CATEs, and we implement it using a policy tree, which learns both the optimal subgroup segmentation and the optimal intervention assignment in a data-driven way. While machine learning methods have recently been applied to fare evasion research—for instance, to classify fare evader profiles or optimise inspector scheduling [13]—and [14] apply reinforcement learning to optimise inspector routing, neither causal machine learning nor optimal policy learning has, to the best of our knowledge, been applied to the study of fare inspection strategies.
Our results suggest that plaincloth inspections are on average significantly more effective at detecting fare evaders than uniformed inspections. We estimate an average treatment effect of wearing a uniform of \(-\)0.173 incidents per hour (i.e., a relative reduction of approximately 26% compared to the sample mean). While the distribution of estimated CATEs reveals some variation across contexts, the effect is consistently negative across all observed characteristics: neither the Best Linear Predictor nor the Sorted Group Average Treatment Effects provide evidence that uniformed inspections outperform plainclothes inspections in any identifiable subgroup. These findings suggest that the superiority of plainclothes inspections is a robust and pervasive phenomenon across the PostAuto network.
Although the analysis applying causal machine learning reveals limited evidence of systematic treatment effect heterogeneity, we apply optimal policy learning to examine whether a data-driven allocation rule can nonetheless identify contexts in which uniformed inspections are preferable. Applying a policy tree [12], we find that plainclothes inspections are recommended for the large majority of contexts (83.3%), with uniformed inspections suggested only for lines characterised by a below-median share of foreign residents and above-median population size.
The paper proceeds as follows. In Section 2, we discuss the case of Switzerland. Section 3 presents the relevant literature including the determinants of fare evasion. In Section 4, we describe our unique dataset. Section 5 outlines the identification and estimation of the effects as well as a detailed discussion of the behavioral assumptions. Section 6 presents the results, which we discuss in Section 7.
2 Institutional Background↩︎
In 2025, public transport in Switzerland generated total revenues of CHF 7.04 billion. In total, transport companies sold approximately 295 million tickets, with ticket sales accounting for 31% of total revenue. Single tickets accounted for the largest share of total sales volume, representing around 71% of all tickets sold. Overall, 76.4% of tickets were sold through digital channels, with approximately one quarter of these transactions conducted via automatic-ticketing solutions, where passengers use their devices to check in before boarding and check out at the end of the trip. Offline sales channels, such as ticket machines and ticket counters, have lost importance in recent years.1
Single tickets also account for the largest share of revenues, representing approximately 31%. They are followed by the so-called General Abonnement (GA), an unlimited-use subscription that allows travel for one month or one year across almost the entire Swiss public transport network, accounting for nearly 20% of total revenues. At the end of 2024, around 425,000 individuals held a GA in Switzerland, corresponding to approximately 4.7% of the resident population.2 In terms of revenues, annual subscriptions offered by regional transport associations—i.e., unlimited-use passes valid within designated regions or tariff zones—rank next, followed by day passes. In addition, approximately 3.45 million individuals (about 38% of the Swiss population) hold a Half Fare Travelcard (Halbtax), granting a 50% price reduction on single tickets for both travel within regional tariff associations and between them.3 Other popular products include Halbtax PLUS and the GA Night. A total of about 190,000 Halbtax PLUS packages and 123,000 GA Night subscriptions were in circulation. The former provides prepaid public transport credits that can be used to purchase a range of tickets, excluding season tickets. The latter costs CHF 99 and allows individuals under the age of 25 to travel free of charge from 7 p.m. onwards across almost the entire Swiss public transport network.4
Despite the widespread availability of these products, fare evasion remains a significant challenge. According to estimates by Alliance SwissPass (the association of public transport companies in Switzerland) estimated in 2024, fare evasion results in annual revenue losses of up to CHF 200 million for the Swiss public transport system. According to the industry association, this figure is expected to remain largely unchanged in 2025.5 Therefore, this figure corresponds to approximately 2.8% of total revenues.
In 2025, a total of 1,173,295 passengers in Switzerland were detected travelling without a valid or fully valid ticket.6 This number has increased annually since 2019. Since that year, passengers travelling without a valid ticket have been centrally recorded by all Swiss public transport operators through the central information system SynServ.7
SynServ is operated by PostAuto AG on behalf of the national tariff association Alliance SwissPass. Passengers repeatedly travelling without a valid ticket are subject to progressively higher fines. For a first offence, the surcharge, including a flat-rate fare supplement, amounts to CHF 100; for a second offence, CHF 140; and for a third offence, CHF 170. The collection of these surcharges, as well as any discretionary reductions (e.g., goodwill adjustments), is the responsibility of the individual transport companies.
PostAuto is the largest operator of regional bus services in Switzerland. In 2025, the company operated 942 lines with a network length of approximately 18,000 km, serving around 11,500 stops. PostAuto generated an operating income of CHF 1,168 million and transported 189.2 million passengers in Switzerland.8
In general, three levels of fare inspection can be distinguished [15]. At the first level, the primary objective is to check as many passengers as possible. At the second level, the inspection is not recognisable as such prior to its announcement: the appearance and behaviour of inspectors give no indication that a fare check is taking place. At the third level, passengers cannot evade the inspection: once the fare check has been announced or inspectors have become visible, evasion is no longer possible. Refusal is not an option, ideally enforced through a police presence, and all alighting passengers are subject to inspection. PostAuto’s inspections are predominantly conducted at the second level, which forms the institutional basis for the plainclothes strategy examined in this study.
3 Literature review↩︎
Fare inspections combined with the imposition of fines on passengers caught without a valid ticket constitute the most widely adopted strategy to combat fare evasion in proof-of-payment transit systems worldwide [16]. As our study examines how the choice of inspection strategy (i.e., plainclothes versus uniformed staff) affects inspection efficiency, and which contextual factors moderate this effect, we review the literature along two dimensions: the determinants of fare evasion frequency, which inform the contextual characteristics included in our analysis, and the evidence on inspection strategies, which motivates our research question.
3.1 Determinants of Fare Evasion Frequency↩︎
In the following, we present studies investigating the attributes of potential fare evaders. These attributes are also summarised in Table 1.
| Attribute | Source | Context |
|---|---|---|
| Socio-demographics | ||
| [17] | Bus passengers, Reggio Emilia (Italy) | |
| [18] | Italian public transport company | |
| [19] | Flanders (Belgium), survey data | |
| [20] | Santiago (Chile), bus vs.metro | |
| [21] | Cagliari (Italy) | |
| [22] | Italy, bus company | |
| [17] | Bus passengers, Reggio Emilia (Italy) | |
| [18] | Italian public transport company | |
| [19] | Flanders (Belgium), survey data | |
| [20] | Santiago (Chile) | |
| [21] | Cagliari (Italy) | |
| [22] | Italy, bus company | |
| [17] | Bus passengers, Reggio Emilia (Italy) | |
| [18] | Italian public transport company | |
| Student | [18] | Italian public transport company |
| [18] | Italian public transport company | |
| [22] | Italy | |
| Immigrant | [17] | Reggio Emilia (Italy) |
| Travel behaviour and trip characteristics | ||
| Short trips | [17] | Reggio Emilia (Italy) |
| Occasional passenger | [17] | Reggio Emilia (Italy) |
| [22] | Italy | |
| Service, system, and operational context | ||
| Route characteristics | [23] | San Francisco (USA), railway transit |
| [23] | San Francisco (USA) | |
| [20] | Santiago (Chile) | |
| Vehicle characteristics (transport mode) | [20] | Santiago (Chile) |
| [24] | Santiago (Chile) | |
| [22] | Italy | |
| Rear-door entry | [23] | San Francisco (USA) |
| Low-income neighborhood | [20] | Santiago (Chile) |
| [20] | Santiago (Chile) | |
| [24] | Santiago (Chile) | |
| High boarding volume at stop | [24] | Santiago (Chile) |
| No off-board payment at stop | [20] | Santiago (Chile) |
| Weak metro accessibility | [20] | Santiago (Chile) |
| Prices and perceptions | ||
| [25] | Santiago (Chile) | |
| [19] | Flanders (Belgium) | |
| Perceived control probability | [19] | Flanders (Belgium) |
There are several studies from Europe. For instance, [17] interviewed passengers using the bus system in Reggio Emilia (Italy). They find that young individuals, males, unemployed persons, and non-European immigrants are more likely to evade payment. Moreover, the results indicate that passengers without tickets tend to take shorter trips and are occasional users of public transport. Applying logistic regression models to 2,200 on-board personal interviews collected among passengers of an Italian public transport company, [18] identify determinants of potential free-rider behaviour and reach a similar conclusion: fare evasion is more likely among males, young individuals, unemployed persons, students, and those with lower levels of education. Using data from Cagliari (Italy), [21] show that the intention to evade fares increases among males who travel frequently during the day and among females who are dissatisfied with the service. [22], investigating data of a mid-sized Italian bus company, show that for male, young, less educated, and captive riders the severity of fare evasion increases. Finally, their findings also indicate that more evasion is originated in the case of medium-sized vehicles as opposed to short ones.
Using logistic regression to analyse survey data collected in Flanders, the northern part of Belgium, [19] find that age and gender are robust socio-demographic predictors of fare evasion, with young and male travellers exhibiting the highest likelihood of evading fares. Moreover, perceptions of ticket prices and perceived control probability directly influence evasion rates.
Beyond Europe, [23], using a survey of over 40,000 customers in San Francisco, show that fare evasion varies by route, time of day, and the availability of rear-door entry. In South America, [25], using data from the Santiago (Chile) bus system, show that a 10% increase in fares raises fare evasion by 2 percentage points. Moreover, [20], also analysing the case of Santiago (Chile), where evasion rates differ substantially between metro and bus, find that fare evasion is higher among young men, during evening and night periods, in low-income neighbourhoods, on crowded buses, at bus stops without off-board payment, and in areas with weak accessibility to metro stations. Similarly, [24], also investigating fare evasion in Santiago, reach comparable conclusions, showing that buses with higher boarding volumes at a given stop and higher occupancy levels are more prone to fare evasion. Moreover, [24] observe a higher evasion rate in longer vehicles with multiple doors.
3.2 Inspection Strategies↩︎
There are several aspects to consider when discussing the conduct of fare inspections [16].
One dimension concerns the visibility of enforcement, that is, whether inspections are conducted by uniformed or plainclothes staff. From a theoretical perspective, uniformed inspections increase the perceived probability of detection among passengers, thereby deterring opportunistic fare evasion [2]. However, this visibility may also enable strategic adaptation, as passengers can identify and avoid inspectors. Plainclothes inspections, by contrast, limit such behavioral adjustment and may therefore be more effective at detecting actual offenders, albeit at the cost of reduced deterrence. Empirical evidence on the relative effectiveness of these two strategies remains scarce. [8] provide one of the few direct comparisons, analysing a natural experiment at Stadtwerke Münster, the inner-city bus operator in Münster, Germany, where ticket inspectors switched from uniforms to civilian clothing in December 2016. Their findings suggest that plainclothes inspections increase detections of passengers travelling without a valid ticket, while reducing cases of forgotten or unvalidated tickets. The authors attribute this pattern to the fact that infrequent travellers may fail to recognise plainclothes inspectors, making evasion detection more likely under covert enforcement. Regarding inspector visibility, [7] caution that inspection records are inherently shaped by enforcement practices, as visible controls may systematically underestimate true evasion rates due to avoidance behaviour by passengers.
Another stream of literature discusses the maximization of inspection efficiency by checking the largest possible number of passengers within a short period of time. However, maximising the number of checked passengers does not necessarily lead to the highest number of detected fare evaders. To address this issue, [22] introduce a framework that assigns a risk value to segments of routes as a function of the frequency of fare evasion, its associated severity, and exposure measures. The framework integrates fare evasion determinants, prediction models, and a risk-based assessment method. Using approximately 20,000 real-world inspection records from a mid-sized Italian bus company, the authors demonstrate the applicability of their framework. These considerations motivate our definition of inspection efficiency, defined as the number of detected fare evaders per unit of inspection time (encompassing both in-vehicle and between-vehicle time) rather than the number of passengers checked (see Section 4). Moreover, closely related to our study is the paper of [14], who apply reinforcement learning to optimise inspector routing using data from a bus network in the Paris region. Unlike our approach, however, their method does not address the causal effect of inspection strategies.
More broadly related to our study is the literature on determining the optimal number of inspections. This can be addressed empirically. For instance, using data from Italy over a three-year period, [4] develop an economic framework to determine the optimal inspection level, defined as the ratio of inspected passengers to total carried passengers. Their results indicate that the optimal inspection level amounts to 3.8%. More recently, [6] conclude that the optimal inspection rate, measured over a long time horizon and defined as the rate that maximises profit, lies in the range of 3.4%–4.0%. To this end, they apply an economic framework to approximately 57,000 stop-level inspections collected by public transport companies in Cagliari, Italy.
Finally, also more broadly related to our study, is the literature on optimal inspection activity planning. [26] present a system called Tactical Randomization for Urban Security in Transit Systems (TRUST), which computes patrol strategies designed to deter fare evasion while respecting operational constraints. The inspection scheduling problem is modelled as a leader–follower Stackelberg game, that is, a sequential-move game in which inspectors (the leader) commit to a mixed strategy and passengers (the followers) decide whether to evade or comply. More recently, also building on a Stackelberg game framework, [27] propose an inspection strategy based on in-station selective inspections using an unpredictable patrolling schedule, where a specific schedule is selected each day with a given probability.
4 sec:Data↩︎
Our primary dataset contains records of fare inspections conducted on PostAuto buses in Switzerland in 2025. Each observation corresponds to a single inspection event carried out by one inspector, and includes information on the start and end time of the inspection, the public transport line, the stop at which the inspector boarded, the type of inspection, the number of passengers checked, and the number of passengers found travelling without a valid ticket.
From these raw inspection records, we construct observations at the level of line, month, time of day,9 and inspection type. For each observation, we aggregate the total inspection time (encompassing both in-vehicle and between-vehicle time) and the total number of detected fare evaders (where multiple inspectors operated jointly on the same line segment, both inspection time and detected fare evaders are summed across all inspectors). Inspection efficiency is then defined as the ratio of detected fare evaders to total inspection time. Our sample comprises 20,176 inspection events (observations) classified as uniformed inspections (Normalkontrolle) and 1,551 observations classified as plainclothes inspections (Präsenzkontrolle), arising from 802 distinct lines.
Based on the stops and lines contained in our inspection dataset, we collected the typical route of each line from the Federal Office of Transport (FOT) via opentransportdata.swiss10, which includes the geolocation of each stop. Using these geolocations together with geodata from swisstopo (swissBOUNDARIES3D11), we mapped each stop to its corresponding municipality (see Figure 1). This allowed us to merge municipality-level attributes (potentially) associated with fare evasion (see Table 1), including population size12, degree of urbanisation13, touristic area classification14, language region15, social assistance rate, youth quotient, and share of foreign residents, all sourced from the Federal Statistical Office (FSO16). Additionally, we incorporated data from the FOT on the number of General Abonnement (GA), Half Fare Travelcard17, and regional season ticket holders18, as well as data on public transport accessibility by region from the Federal Office for Spatial Development (ARE19). We further include passenger boardings by line, sourced directly from PostAuto, as a measure of line-level demand. Finally, we include cantonal-level unemployment rates sourced from the FSO20, as municipality-level data are not available for this indicator.
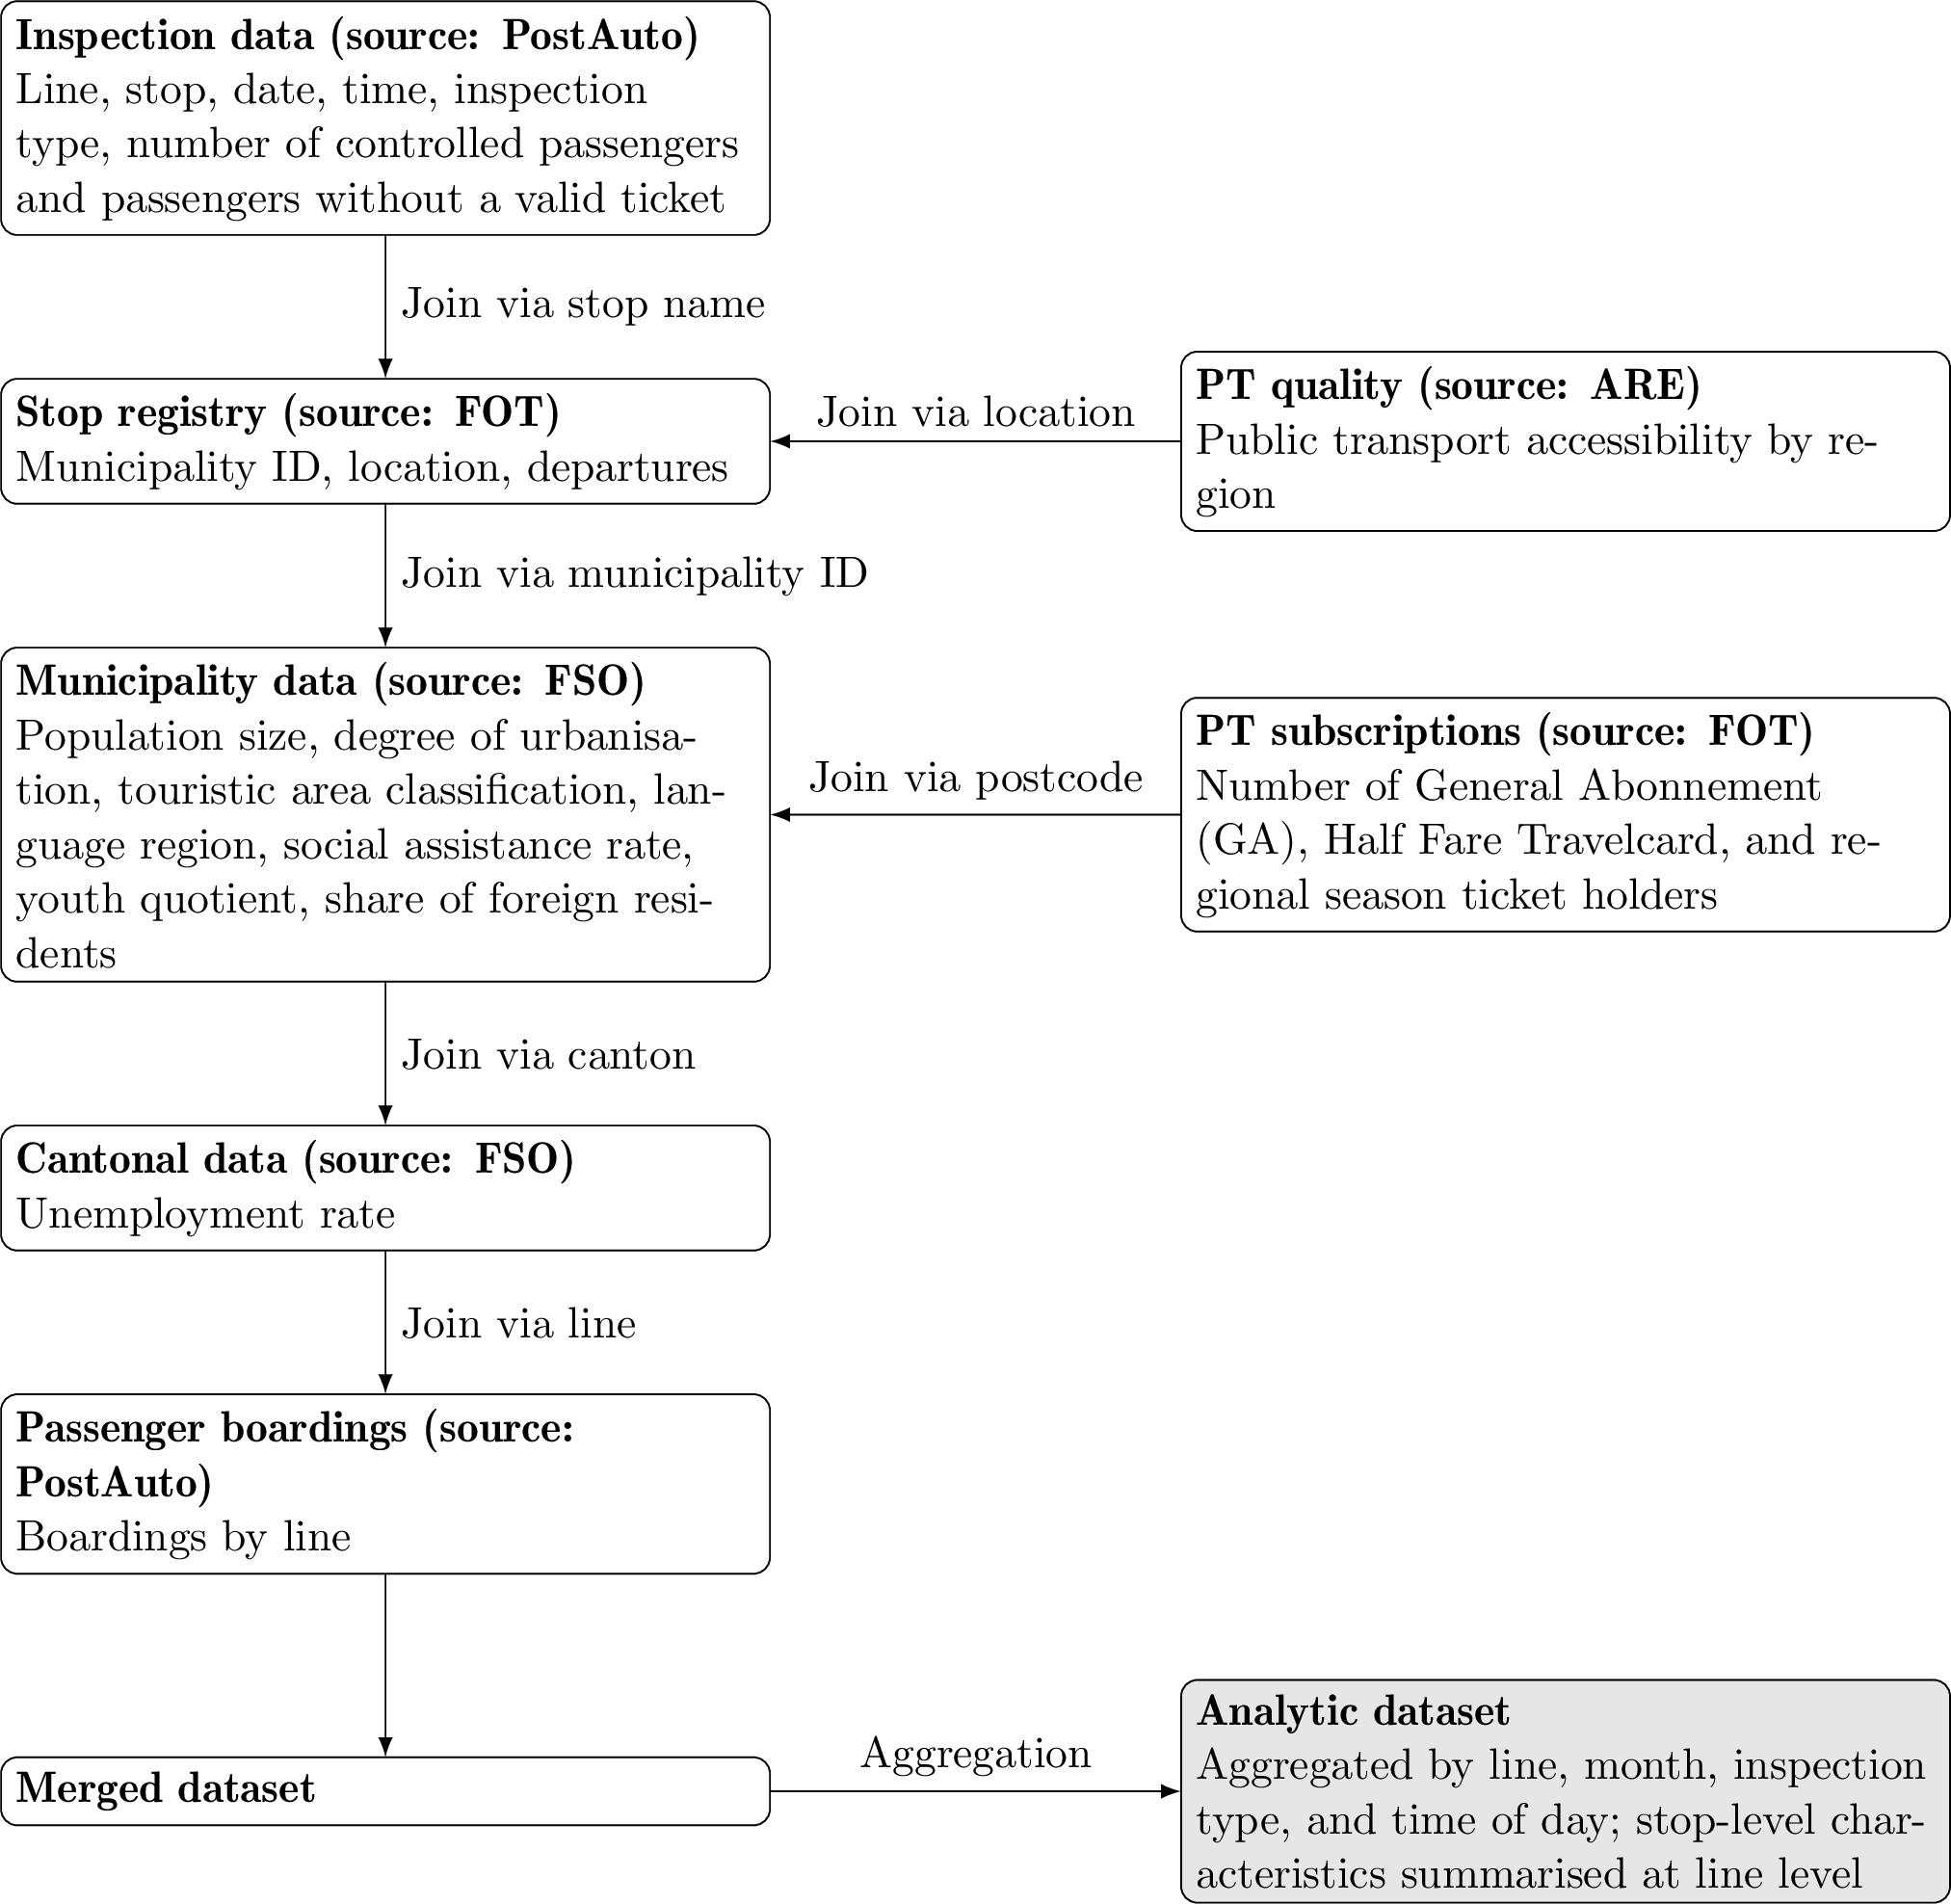
The (final) analytic dataset is constructed in two steps. First, for each municipality- and stop-level characteristic, we compute summary statistics (namely the mean, median, minimum, maximum, and interquartile range) across all stops belonging to a given line, thereby obtaining line-level contextual characteristics. Second, we aggregate the inspection records by line, month, inspection type, and time of day, summing total inspection time and the number of detected fare evaders to construct the outcome variable.
5 Identification and estimation↩︎
Our empirical strategy proceeds in two steps. First, we apply causal machine learning to estimate the causal effect of plainclothes versus uniformed inspections on inspection efficiency, and to examine whether this effect varies systematically across contextual characteristics. Second, we use optimal policy learning to determine the inspection strategy that maximises inspection efficiency for a given context. Both steps are discussed in the following.
5.1 Causal machine learning↩︎
We use causal machine learning to estimate the causal effect of inspection strategy on inspection efficiency, and to examine whether this effect varies systematically across contextual characteristics. Specifically, \(D\) denotes the binary treatment variable, where \(D = 1\) indicates a uniformed inspection (Präsenzkontrolle) and \(D = 0\) indicates a plainclothes inspection (Normalkontrolle). Note that our analysis is conditional on inspections being carried out, meaning that observations without any inspection activity are not included in the sample, and our findings therefore do not generalise to contexts in which no inspection activity takes place. The outcome variable \(Y\) captures inspection efficiency, defined as the number of detected fare evaders per unit of inspection time.
Let \(Y(1)\) and \(Y(0)\) denote the potential outcomes under uniformed and plainclothes inspections, respectively. The average treatment effect (ATE), \[\tau = \mathbb{E}[Y(1) - Y(0)],\] captures the average effect of uniformed relative to plainclothes inspections across all observations. The conditional average treatment effect (CATE), \[\tau(x) = \mathbb{E}[Y(1) - Y(0) \mid X = x],\] extends this by capturing how the effect varies across contextual characteristics \(X\). The ATE corresponds to the average of the CATE over the distribution of \(X\), i.e., \(\tau = \mathbb{E}[\tau(X)]\). To examine treatment effect heterogeneity, we further estimate the Sorted Group Average Treatment Effects (GATES), which quantify the average CATE across \(K\) groups ranked by their estimated CATE and test whether these group-specific averages differ significantly from one another.21 Formally, we can present the GATEs as \[\gamma_k = \mathbb{E}[\tau(X) \mid G_k], \quad k = 1, \ldots, K,\] where \(G_k\) denotes the \(k\)-th group ranked by the estimated CATE \(\hat{\tau}(x)\), also the so-called heterogeneity score. Put simple, observations are sorted from those for whom uniformed inspections are least effective (G1) to those for whom they are most effective (G5), based on the estimated CATE. Note that the GATEs do not identify which contextual characteristics drive this heterogeneity, therefore we apply the Best Linear Predictor (BLP) [29], which tests whether the CATE differs systematically across contextual characteristics. Following [29], the BLP is implemented by (i) plugging the causal forest predictions into doubly robust scores and (ii) linearly regressing these doubly robust scores on a pre-selected set of contextual characteristics.
The interpretation of our results rests on two assumptions.
Assumption 1 (Conditional Independence of Treatment): Assumption 1 holds if, conditional on observed covariates \(X\), the inspection strategy \(D\) is independent of potential outcomes. This requires that all factors jointly affecting the choice of inspection strategy and inspection outcomes are observed and included in \(X\). Formally, \[Y(1), Y(0) \perp D \mid X.\]
We argue that Assumption 1 is plausible in our setting, based on information provided by PostAuto. Both the decisions of planners and individual inspectors are partly guided by prior inspection results, which are likely correlated with the determinants of fare evasion. The latter is relevant because inspectors often have discretion over their route after completing an inspection. To account for this, we control for prior inspection activity in the same time slot and overall in the preceding month, as well as for the determinants of fare evasion discussed in Section 3.1. Second, coordinated inspections constitute a specific inspection format in which multiple inspectors simultaneously cover all entry and exit points of a vehicle, effectively eliminating passengers’ ability to avoid inspection. These inspections are often conducted in uniformed mode and tend to occur at locations where multiple lines can be controlled simultaneously, i.e., where public transport accessibility is higher. Importantly, inspectors participating in coordinated operations often subsequently conduct individual inspections without changing into plainclothes attire, which further increases the share of uniformed inspections in high-accessibility locations. By controlling for public transport accessibility, we further address the possibility that the spatial distribution of coordinated inspections confounds the treatment assignment. (Note that as coordinated inspections differ systematically from standard inspections, we exclude them from the main analysis and revisit them in Section 7 and Table 8.)
Assumption 2 (Common Support): Assumption 2 requires that, for all \(x\) in the support of \(X\), both inspection strategies have a strictly positive probability of being assigned — or in other words, substantial overlap in covariates between the treated and control group. Formally, \[0 < \mathbb{P}(D = 1 \mid X = x) < 1.\] The conditional treatment probability \(\mathbb{P}(D = 1 \mid X = x)\) is also referred to as the propensity score. Under Assumptions 1 and 2, the CATE \(\tau(x)\) is identified for all \(x\) in the support of \(X\).
We apply the causal forest (CF) approach by [30] and [9] to estimate the ATE and CATE. By growing many trees, the causal forest extends the random forest algorithm to the estimation of heterogeneous treatment effects by recursively partitioning
the covariate space \(X\) into subgroups with similar treatment effects, rather than similar outcomes. To avoid overfitting, the algorithm relies on honesty, meaning that separate subsamples are used for determining the
tree structure and for estimating treatment effects within leaves. The CATE \(\hat{\tau}(x)\) is then obtained by averaging the local treatment effect estimates across all trees. To examine treatment effect heterogeneity
across a pre-selected set of contextual characteristics, we estimate the Best Linear Predictor (BLP) of the CATE on these covariates [10].
We further estimate the GATEs to quantify average treatment effects across groups ranked by their estimated CATE. All estimates are obtained using the grf package by [31] and the GenericML package by [32] for the statistical
software R.
5.2 Optimal policy learning↩︎
Although the causal forest results reveal that plainclothes inspections are, on average, more effective than uniformed inspections, there may nonetheless exist contexts in which uniformed inspections are preferable. Optimal policy learning [11] goes beyond effect estimation by directly targeting optimal decision-making: rather than asking what is the effect of a given inspection strategy, it asks which inspection strategy should be assigned to a given context to maximise inspection efficiency. The approach aims to optimally allocate an intervention across subgroups based on the size of their individualized effects, taking into account observed contextual characteristics \(X\).
Formally, we seek a policy function \(\pi: \mathcal{X} \rightarrow \{0, 1\}\) that maps contextual characteristics \(X\) to an inspection strategy, where \(\pi(x) = 1\) indicates that uniformed inspections are recommended and \(\pi(x) = 0\) indicates that plainclothes inspections are recommended. The optimal policy maximises the expected inspection efficiency, \[\pi^* = \arg\max_{\pi} \mathbb{E}[Y(\pi(X))],\] where \(Y(\pi(X))\) denotes the potential outcome under the strategy assigned by \(\pi\). To estimate \(\pi^*\), we follow [12] and apply a policy tree, which is a shallow decision tree that partitions the covariate space into regions and assigns an inspection strategy to each region. The complexity of the optimal allocation rule is regulated by the maximum number of leaves, which determines how many distinct segments with potentially different inspection strategies are considered. In our application, we set the maximum number of leaves to four, yielding at most four distinct contexts with potentially different inspection strategy recommendations.
The policy tree is fitted using doubly robust scores obtained from the causal forest, which provide an approximately unbiased signal of the individual treatment effect and thereby allow for valid inference on the optimal policy.22 To ensure interpretability for practitioners, we train the causal forest on the full set of covariates \(X\) but restrict the policy tree to a
pre-selected set of binary contextual characteristics that are (easier) actionable and easy to communicate. All estimates are obtained using the policytree package by [33] for the statistical software R.
6 sec:Results↩︎
6.1 Descriptive analysis↩︎

The average inspection efficiency amounts to 0.67 incidents per hour (SD = 1.03). Figure 2 and Table 2 present the distribution of inspection efficiency and selected covariate means by inspection strategy for the analytic sample. As shown in Figure 2, the distribution is right-skewed for both inspection strategies, with the majority of inspections yielding zero or near-zero detections.
Plainclothes inspections yield a higher average inspection efficiency (0.69 incidents per hour) compared to uniformed inspections (0.46 incidents per hour), providing a first descriptive indication that plainclothes inspections may be more effective at detecting fare evaders. Lines assigned uniformed inspections tend to have larger populations (16,049 vs.,560 inhabitants), higher GA ownership rates (0.07 vs.), and higher half-fare card ownership rates (0.49 vs.), suggesting that uniformed inspections are more frequently conducted on lines serving urban areas with (slightly) lower unemployment rates. The share of foreign residents is somewhat lower for uniformed inspections (0.17 vs.), while PT accessibility, social assistance rates, and youth dependency ratios are broadly similar across both strategies. Regarding prior inspection activity, lines assigned uniformed inspections show somewhat higher total inspection hours (both plainclothes and uniform) in the prior month (25.4 vs. hours) as well as higher inspection hours in the same time slot (4.24 vs. hours), suggesting that uniformed inspections tend to be deployed on lines with a higher baseline level of inspection activity. Standardised differences indicate meaningful imbalance (\({|d| > 0.1}\)) for all variables except inspection hours in the same time slot (see Table 2). These raw differences, however, do not account for confounding factors, which motivates the causal machine learning approach presented in Section 5.
| Plainclothes | Uniformed | ||||
|---|---|---|---|---|---|
| 2-3 (lr)4-5 Variable | Mean | SD | Mean | SD | Std. diff. |
| Outcome | |||||
| Inspection efficiency (incidents per hour) | 0.69 | 1.02 | 0.46 | 0.89 | 0.243 |
| Sociodemographic characteristics | |||||
| Population | 12,560 | 19,775 | 16,049 | 25,601 | \(-\)0.153 |
| Share of foreign population | 0.22 | 0.07 | 0.17 | 0.06 | 0.782 |
| Youth dependency ratio | 0.33 | 0.04 | 0.32 | 0.03 | 0.356 |
| Social assistance rate | 0.02 | 0.01 | 0.02 | 0.01 | \(-\)0.157 |
| Unemployment rate | 0.03 | 0.01 | 0.02 | 0.00 | 0.780 |
| Public transport characteristics | |||||
| GA ownership rate | 0.05 | 0.06 | 0.07 | 0.11 | \(-\)0.275 |
| Half-fare card ownership rate | 0.39 | 0.33 | 0.49 | 0.63 | \(-\)0.217 |
| PT accessibility (class A) | 0.10 | 0.11 | 0.13 | 0.16 | \(-\)0.224 |
| Prior inspection activity | |||||
| Inspection hours (same time slot, prior month) | 3.63 | 5.83 | 4.24 | 7.24 | \(-\)0.092 |
| Inspection hours (total, prior month) | 21.3 | 26.8 | 25.4 | 32.4 | \(-\)0.139 |
| Observations | 20,176 | 1,551 | |||
Notes: Inspection efficiency is measured as incidents per hour. Covariates are line-level averages constructed from stop-level information. Prior inspection activity refers to the total inspection hours recorded in the previous month, either across all time slots or restricted to the same time slot as the current observation. Day time variables (commute evening, evening) are omitted as both groups show zero variation. SD denotes standard deviation. We use the standardized difference to assess imbalance [34], interpreting values of \(|d| > 0.1\) as indicative of imbalance.
6.2 Causal machine learning↩︎
6.2.1 Average treatment effect↩︎
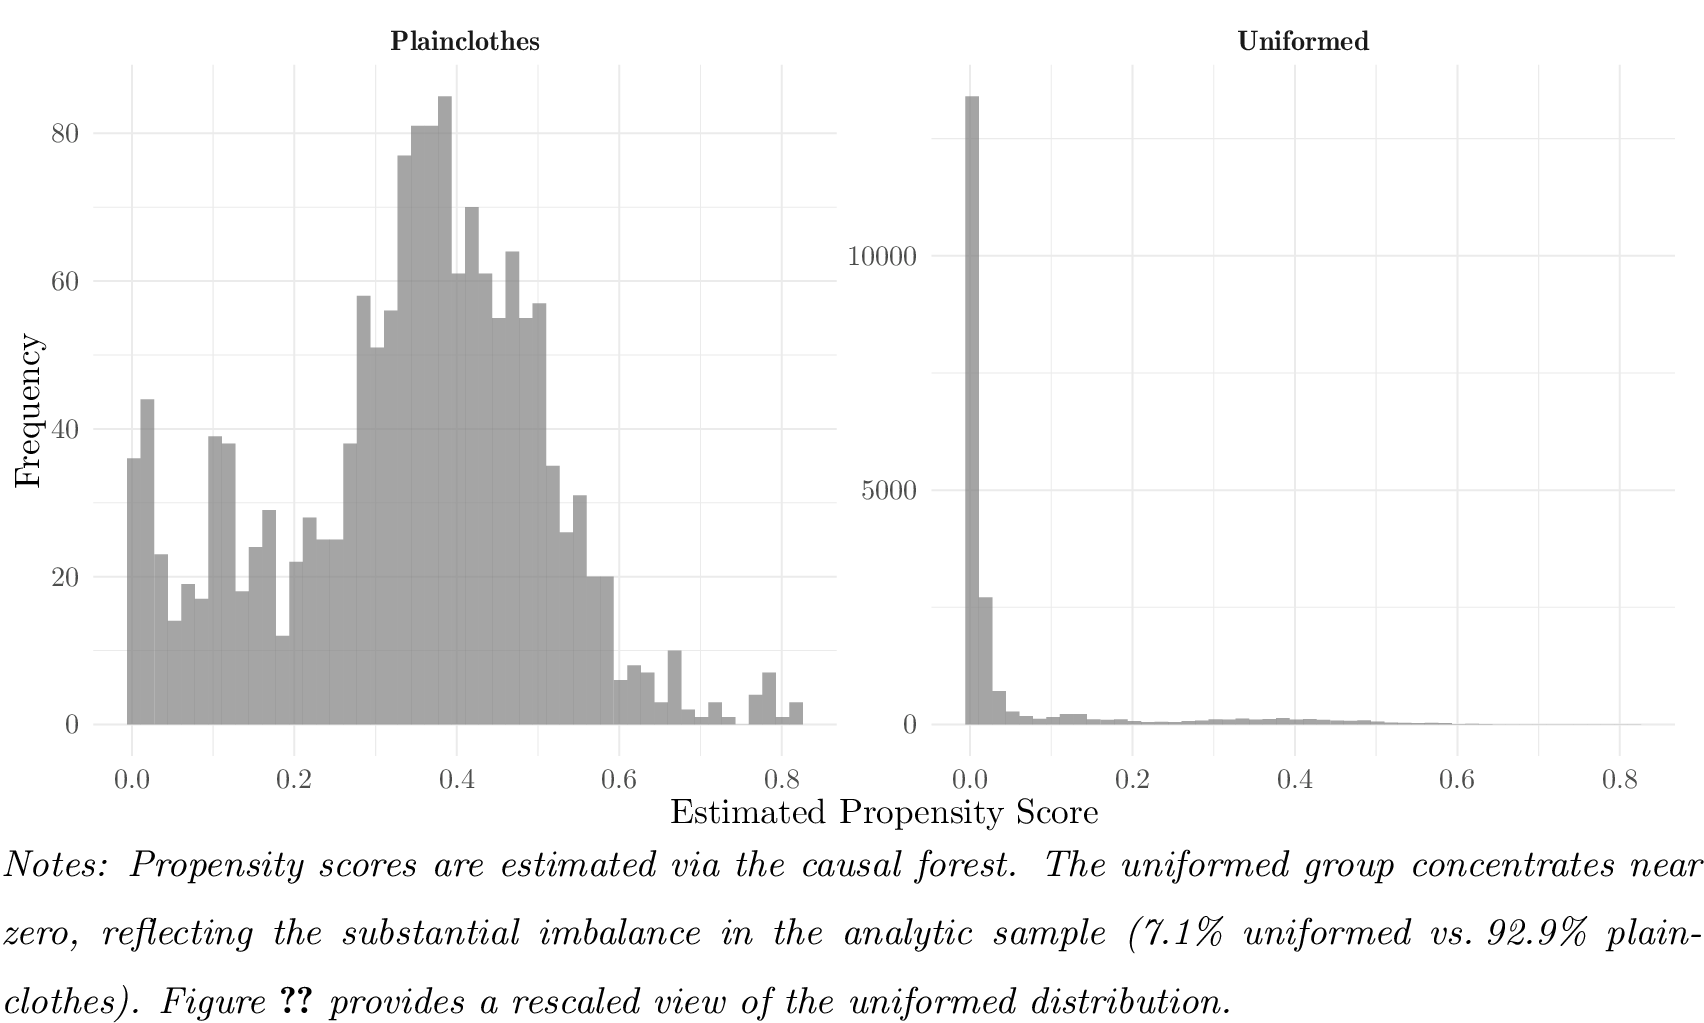
Table 3 reports the estimated average treatment effect (ATE) of uniformed relative to plainclothes inspections on inspection efficiency. Given the substantial imbalance between inspection strategies in the analytic sample (7.1% uniformed vs.% plainclothes), we use the overlap target sample as our main specification, which upweights observations with propensity scores close to 0.5 and thereby reduces sensitivity to regions of limited common support (see Figure 5 in the Appendix).23 The causal forest yields an ATE of \(-\)0.173 incidents per hour (SE = 0.028, \(p < 0.001\)), indicating that uniformed inspections detect, on average, 0.17 fewer fare evaders per inspection hour compared to plainclothes inspections. This effect is statistically significant at the 1% level and economically meaningful: given that the sample average inspection efficiency amounts to 0.67 incidents per hour, it implies a relative reduction of approximately 26%. In summary, the results suggest that, on average, plainclothes inspections are more effective at detecting fare evaders than uniformed inspections. In the following subsection, we examine whether this average effect masks systematic heterogeneity across contextual characteristics.
| Estimate | Std. Error | \(p\)-value | |
|---|---|---|---|
| Causal Forest (overlap) | \(-\)0.173 | 0.028 | \(<\)0.001 |
| Number of observations | 21,727 | ||

6.2.2 Treatment effect heterogeneity↩︎
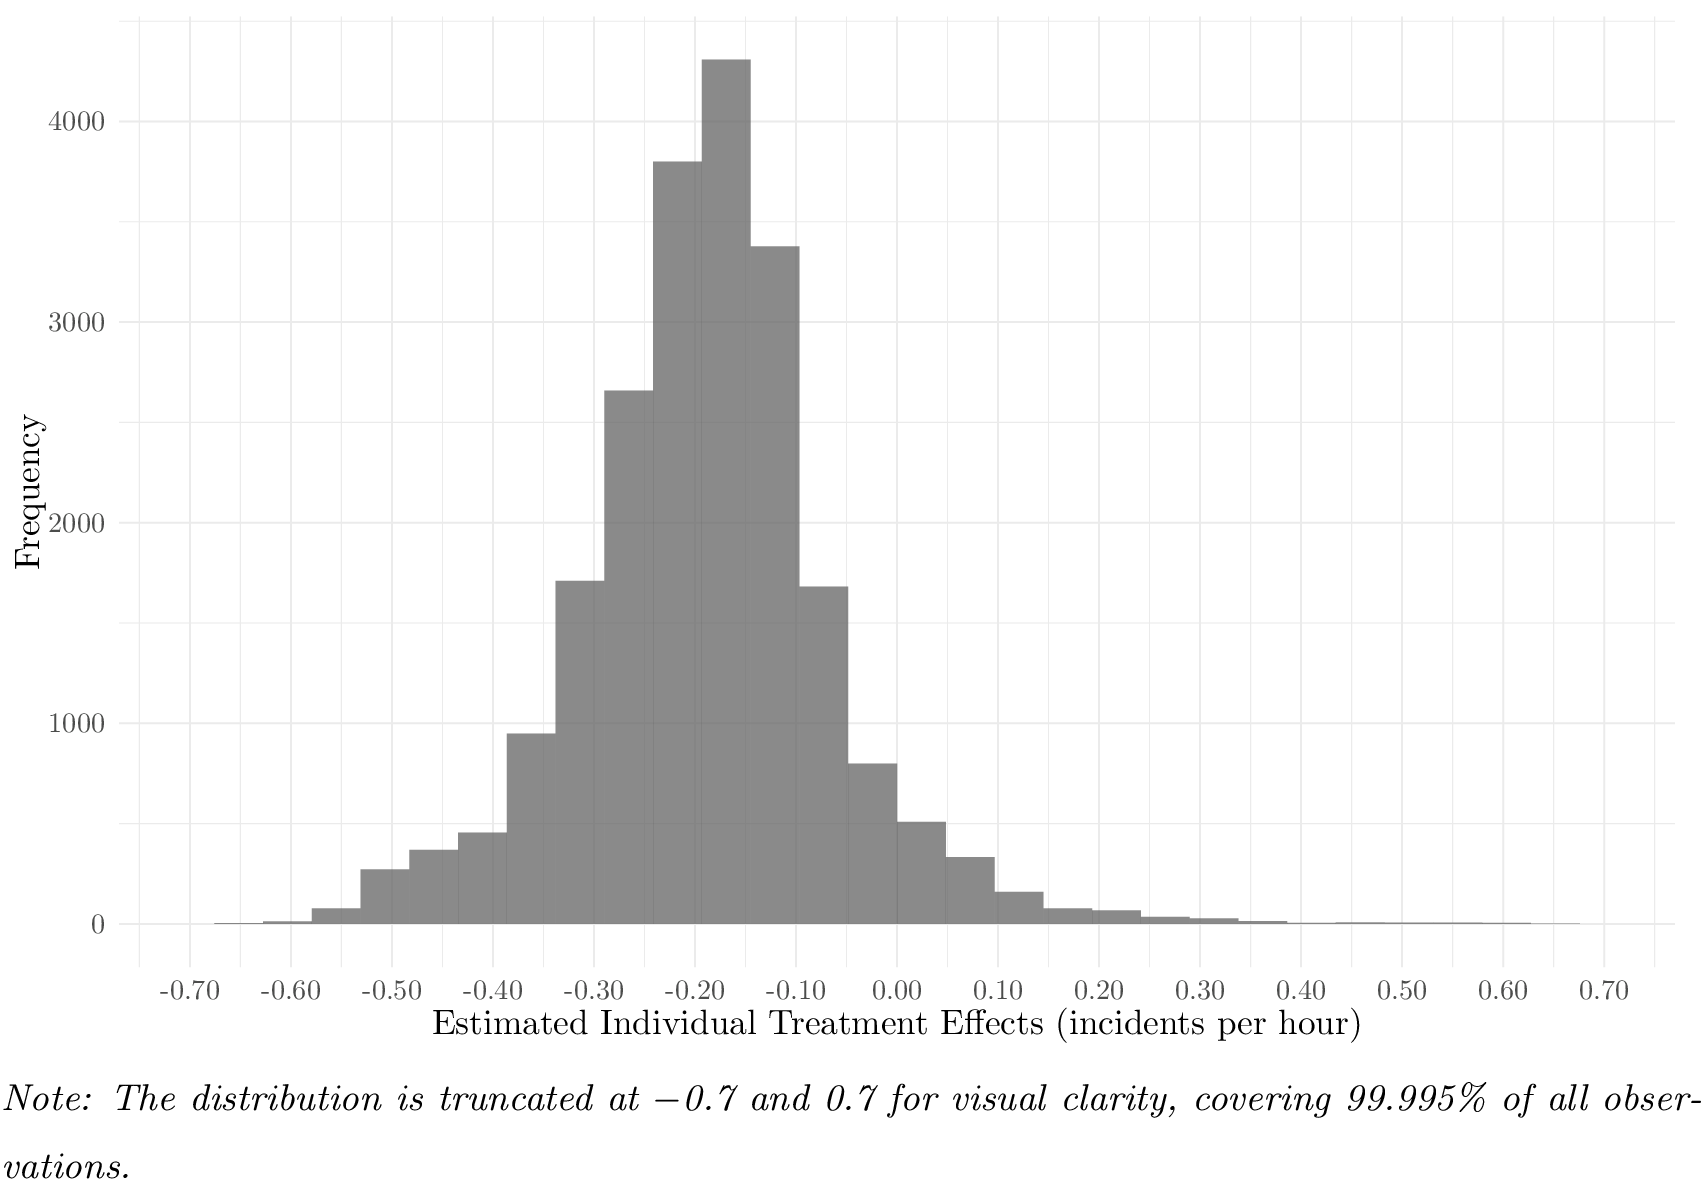
Figure 3 presents the distribution of the estimated CATEs \(\hat{\tau}(x)\) across all observations in the analytic sample. The distribution is centred around the negative ATE of \(-\)0.173 incidents per hour reported in Table 3, with the majority of estimated CATEs being negative. A non-negligible share of observations displays positive estimated CATEs, suggesting that uniformed inspections may outperform plainclothes inspections in certain contexts. However, estimated CATE distributions may appear dispersed even under homogeneous true effects due to estimation uncertainty [35], and the observed variation should therefore not be interpreted as evidence of substantial treatment effect heterogeneity per se.
Next, we assess which contextual characteristics are most strongly associated with treatment effect heterogeneity. Table 4 reports the ten most important predictors of the estimated CATE \(\hat{\tau}(x)\), based on the variable importance measure of the causal forest. This measure captures how frequently a variable is used for splitting across all trees in the forest, weighted by the depth at which the split occurs, such that splits higher up in the tree receive greater weight. The resulting scores are normalised to sum to one [9].
Population size (75th percentile) emerges as the most important predictor, followed by GA ownership rates (25th percentile and median) and the share of foreign residents (maximum). Unemployment rate and total prior inspection hours also appear among the top predictors, alongside half-fare card ownership and inspection hours in the same time slot. Overall, the results suggest that line-level demand potential (proxied by population size and public transport subscription rates) are the primary drivers of heterogeneity in the effect of uniformed relative to plainclothes inspections on inspection efficiency, while prior inspection activity plays a comparatively minor role (given the other information available in the data).
| Variable | Importance |
|---|---|
| Population (p75) | 0.070 |
| GA ownership (p25) | 0.068 |
| GA ownership (median) | 0.063 |
| Share of foreign population (max) | 0.047 |
| Unemployment rate (mean) | 0.045 |
| Inspection hours, total (prior month) | 0.041 |
| Half-fare card ownership (p75) | 0.039 |
| GA ownership (p75) | 0.036 |
| GA ownership (min) | 0.035 |
| Inspection hours, same time slot (prior month) | 0.026 |

We further investigate treatment effect heterogeneity across a pre-selected set of contextual characteristics that are theoretically motivated by the fare evasion literature. Specifically, we include population size as a proxy for line-level demand potential, GA ownership rate as an indicator of the socioeconomic composition of passengers and their likelihood of holding a valid ticket and associated with non-occasional public transport use, the share of foreign residents as a sociodemographic characteristic,24 and total prior inspection hours as well as inspection hours in the same time slot in the prior month as measures of baseline inspection activity that may affect the perceived probability of being controlled (see also Section 3).
Table 5 reports the Best Linear Predictor (BLP) estimates. None of the pre-selected covariates are statistically significant at conventional levels, suggesting that the effect of uniformed relative to plainclothes inspections on inspection efficiency does not vary systematically across the observed contextual characteristics included in the analysis. Overall, the BLP results are consistent with the negative and largely homogeneous ATE reported in Table 3, reinforcing the conclusion that plainclothes inspections tend to outperform uniformed inspections across a broad range of contextual conditions.
| Estimate | Std. Error | \(p\)-value | |
|---|---|---|---|
| (Intercept) | \(-\)0.001 | 0.078 | 0.994 |
| Population (mean) | \(-\)0.000003 | 0.000002 | 0.109 |
| GA ownership (mean) | \(-\)0.273 | 0.190 | 0.150 |
| Share of foreign population (mean) | \(-\)0.006 | 0.004 | 0.153 |
| Inspection hours, total (prior month) | \(<\)0.001 | 0.002 | 0.858 |
| Inspection hours, same slot (prior month) | \(-\)0.003 | 0.007 | 0.633 |

Table 6 reports the Sorted Group Average Treatment Effects (GATES), where observations are sorted into five groups based on their estimated CATE \(\hat{\tau}(x)\), ranging from the group with the most negative estimated effect (G1) to the group with the least negative estimated effect (G5). Across all five groups, the GATEs are negative, reinforcing the conclusion that uniformed inspections are less efficient than plainclothes inspections regardless of context. The most affected group (G1) exhibits a GATE of \(-\)0.263 incidents per hour, while the least affected group (G5) shows a GATE of \(-\)0.060 incidents per hour, which is not statistically significant different from zero. The difference between G5 and G1 amounts to 0.203 incidents per hour, and a formal test confirms that this difference is statistically significant (\(p = 0.008\)), suggesting some variation in the magnitude of the effect across contexts, though the direction remains consistently negative throughout.
| Estimate | Std. Error | 95% CI | |
|---|---|---|---|
| G1 (most negative) | \(-\)0.263 | 0.060 | [\(-\)0.382, \(-\)0.145] |
| G2 | \(-\)0.309 | 0.077 | [\(-\)0.461, \(-\)0.157] |
| G3 | \(-\)0.203 | 0.083 | [\(-\)0.366, \(-\)0.040] |
| G4 | \(-\)0.142 | 0.065 | [\(-\)0.270, \(-\)0.014] |
| G5 (least negative) | \(-\)0.060 | 0.046 | [\(-\)0.151, \(~~\)0.031] |
| \(\gamma_5 - \gamma_1\) | \(~~\)0.203 | 0.076 |

6.3 Optimal Policy Learning↩︎
The policy tree is estimated in two stages. In the first stage, a causal forest is trained on the full set of covariates to obtain doubly robust scores, which serve as the welfare-relevant outcome for the subsequent policy optimisation. In the second stage, the policy tree is fitted using only a pre-selected set of interpretable binary covariates: i.e., whether population size, GA ownership rate, share of foreign residents, total prior inspection hours, and prior inspection hours in the same time slot each exceed their respective sample medians.
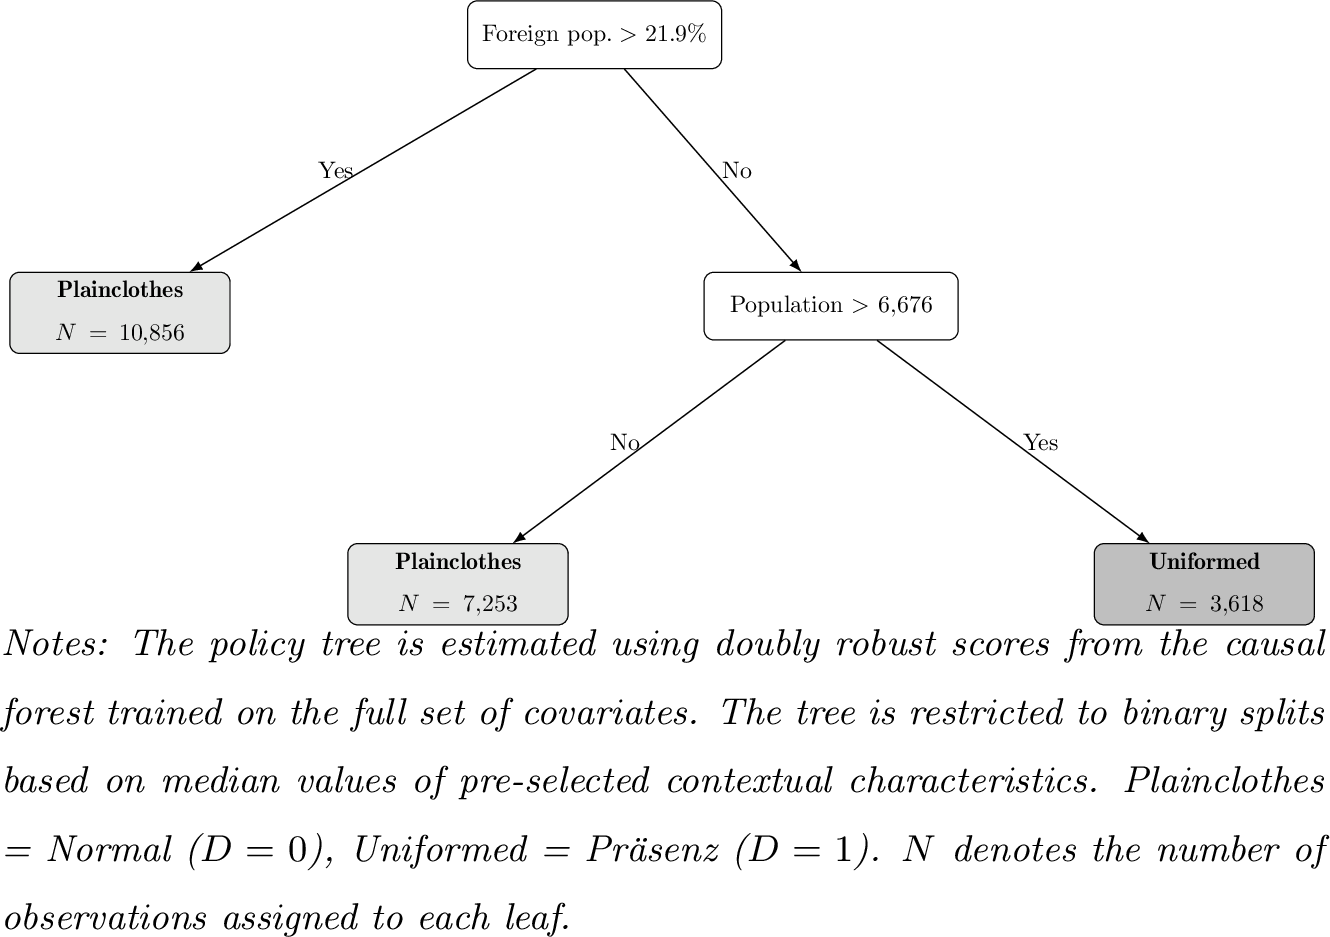
Figure 4 presents the optimal inspection strategy as suggested by the policy tree outlined in Section 5. The first split is based on the share of foreign residents: for lines serving municipalities with a share of foreign residents above the sample median of 21.9%, the tree recommends plainclothes inspections (\(N = 10{,}856\)). For lines below this threshold, the tree further distinguishes based on population size: lines serving municipalities with a population above the sample median of 6,676 inhabitants should be assigned uniformed inspections (\(N = 3{,}618\)), while lines with below-median population size should be assigned plainclothes inspections (\(N = 7{,}253\)).
The optimal policy thus recommends plainclothes inspections for the large majority of observations (18,109 out of 21,727, or 83.3%), with uniformed inspections recommended only for lines characterised by a below-median share of foreign residents and above-median population size. This pattern is broadly consistent with the negative ATE reported in Table 3. The role of the share of foreign residents as the primary splitting variable is noteworthy given the variable importance results in Table 4, and should be interpreted with caution given that this variable may proxy for socioeconomic characteristics more broadly (see Footnote 24).
7 Discussion and Conclusion↩︎
Fare evasion generates substantial economic losses for public transport companies. To enforce fare payment one core instrument is the organisation of inspection teams. One question which arises is whether inspections are conducted by uniformed (visible) or plainclothes (covert) inspectors. In our study, we assessed the differences between these two strategies on inspection efficiency, defined as the number of detected fare evaders per unit of inspection time.
First, we applied causal machine learning to estimate the effect of the binary treatment of uniformed versus plainclothes inspections on inspection efficiency. The causal machine learning analysis yielded two main findings. First, plainclothes inspections were on average significantly more effective at detecting fare evaders than uniformed inspections, with an estimated ATE of \(-\)0.173 incidents per hour, corresponding to a relative reduction of approximately 26% compared to the sample mean. Second, the heterogeneity analysis when estimating the Best Linear Predictor (BLP) of the conditional average treatment effect (CATE) provides little evidence of systematic variation across contextual characteristics. However, GATEs indicate that while the direction of the effect is consistently negative, its magnitude varies across contexts: the most affected group exhibits a GATE of \(-0.263\) incidents per hour, compared to \(-0.060\) in the least affected group. Overall, these findings suggest that the superiority of plainclothes inspections is a robust and pervasive phenomenon across the PostAuto network: while the magnitude of the effect varies across contexts, its direction remains consistent throughout.
Moreover, we applied optimal policy learning to determine the inspection strategy that maximises inspection efficiency across contexts. The results of the policy tree [12] indicated that uniformed inspections are only suggested for lines characterised by a below-median share of foreign residents and above-median population size. As this combination is relatively uncommon in the PostAuto network, the policy tree recommended plainclothes inspections for the large majority of contexts (83.3%) in order to maximise the number of detected fare evaders per unit of inspection time. However, note that the 83.3% refers to the share of observations in the analytic dataset rather than to population size or geographic coverage, meaning that contexts recommended for uniformed inspections may nonetheless account for a substantial share of the population served.
Two limitations of this study warrant mention. First, our findings are conditional on inspections being conducted and therefore do not generalise to contexts in which no inspection activity takes place. Furthermore, the causal identification relies on a selection-on-observables assumption, which (while supported by the institutional context) cannot be directly tested.
The main analysis compares uniformed (Präsenzkontrolle) versus plainclothes (Normalkontrolle) inspections, focusing on the visibility of inspectors as the key dimension of treatment. A complementary perspective concerns not the visibility of inspectors, but whether passengers have the opportunity to evade detection altogether (see Section 2). In certain inspection formats — namely coordinated operations such as Schwerpunktkontrolle, Verstärkte Kontrolle, and Focus-Security Kontrolle — multiple inspectors simultaneously cover all entry and exit points of a vehicle or station, effectively eliminating passengers’ ability to avoid inspection. In contrast, standard inspections (Normalkontrolle and Präsenzkontrolle) are typically conducted by a single inspector or a small team, leaving passengers with the possibility to disembark or move to another carriage before being checked. We therefore define a second treatment variable that captures this distinction: evasion impossible (coordinated inspections) versus evasion possible (standard inspections), and estimate the causal effect of removing passengers’ ability to evade on inspection efficiency.
The estimated average treatment effect of coordinated inspections (evasion impossible) relative to standard inspections (evasion possible) amounts to \(-\)0.053 incidents per hour (SE = 0.027, \(p = 0.051\)), suggesting that coordinated inspections detect marginally fewer fare evaders per inspection hour than standard inspections, though the effect is (only) statistically significant at the 10% level (see Table 8). This finding is not entirely surprising: coordinated operations such as Schwerpunktkontrolle or Verstärkte Kontrolle typically involve multiple inspectors covering all entry and exit points simultaneously, which implies that total inspection time—including waiting and coordination time across all deployed staff—is substantially higher than for standard inspections. Since inspection efficiency is defined as detected fare evaders per total inspection hour, the denominator is mechanically larger for coordinated operations, which may offset any gains in detection rates. The result should therefore be interpreted with caution and does not necessarily imply that coordinated inspections are less effective at deterring fare evasion overall.
Finally, future research might assess the deterrent effect of uniformed versus plainclothes inspections. While our study focuses on inspection efficiency, a lower efficiency of uniformed inspections does not necessarily imply that they are inferior from a broader welfare perspective. Uniformed inspections may deter fare evasion through increased visibility, inducing passengers to purchase a valid ticket or refrain from boarding altogether, and may additionally contribute to passengers’ perceived sense of security. In this case, a lower detection rate would reflect successful deterrence rather than inefficiency. Moreover, future research should apply our approach to other operators — such as urban transport companies or rail operators — to examine whether our findings generalise beyond the regional bus context of PostAuto.
Appendices
8 Additional Figures↩︎
9 Additional Tables↩︎
| Estimate | Std. Error | \(p\)-value | |
|---|---|---|---|
| Causal Forest (treated) | \(-\)0.173 | 0.031 | \(<\)0.001 |
| Number of observations | 21,727 | ||

| Estimate | Std. Error | \(p\)-value | |
|---|---|---|---|
| Causal Forest (overlap) | \(-\)0.051 | 0.028 | 0.072 |
| Causal Forest (treated) | \(-\)0.053 | 0.027 | 0.051 |
References↩︎
All figures in this paragraph are based on https://www.allianceswisspass.ch/de/asp/News/Newsmeldung?filterCategory=4-20&newsid=997, accessed on February 25, 2026.↩︎
See https://reporting.sbb.ch/en/finance, accessed on February 25, 2026.↩︎
See https://reporting.sbb.ch/en/finance, accessed on February 25, 2026.↩︎
All figures in this paragraph, unless otherwise stated, are based on https://www.allianceswisspass.ch/de/asp/News/Newsmeldung?filterCategory=4-20&newsid=997, accessed on February 25, 2026.↩︎
See https://www.srf.ch/news/schweiz/ohne-billett-unterwegs-starker-anstieg-bei-den-erwischten-schwarzfahrern, accessed on February 25, 2026.↩︎
For all figures, see https://www.postauto.ch/en/about-us-and-news/organization/facts-and-figures, accessed on May 18, 2026.↩︎
Time of day is categorised into seven slots: morning, morning commute, midday, afternoon, evening commute, evening, and night.↩︎
https://data.opentransportdata.swiss/dataset/timetable-2026-gtfs2020, accessed on May 29, 2026.↩︎
https://www.swisstopo.admin.ch/de/landschaftsmodell-swissboundaries3d, accessed on May 29, 2026.↩︎
https://mapexplorer.bfs.admin.ch/?obs=main&lang=de#c=indicator&i=ch_01_02_01a.staendigepop&s=2024&view=map179, accessed on May 29, 2026.↩︎
https://www.agvchapp.bfs.admin.ch/de/boundaries?SnapshotDate=01.01.2026&Unit=GDETYP2020, accessed on May 29, 2026.↩︎
https://www.bfs.admin.ch/bfs/de/home/statistiken/kataloge-datenbanken.assetdetail.36217024.html, accessed on May 29, 2026. Note that this variable does not originate from the literature. However, it may also serve as a proxy for occasional passengers.↩︎
https://www.bfs.admin.ch/bfs/de/home/statistiken/regionalstatistik/kartengrundlagen/basisgeometrien.assetdetail.33807959.html, accessed on May 29, 2026.↩︎
https://mapexplorer.bfs.admin.ch/?obs=main&lang=de#c=indicator&view=map164, accessed on May 29, 2026.↩︎
https://data.opentransportdata.swiss/dataset/ga-hta-liste1, accessed on May 29, 2026.↩︎
https://data.opentransportdata.swiss/dataset/verbundsabos, accessed on May 29, 2026.↩︎
https://data.geo.admin.ch/browser/index.html#/collections/ch.are.gueteklassen_oev?.language=de-CH, accessed on May 29, 2026.↩︎
https://mapexplorer.bfs.admin.ch/?obs=main&lang=de#c=indicator&view=map164, accessed on May 29, 2026.↩︎
Alternatively, GATEs can be estimated for theoretically motivated subgroups defined by specific covariates (e.g., population size, GA ownership, or prior inspection activity), which may yield more directly interpretable results for operational decision-making. For an application of this approach, see [28].↩︎
Note that doubly robust scores are obtained via
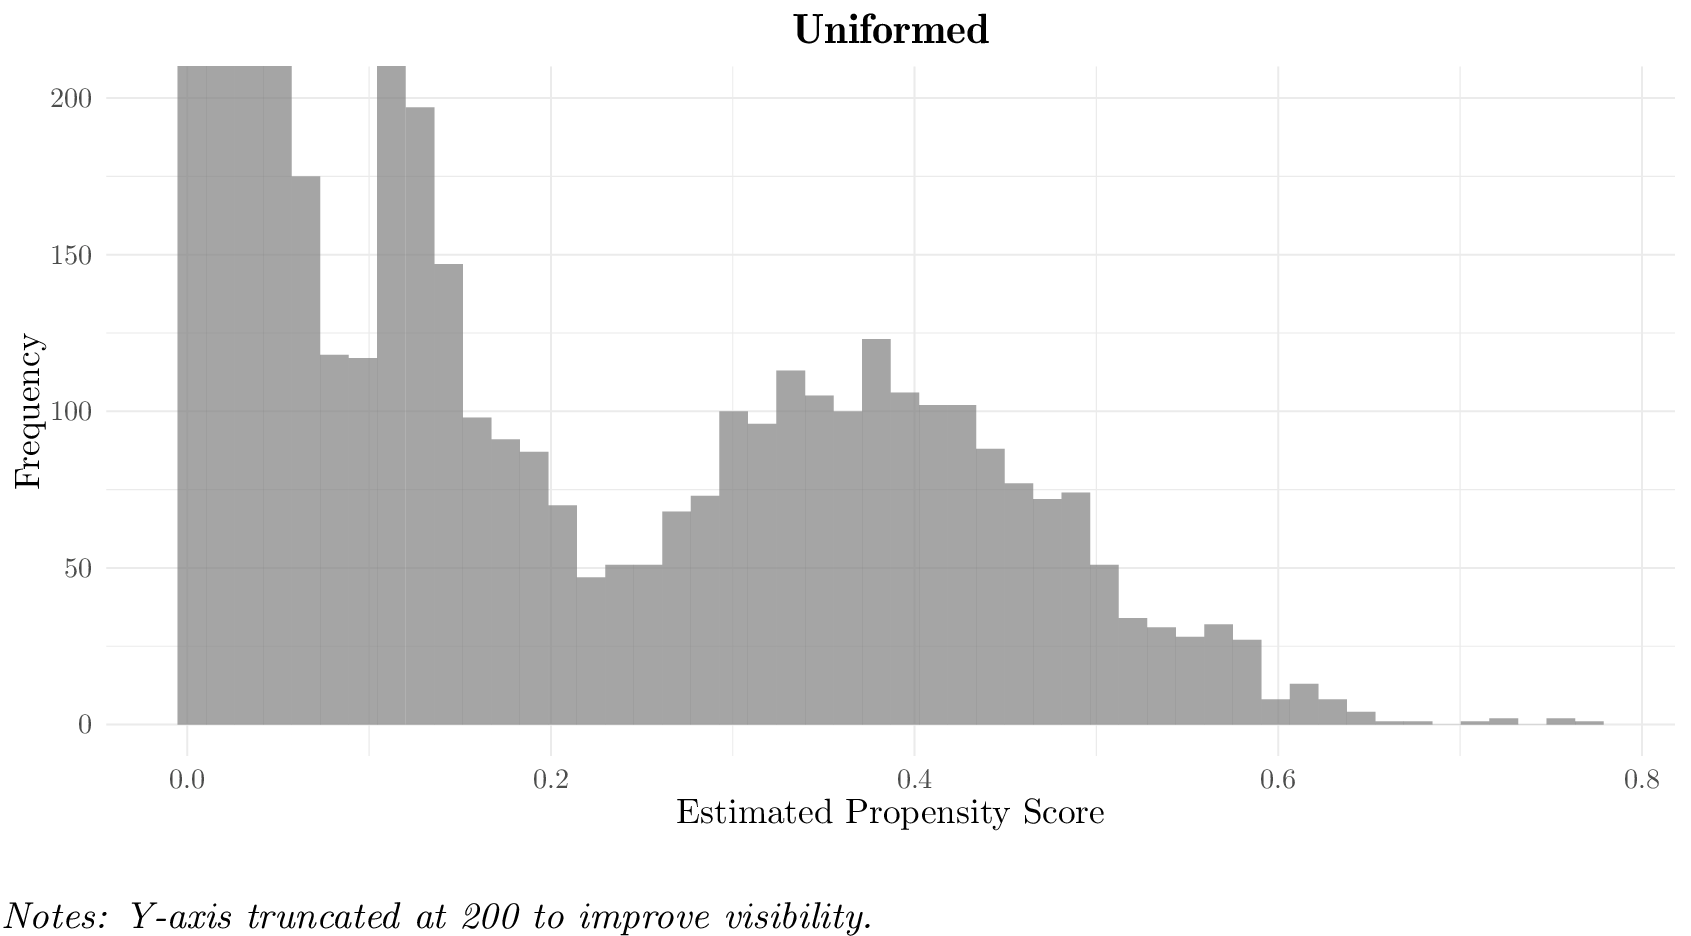
get_scores()applied to the binary causal forest [9], rather than viadouble_robust_scores()from a multi-arm causal forest, as the latter produced degenerate scores due to the extreme treatment imbalance in the analytic sample (7.1% uniformed vs.% plainclothes).↩︎The distribution of estimated propensity scores reported in Figures 5 and 6 reveals that the vast majority of uniformed inspections are concentrated near zero, reflecting the strong imbalance in the analytic sample. Nevertheless, a non-trivial share of uniformed observations exhibit propensity scores in the intermediate range, (potentially) providing sufficient overlap for identification. This should be kept in mind when interpreting the results under Assumption 2 (Common Support).↩︎
The share of foreign residents likely captures more than just migration status per se, but also proxies for socioeconomic status and other sociodemographic characteristics that tend to correlate with nationality at the line level. Moreover, to the extent that inspection strategies differ in their visibility, the share of foreign residents may also reflect potential inspector bias: [36] provide field experimental evidence from public buses in Australia that minority customers receive systematically less favourable treatment from bus drivers, suggesting that the race or perceived origin of passengers may influence inspector behaviour independently of actual fare evasion propensity.↩︎