Beyond Medical Diagnostics: How Medical Multimodal Large Language Models Think in Space
March 14, 2026
Abstract
Visual spatial intelligence is critical for medical image interpretation, yet remains largely unexplored in Multimodal Large Language Models (MLLMs) for 3D imaging. This gap persists due to a systemic lack of datasets featuring structured 3D spatial annotations beyond basic labels. In this study, we introduce an agentic pipeline that autonomously synthesizes spatial visual question-answering (VQA) data by orchestrating computational tools such as volume and distance calculators with multi-agent collaboration and expert radiologist validation. We present SpatialMed, the first comprehensive benchmark for evaluating 3D spatial intelligence in medical MLLMs, comprising nearly 10K question-answer pairs across multiple organs and tumor types. Our evaluations on 14 state-of-the-art MLLMs and extensive analyses reveal that current models lack robust spatial reasoning capabilities for medical imaging.
1 Introduction↩︎
Visual-spatial intelligence—the ability to perceive, reason about, and manipulate spatial relationships—is a cornerstone of clinical radiology. When interpreting computed tomography (CT) scans, for example, radiologists routinely assess tumor dimensions to stage malignancies, estimate organ volumes to evaluate function, and quantify inter-structure distances to plan surgical approaches. These quantitative spatial judgments directly inform treatment decisions: a 3cm margin between a tumor and a major vessel may determine resectability, while a 20% increase in organ volume could indicate disease progression.
Multimodal Large Language Models (MLLMs) have demonstrated remarkable progress in visual understanding, achieving strong performance on tasks ranging from image captioning to visual question answering in natural scenes [1]–[4]. Recent work has extended MLLMs to 2D spatial reasoning, enabling models to describe object positions, compare sizes, and reason about spatial relationships in photographs. However, current research remains restricted to diagnostic classification [5]–[10], anatomical segmentation [11]–[14], and report generation [15]–[19], leaving quantitative visual-spatial reasoning under-explored. To our knowledge, no existing work systematically evaluates an MLLM’s ability to compute inter-structure distances or estimate volumetric magnitude, both of which are foundational for surgical robotics and AI-assisted diagnostics.
| Dataset | CT Scans | QA Pairs | Spatial QA | Quantitative | 3D Relation | Grounded QA | Benchmark | Task |
|---|---|---|---|---|---|---|---|---|
| RadQA [20] | 0 | 6.1K | Radiology report QA | |||||
| INSPECT [21] | 23,248 | – | Diagnosis | |||||
| M3D VQA [13] | 96,170 | 509K | Diagnosis | |||||
| CT-CHAT [15] | 25,692 | 2.7M | Diagnosis | |||||
| CT-RATE [22] | 25,692 | – | ✔ | Abnormality Detection, Report Generation | ||||
| BIMCV-R [23] | 8,069 | – | ✔ | Text–Image Retrieval | ||||
| 3D-RAD [24] | 16,188 | 136K | ✔ | Diagnosis | ||||
| ReXGroundingCT [14] | 3,142 | – | ✔ | ✔ | Referring Segmentation | |||
| AbdomenAtlas 3.0 [19] | 9,262 | – | ✔ | ✔ | ✔ | Report Generation, Tumor Segmentation | ||
| RadGenome-Chest CT [25] | 25,692 | 1.2M | ✔ | ✔ | ✔ | ✔ | Report Generation, Segmentation QA | |
| RadImageNet-VQA (CT subset) [26] | 750K | 6.75M | ✔ | Diagnosis | ||||
| SpatialMed (Ours) | 2375 | 9.8K | ✔ | ✔ | ✔ | ✔ | ✔ | Spatial QA, Volume Estimation |
3.2pt
The Data Bottleneck. The primary obstacle to progress is the scarcity of appropriate training and evaluation data. Existing volumetric radiology datasets provide classification labels, narrative reports, or segmentation masks, but they systematically lack the structured spatial annotations necessary for quantitative reasoning: (1) Precise 3D spatial relationships – Relative positions, orientations, and topological adjacencies between anatomical structures and lesions; (2) Inter-structure distances – Euclidean or geodesic measurements between structure centroids, surfaces, or boundaries; (3) Quantitative lesion measurements – Volumes, axis dimensions, and cross-sectional areas. While such information is essential for clinical interpretation, acquiring high-quality spatial annotations is prohibitively expensive. It requires expert radiologists to perform case-by-case 3D localization and measurement with consistent anatomical definitions across heterogeneous patient populations.
Alternative approaches face their own limitations. Mining spatial information from radiology reports proves unreliable: reports are predominantly narrative, weakly structured, and lack the quantitative relationships and coordinate references needed for spatial understanding. They describe findings qualitatively ("mass abutting the portal vein") rather than providing the geometric precision ("center-to-center distance: 2.3cm") required for systematic evaluation.
Our approach. To address this gap, we introduce an agentic pipeline that automatically generates clinically meaningful spatial visual question-answering (VQA) data for CT scans. We focus on CT because it is the most widely utilized 3D diagnostic modality in clinical practice and provides a reliable foundation for evaluating objective spatial reasoning. The pipeline leverages spatial computational tools, including volume calculators, distance calculators, and bounding box extractors, to derive precise spatial information about anatomical structures and tumors from CT scans. Multiple agents with retrieval-augmented generation (RAG) are employed to produce diverse spatial VQA pairs. To ensure clinical validity, three board-certified radiologists review the generated data and provide feedback for quality refinement.
Building upon this pipeline, we present SpatialMed, a comprehensive benchmark comprising around 9.8k question-answer pairs across 2,375 CT scans. The benchmark spans 117 anatomical structures and 8 tumor types across multiple organs, including the kidney, pancreas, liver, lung, prostate, and brain. Questions are categorized into two types: multiple-choice questions and volume estimation. Our extensive evaluation of state-of-the-art MLLMs on SpatialMed reveals substantial limitations in their spatial understanding of CT data. These findings underscore the critical need for targeted advances in endowing MLLMs with robust spatial reasoning capabilities for medical imaging.
In summary, our work makes three primary contributions: (1) We design an agentic pipeline, which leverages three spatial computational tools, multi-agent collaboration and radiologist feedback to automatically generate high-quality spatial VQA data for CT scans; (2) We introduce SpatialMed, the first CT-based benchmark for evaluating MLLMs’ spatial intelligence in medical imaging, comprising 9782 question-answer pairs across 2375 CT scans covering 117 anatomical structures and 8 tumor types; (3) We evaluate 14 MLLMs on SpatialMed, with 12 processing multi-view 2D CT images and 2 processing 3D CT scans, revealing substantial performance gaps that demonstrate existing models lack robust spatial reasoning capabilities for medical imaging.
2 Related Works↩︎
Visual-Spatial Intelligence. Spatial reasoning is a fundamental capability of vision–language models for understanding and reasoning about relationships within physical space. To study this problem, several visual question answering (VQA) benchmarks [27]–[30] have been proposed, which demonstrate strong performance in evaluating spatial reasoning over natural images. However, these benchmarks are limited to the 2D image domain and do not support volumetric data or the medical domain. Recently, PRS-Med [31] was introduced for the medical context to address positional reasoning challenges in medical images, enabling multimodal medical language models to reason about anatomical positions in space. While this represents an important step, spatial reasoning extends beyond positional relationships alone. Attributes such as anatomical size, volume, and inter-organ distance are critical in the medical domain, as they constitute the foundation of human spatial cognition, particularly in clinical and surgical contexts. Moreover, different from the comprehensive restriction of 2D imaging benchmarks, 3D volumetric data, such as CT scans, offer richer spatial cues and enable precise evaluation of spatial relationships across three dimensions.
Motivated by these limitations, we propose SpatialMed, a benchmark dataset designed to evaluate MLLMs on medical spatial reasoning using 3D CT volumetric data. SpatialMed enables fine-grained assessment of spatial concepts, including position, size, volume, and distance, providing more faithful insights into a model’s spatial understanding in real clinical environments. We believe that this benchmark can facilitate the development of spatially aware medical AI agents and advance research toward intelligent clinical decision support and surgical robotics.
Multimodal Large Language Model in the 3D Medical Imaging. MLLMs have recently achieved strong performance in the natural image domain by jointly reasoning over visual and textual inputs. Representative works [1], [3], [4], [32] demonstrate effectiveness across a wide range of multimodal tasks, with Qwen3-VL and InternVL3 explicitly incorporating spatial reasoning and achieving strong results in embodied settings.
In the medical domain, most MLLMs operate on 2D slices or weak volumetric proxies [5], [7]–[9], [33], [34], which limits their ability to capture three-dimensional anatomical structures and perform comprehensive spatial reasoning. Although recent works extend multimodal modeling to 3D medical data [6], [10], [13], [15], [18], they primarily focus on recognition and report generation rather than explicit spatial reasoning.
More critically, existing datasets and benchmarks [18], [22], [25] fail to enforce grounded and faithful reasoning. Most CT report datasets lack voxel-level supervision and precise quantitative targets, allowing models to produce correct answers through textual priors rather than genuine spatial understanding. This leads to pervasive hallucinations and unfaithful reasoning that remain largely undiagnosed. As our intuition, existing grounding efforts [14] or combining segmentation with report structure [35] focus mostly on region retrieval or 2D lesion measurements, and therefore fail to capture organ-level 3D spatial reasoning. These limitations reveal a fundamental gap between the apparent capabilities of medical MLLMs and their actual ability to reason over 3D spatial structures.
To bridge this gap, we introduce SpatialMed, a benchmark designed for grounded and faithful spatial reasoning in 3D CT. SpatialMed systematically evaluates core spatial concepts, including position, distance, size, and volume, through question-answer pairs explicitly grounded in volumetric evidence. By disentangling answer correctness from reasoning faithfulness, SpatialMed provides a principled framework for benchmarking the spatial understanding, advancing the reliability of 3D reasoning in medical MLLMs.
3 Methods: SpatialMed↩︎
3.1 Data Source↩︎
We construct SpatialMed by curating data from multiple large-scale medical imaging datasets: TotalSegmentator [36], AMOS [37], the Medical Segmentation Decathlon [38], KiTS [39], [40], and BraTS [41]–[43]. Our dataset comprises 2,375 3D CT scans with corresponding segmentation masks, covering 117 anatomical structures following the TotalSegmentator taxonomy, as well as seven tumor types: renal tumors, pancreatic cancer, liver tumors, prostate tumors, whole tumors, enhancing tumors, and vessel cancer.
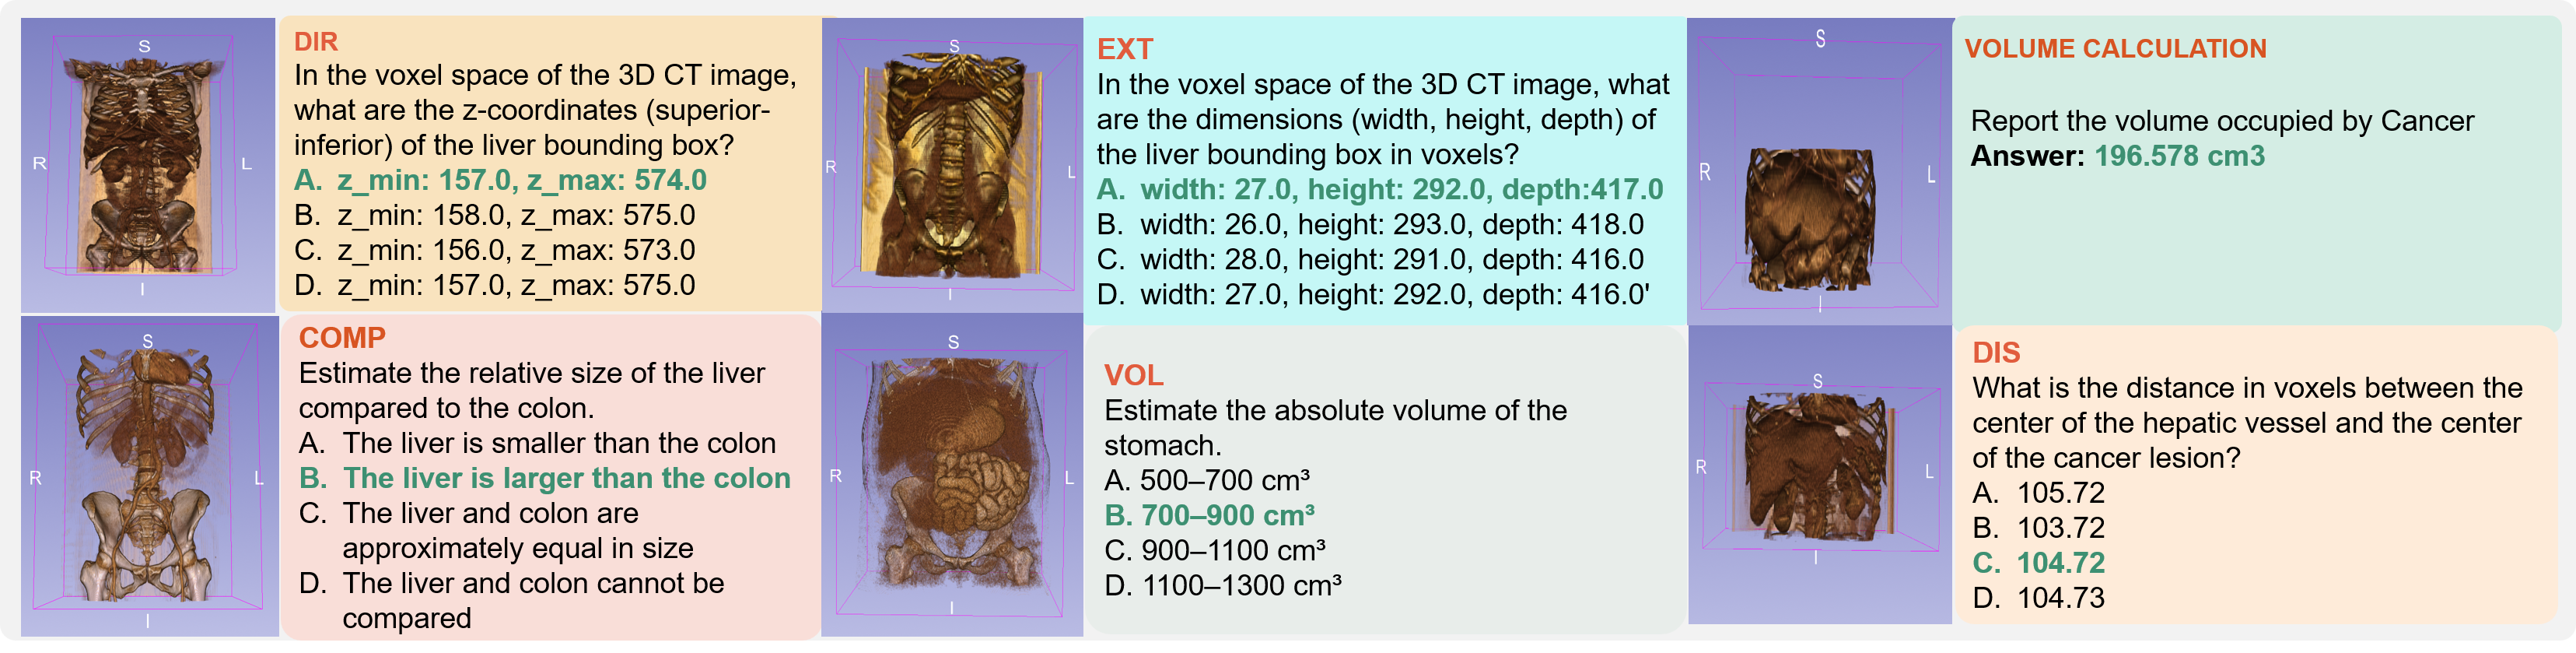
Building upon this foundation, SpatialMed encompasses six tasks organized into two categories. The first category consists of multiple-choice questions (MCA) covering directional reasoning (DIR) (understanding relative anatomical positions), distance reasoning (DIST) (e.g., center-to-center distance, closest/farthest, proximity), extent/size/ shape reasoning (EXT) (e.g., bounding boxes, axis extent, width/height/depth), volume magnitude reasoning (VOL) (numeric values and intervals, including absolute estimation, threshold/range decisions, and numeric calculation), and comparative reasoning (COMP) (comparing entities by magnitude, including pairwise comparison and ranking (largest/smallest)). The second category requires models to directly estimate volumetric measurements, including absolute volumes, volume ratios, and cross-case comparisons. Examples for each task are demonstrated in Figure 1.
3.2 Agentic Benchmark Construction Pipeline↩︎
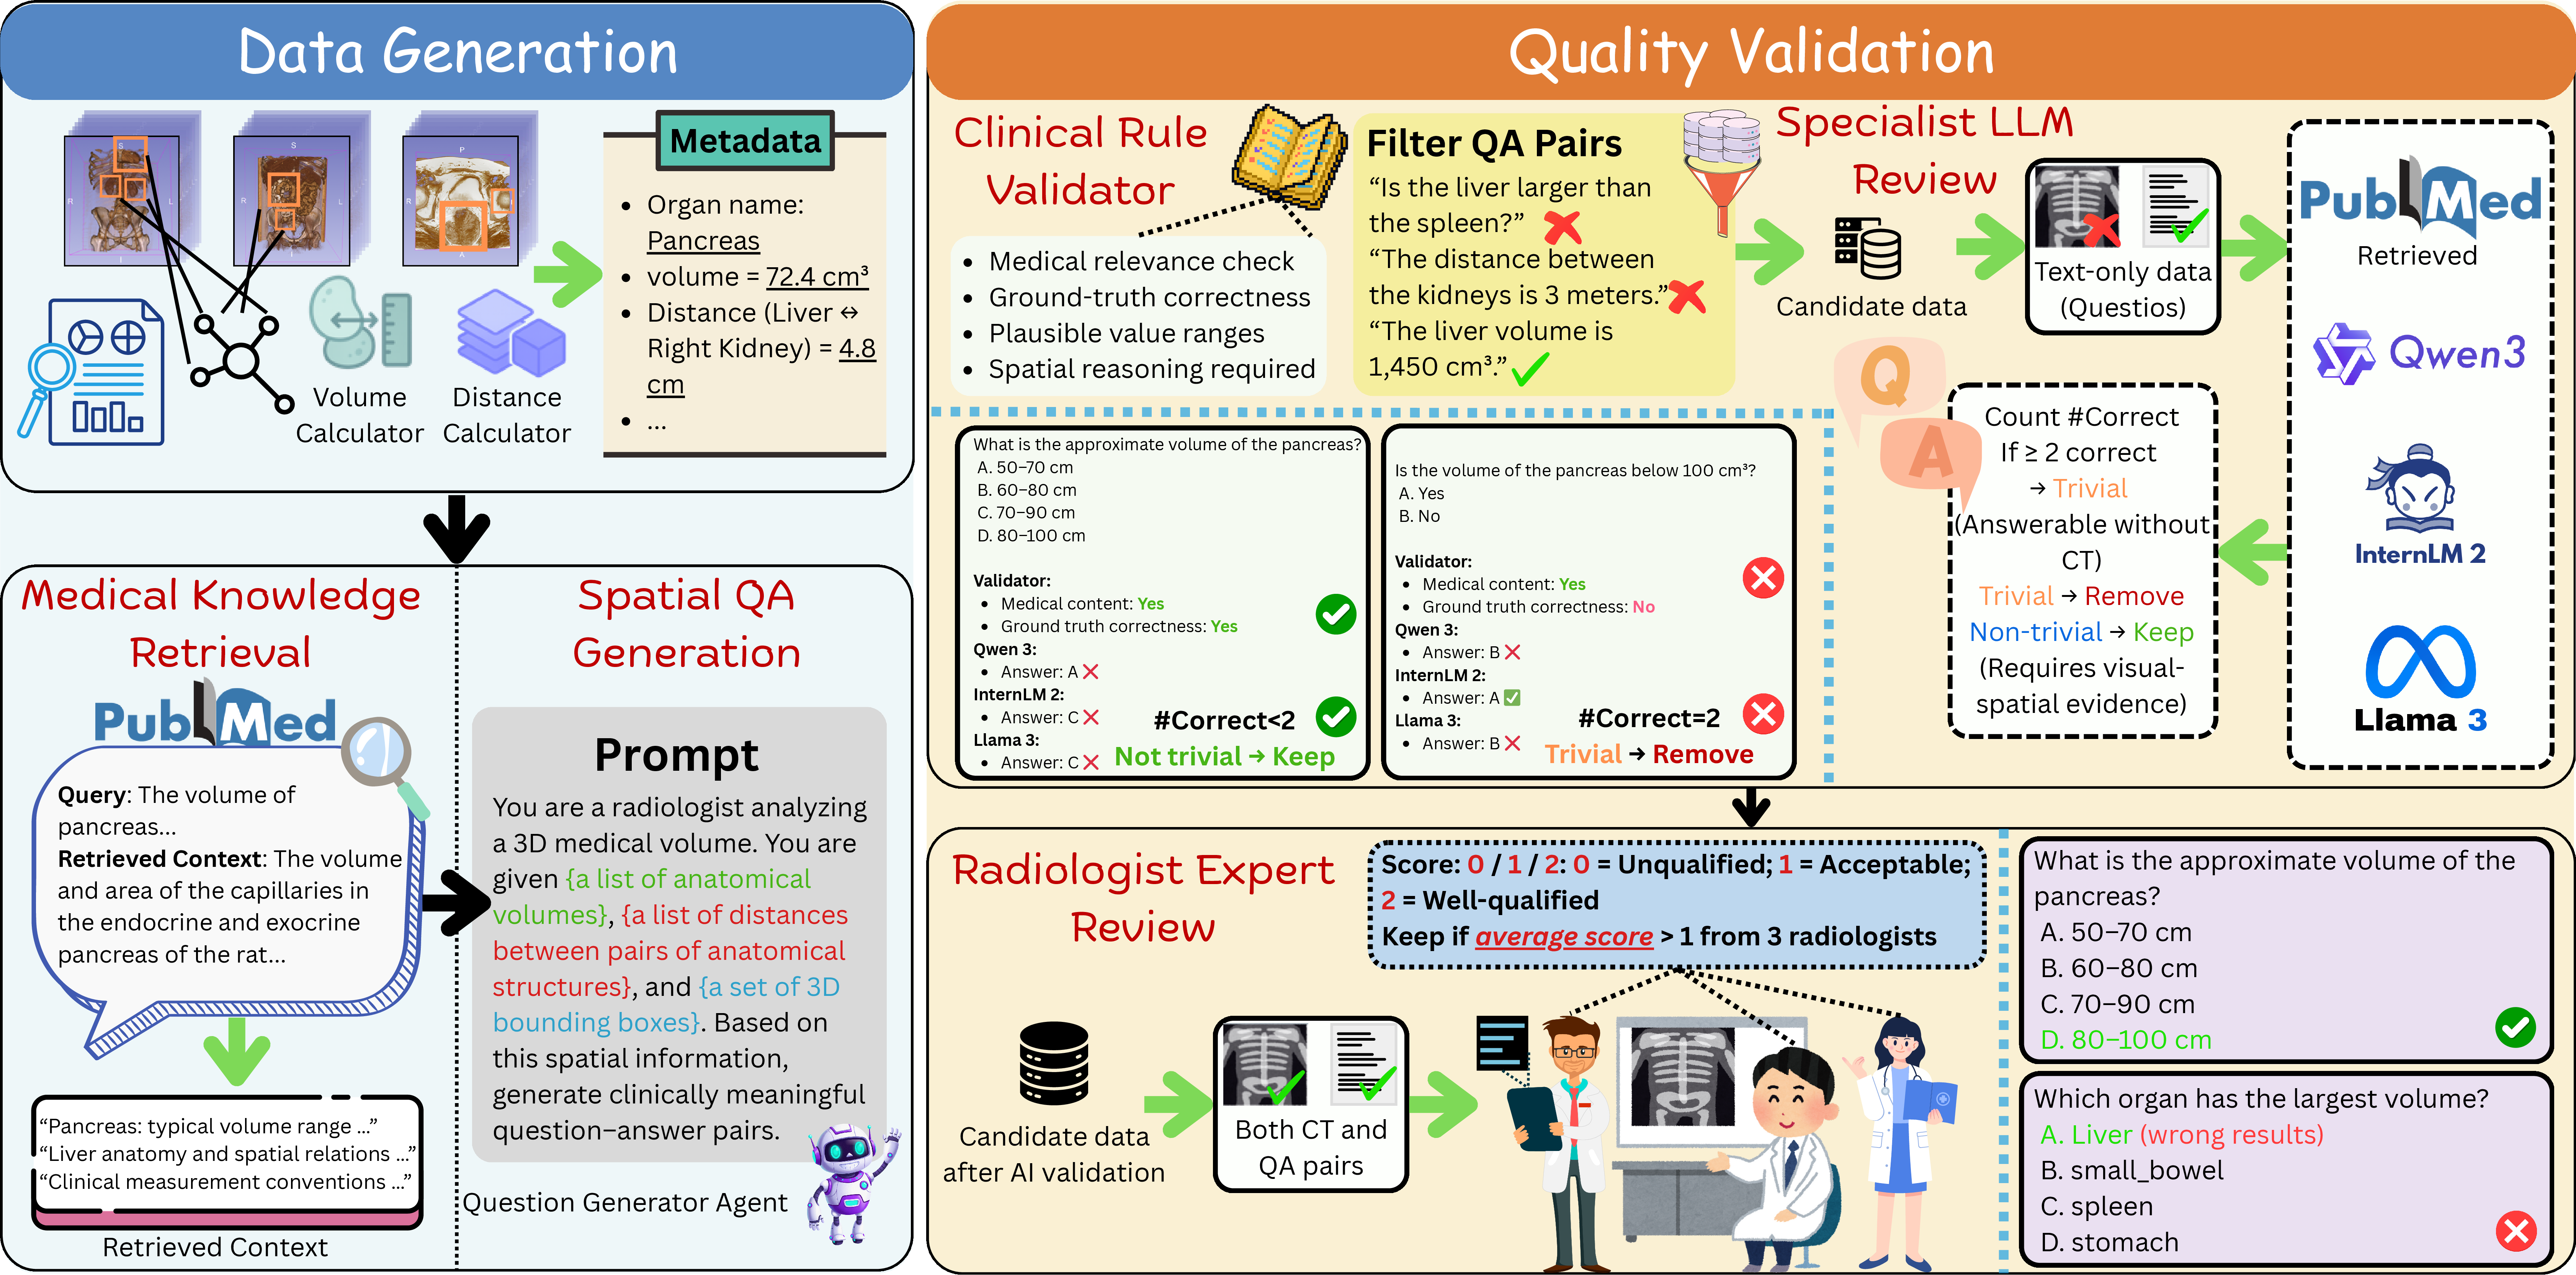
We develop a multi-agent pipeline to systematically curate SpatialMed. The pipeline leverages specialized computational tools to extract quantitative spatial information from medical images, which is then synthesized with retrieval-augmented generation (RAG) to produce spatial reasoning question-answer pairs. A multi-agent validation system, comprising one clinical validation agent and three medical specialist agents, reviews the quality of generated QA pairs. To validate the effectiveness of our automated pipeline, we engaged three board-certified radiologists to independently review the generated data, confirming the quality and clinical validity of the spatially-grounded QA pairs.
Spatial Computational Tools. To extract numerical spatial information from 3D CT scans, we introduce three tools: Volume Calculator, 3D Bounding Box Extractor, and Distance Calculator.
Volume Calculator. To compute the volume of target objects, we employ the 3D segmentation masks. The volume is calculated by counting foreground voxels (corresponding to anatomical structures and tumors) and converting this count into a measurement using voxel spacing values stored in the NIfTI header. Given a segmentation mask \(M \in \mathbb{R}^{H \times W \times D}\), where foreground voxels are defined as those with values greater than zero, and voxel spacings \((d_x, d_y, d_z)\) in millimeters, the volume is calculated as Equation 1 . \[V = \sum_{i,j,k} 1\!\left[M_{i,j,k} > 0\right] \cdot d_x d_y d_z \,/\, 1000, \label{equa:vol}\tag{1}\] where \(i,j,k\) denote indices along the height, width, and depth dimensions of the 3D volume, and division by 1000 converts the volume from \(\mathrm{mm}^3\) to \(\mathrm{cm}^3\). Segmentation masks containing only background voxels are excluded. This voxel-based volume calculator follows standard practice in volumetric medical image segmentation and enables consistent quantitative comparison across datasets with varying spatial resolutions.
3D Bounding Box Extractor. To extract axis-aligned 3D bounding boxes from segmentation masks, we first identify the set of foreground voxels \(\mathcal{S}=\{(i,j,k)\mid M_{i,j,k}>0\}\). The bounding box coordinates are then computed as: \[\begin{align} x_{\min} &= \min_{(i,j,k)\in\mathcal{S}} i, \quad x_{\max} = \max_{(i,j,k)\in\mathcal{S}} i, \\ y_{\min} &= \min_{(i,j,k)\in\mathcal{S}} j, \quad y_{\max} = \max_{(i,j,k)\in\mathcal{S}} j, \\ z_{\min} &= \min_{(i,j,k)\in\mathcal{S}} k, \quad z_{\max} = \max_{(i,j,k)\in\mathcal{S}} k. \end{align}\] In this way, we obtain a tight bounding box enclosing the target anatomy or tumor.
Distance Calculator. We compute the spatial distance between two anatomical structures or tumors using the Euclidean distance between their bounding box centers. Given bounding boxes for anatomies \(A\) and \(B\) with coordinates \(\{x_{\min}^A, y_{\min}^A, z_{\min}^A, x_{\max}^A, y_{\max}^A, z_{\max}^A\}\) and \(\{x_{\min}^B, y_{\min}^B, z_{\min}^B, x_{\max}^B, y_{\max}^B, z_{\max}^B\}\), respectively, we first compute their centers as \[\begin{align} \mathbf{c}^A &= \left( \frac{x_{\min}^A + x_{\max}^A}{2}, \frac{y_{\min}^A + y_{\max}^A}{2}, \frac{z_{\min}^A + z_{\max}^A}{2} \right), \\ \mathbf{c}^B &= \left( \frac{x_{\min}^B + x_{\max}^B}{2}, \frac{y_{\min}^B + y_{\max}^B}{2}, \frac{z_{\min}^B + z_{\max}^B}{2} \right). \end{align} \label{equa:bbox}\tag{2}\] The distance between the two structures is then given by \[d(A,B) = \lVert \mathbf{c}^A - \mathbf{c}^B \rVert_2. \label{equa:euclid}\tag{3}\]
Spatial Visual Question-Answer Generation. All question-answer pairs are automatically generated using voxel-level spatial metadata derived from the above tools. This metadata is combined with five predefined question templates per task and provided as input to our agent-based framework that produces target question-answer (QA) pairs. To generate clinically grounded QA pairs, we employ retrieval-augmented generation (RAG) in out agentic pipeline [44] using PubMed as the medical knowledge source [45]. This enables the language model to produce medically plausible questions and, for multiple-choice questions, generate contextually relevant distractors that reflect common clinical scenarios rather than obviously unrelated options. Specifically, given the names of target anatomies or tumors, we retrieve the top-5 related documents using prompts such as “The volume of \(\langle\text{anatomy name}\rangle\)” or “The distance between \(\langle\text{anatomy name 1}\rangle\) and \(\langle\text{anatomy name 2}\rangle\)”. The retrieved documents are then used as contextual input to the question annotator agent for QA generation.
Following QA construction, all generated samples are filtered through a validation pipeline consisting of one clinical validation agent and three medical specialist agents. The clinical validation agent applies one-shot prompting to assess each QA pair according to three criteria: (1) medical-domain relevance, requiring anatomies, pathologies, and spatial relations to be clinically meaningful (e.g., rejecting “the distance between the heart and the sky” while accepting “the distance between the liver and right kidney”); (2) reasonable relative values, ensuring quantitative attributes such as volume or distance fall within plausible anatomical ranges (e.g., rejecting “the liver volume is 0.01 mm\(^3\)” while accepting “the liver volume is 1,450 cm\(^3\)”); and (3) non-triviality, excluding QA pairs answerable from general medical knowledge alone (e.g., “Is the liver larger than the spleen?”), while retaining those requiring CT image-grounded spatial reasoning (e.g., “What is the Euclidean distance between the centroids of the liver and spleen?”). Subsequently, three medical specialist agents powered by InternLM 2 [46], Qwen-3 [32], and Llama-3 [47] attempt to answer each question using only the RAG tool [44], without access to volumetric images. If at least two specialists succeed, the sample is deemed trivial and discarded; otherwise it is retained. After this multi-agent validation and filtering process, the dataset is reduced from 30,799 automatically generated samples to 10,487 high-quality spatial reasoning QA pairs.
For visual input, we provide 3D CT scans to MLLMs capable of processing volumetric data, and multi-view 2D projections to those limited to RGB images. For the latter, we crop relevant slices based on segmentation masks of target anatomies or tumors, converting them into sagittal, coronal, and axial view RGB images along the \(x\), \(y\), and \(z\) axes. This enables evaluation of spatial understanding across MLLMs with different input modalities.
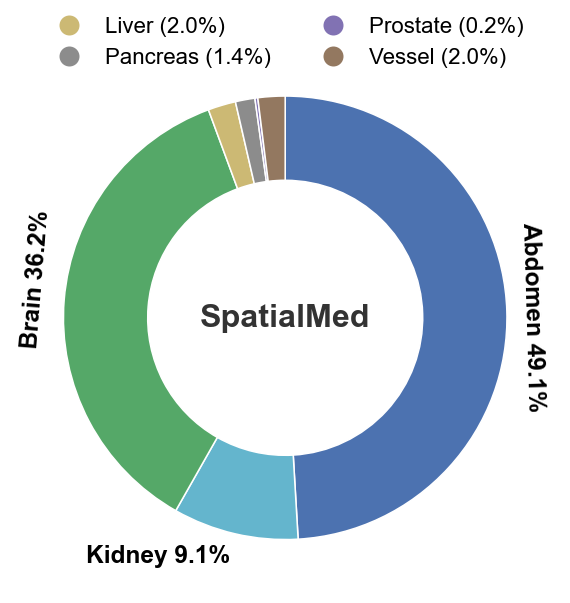
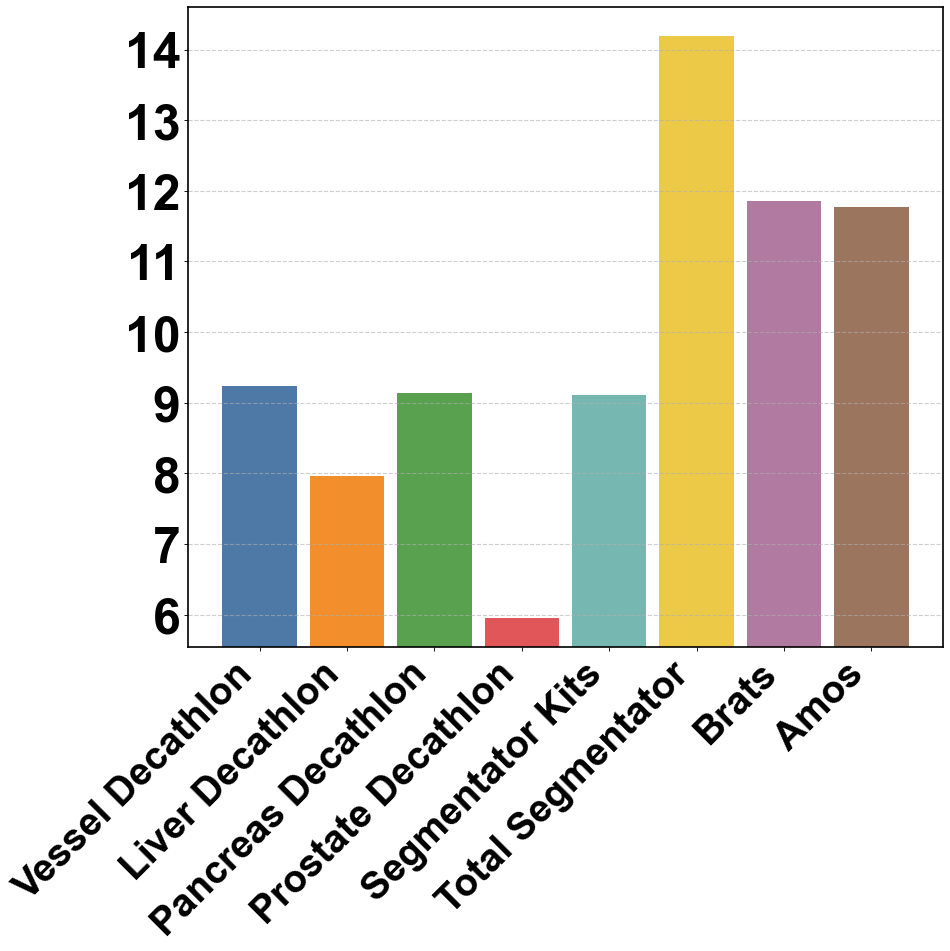
Figure 3: Benchmark Statistics. Left: Distribution of annotated anatomical regions in the MCA task. Right: Dataset distribution across the volume task, where the y-axis is shown on a log\(_2\) scale..
Expert-in-the-loop Quality Review. To ensure the benchmark’s clinical integrity and mitigate "hallucination artifacts" common in LLM-generated content, we implemented a rigorous, multi-stage validation phase involving three board-certified radiologists. This process refined the initial pool of 10,487 VQA pairs down to a final, high-fidelity set of 9,782 samples.
Each radiologist independently audited the full 3D volumetric scans alongside the generated QA pairs, assigning a quality score based on three stringent dimensions: (1) Clinical Logicality – Evaluators rejected any queries that, while spatially correct, were medically nonsensical or lacked diagnostic utility, ensuring every question mirrors a real-world clinical scenario; (2) Quantitative Consistency – Answers were verified against the imaging evidence to ensure that volumetric ratios and spatial distances remained within plausible anatomical ranges; (3) Exhaustive Mutuality– For comparative tasks, radiologists ensured that choice sets (e.g., volume change or size ranking) were both mutually exclusive and exhaustive, preventing "lucky guesses" through flawed distractor logic.
Scores are determined as: 0 for unqualified, 1 for acceptable, and 2 for well-qualified QA pairs. Final inclusion in SpatialMed required an average score greater than 1.0, effectively filtering out samples where the spatial evidences are ambiguous or the reasoning path is non-interpretable by a human expert. This expert-driven bottleneck transforms SpatialMed from a synthetic dataset into a validated clinical instrument for measuring and attributing MLLM reliability, which makes the dataset more realistic and be aligned with the scope from the medical application.
3.3 Dataset Distribution↩︎
The overall dataset distribution is illustrated in Figure 3. The MCA task is dominated by the abdomen (5,146) and the brain (3,792), while the volume task is mainly from TotalSegmentator (18,675) and BraTS (3,714). The number of organs in the abdominal regions contributes to the diversity in the anatomical and organs of the dataset.
| Method | Size | Vis. backbone | Lang. backbone | MCA (%) | Volume | |||||
|---|---|---|---|---|---|---|---|---|---|---|
| 5-10 | AVG | DIR | DIST | EXT | VOL | COMP | ||||
| Random | 25.00 | 25.00 | 25.00 | 25.00 | 25.00 | 25.00 | ||||
| 2D Models (Non-medical Pretraining) | ||||||||||
| 1-11 LLaVA-Next (2024) [1] | 7B | SigLIP-400M | Mistral-7B | 40.80 | 56.96 | 28.18 | 47.82 | 44.68 | 45.81 | 21.35 |
| GLM-4.1V-9B (2025) [3] | 9B | AIMv2-Huge | GLM-4 | 26.18 | 22.03 | 19.63 | 26.97 | 37.14 | 31.09 | 22.93 |
| Qwen3-VL 4B (2025) [48] | 4B | SigLIP2-Large | Qwen3-4B | 50.81 | 54.50 | 49.90 | 46.20 | 63.90 | 56.20 | 34.14 |
| Qwen3-VL 8B (2025) [48] | 8B | SigLIP2-SO-400M | Qwen3-8B | 44.04 | 34.59 | 60.05 | 40.56 | 58.18 | 50.14 | 20.72 |
| InternVL3 8B (2025) [4] | 8B | InternViT-300M | Qwen2.5-7B | 42.83 | 43.26 | 46.07 | 26.38 | 64.68 | 47.89 | 28.69 |
| InternVL3 9B (2025) [4] | 9B | InternViT-300M | InternLM3-8B | 47.87 | 51.48 | 56.00 | 37.35 | 50.39 | 56.12 | 35.92 |
| 2D Models (Medical Pretraining) | ||||||||||
| 1-11 MedFlamingo (2023) [5] | 9B | CLIP ViT-L/14 | LLaMA-7B | 32.14 | 36.07 | 25.40 | 36.24 | 39.22 | 42.00 | 13.93 |
| LLaVA-Med (2024) [33] | 7B | CLIP ViT-L/14 | Mistral-7B | 46.38 | 73.86 | 31.29 | 55.22 | 47.27 | 55.48 | 15.17 |
| HuatuoGPT-Vision (2024) [7] | 7B | CLIP ViT-L/14 | Qwen2-7B | 1.34 | 1.60 | 1.04 | 1.76 | 2.08 | 1.56 | NaN |
| MedMoE (2024) [8] | 4B | Swin | Phi-2-2.7B | 15.84 | 22.15 | 5.08 | 23.77 | 11.95 | 15.64 | 16.45 |
| Med-VLM R1 (2025) [9] | 8B | Qwen2-VL’s ViT | Qwen2-VL-2B | 6.30 | 5.14 | 6.58 | 4.45 | 11.95 | 9.67 | NaN |
| Med-Gemma 4B (2025) [34] | 4B | SigLIP-400M | Gemma 3 4B | 43.18 | 54.11 | 24.36 | 50.22 | 47.53 | 57.16 | 25.69 |
| 3D Models | ||||||||||
| 1-11 Med-2E3 (2024) [10] | 3B | M3D-CLIP+SigLIP | Qwen2.5-3B-Instruct | 38.60 | 33.68 | 30.25 | 39.32 | 50.65 | 46.09 | 31.58 |
| M3D (2024) [13] | 7B | M3D-CLIP | LLaMA-2-7B | 8.86 | 0.11 | 0.00 | 31.10 | 1.04 | 12.07 | NaN |
3.0pt
4 Experiments and Results↩︎
4.1 Experimental Setup↩︎
Benchmark Model. We conduct a comprehensive evaluation of 14 MLLMs spanning both general-domain and medical-domain pretraining, covering a wide range of model sizes, architectures, and training recipes. For open-source general-domain models, we evaluate LLaVA-Next [1], GLM-4.1V [3], Qwen3-VL [48], and InternVL 3 [4]. For models pretrained or fine-tuned on medical datasets, we include MedFlamingo [5], LLaVA-Med [33], HuatuoGPT-Vision [7], MedMoE [8], Med-VLM R1 [9], and Med-Gemma [34]. Beyond 2D image–based MLLMs, we additionally evaluate 3D medical vision-language models, including RadFM [49], Med-2E3 [10], and M3D [13]. All benchmarks are conducted under a zero-shot evaluation setting. To ensure fairness and reproducibility, we apply greedy decoding consistently across all evaluated models.
Metric Design. For MCA tasks (Section 3.1), we adopt Accuracy as the primary evaluation metric, computed via exact matching between the predicted option and the ground-truth answer. For numerical estimation tasks, we employ the Mean Relative Accuracy (MRA) [50], which assesses prediction quality under varying tolerance levels. As defined in Equation 4 , we use a strict confidence set \(\theta = \{0.01, 0.02, \ldots, 0.1\}\), corresponding to relative error thresholds. MRA measures the proportion of predictions whose relative error falls within each confidence bound and averages these proportions across all thresholds. This formulation captures both absolute correctness and numerical proximity, providing a fine-grained evaluation of quantitative reasoning performance. \[\mathrm{MRA} = \frac{1}{|\theta|} \sum_{\theta \in C} 1\!\left( \frac{|\hat{y} - y|}{y} < 1 - \theta \right), \label{eqa:mra}\tag{4}\]
The overall model performance is computed by averaging the results across the six tasks.

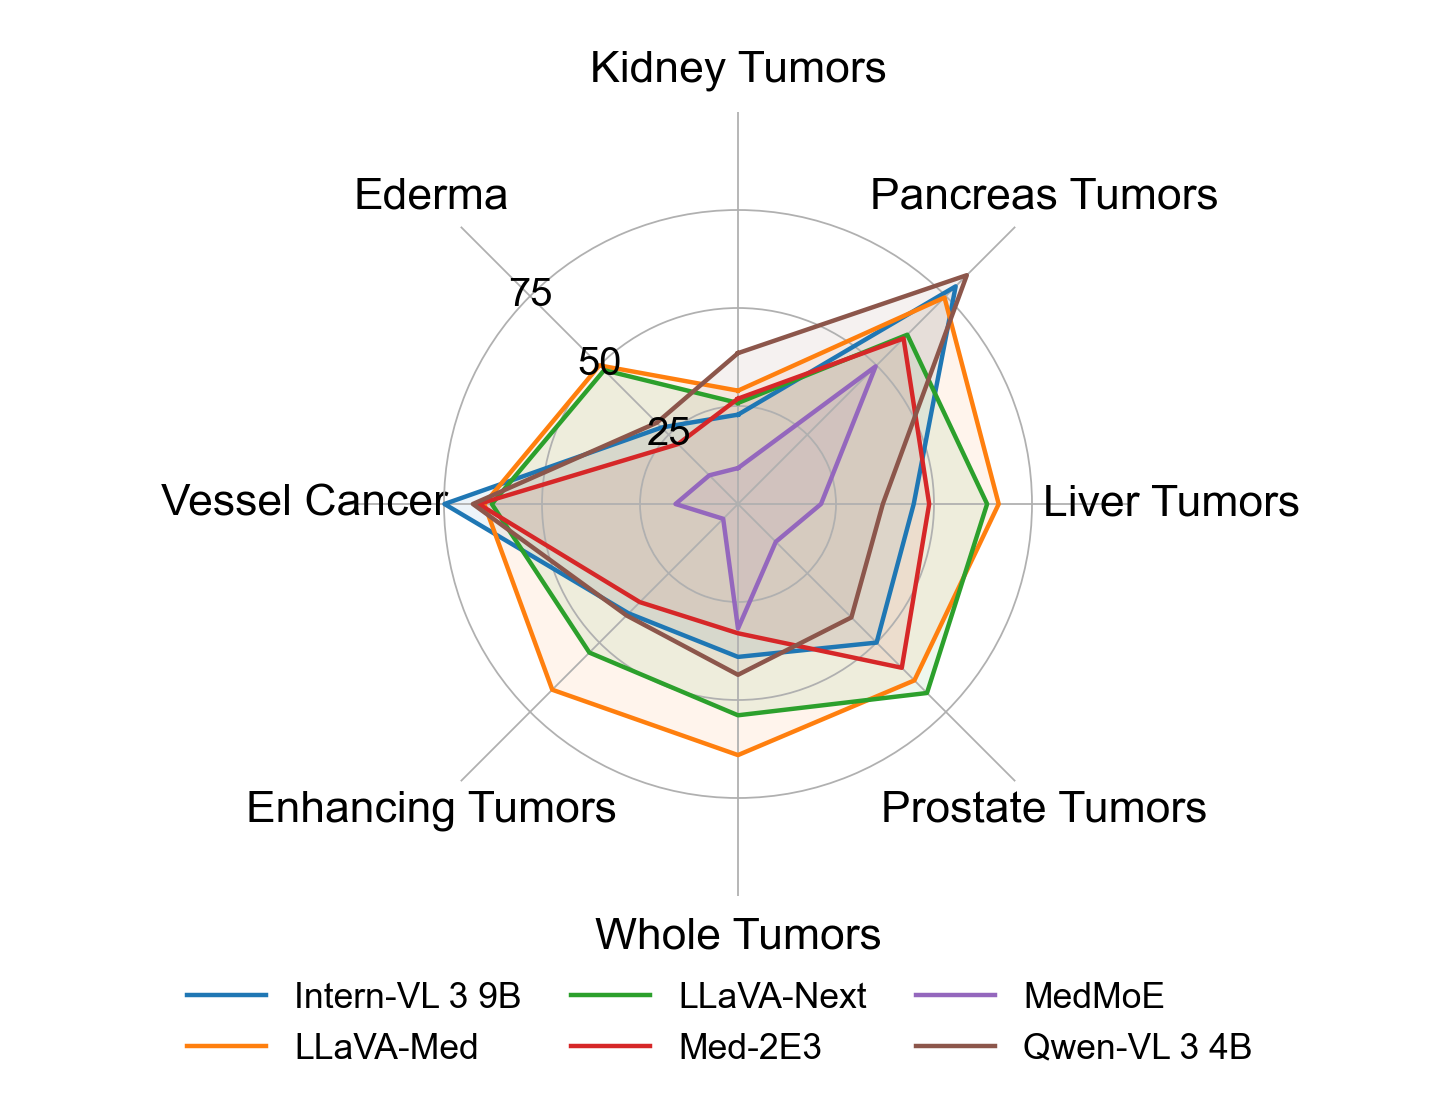
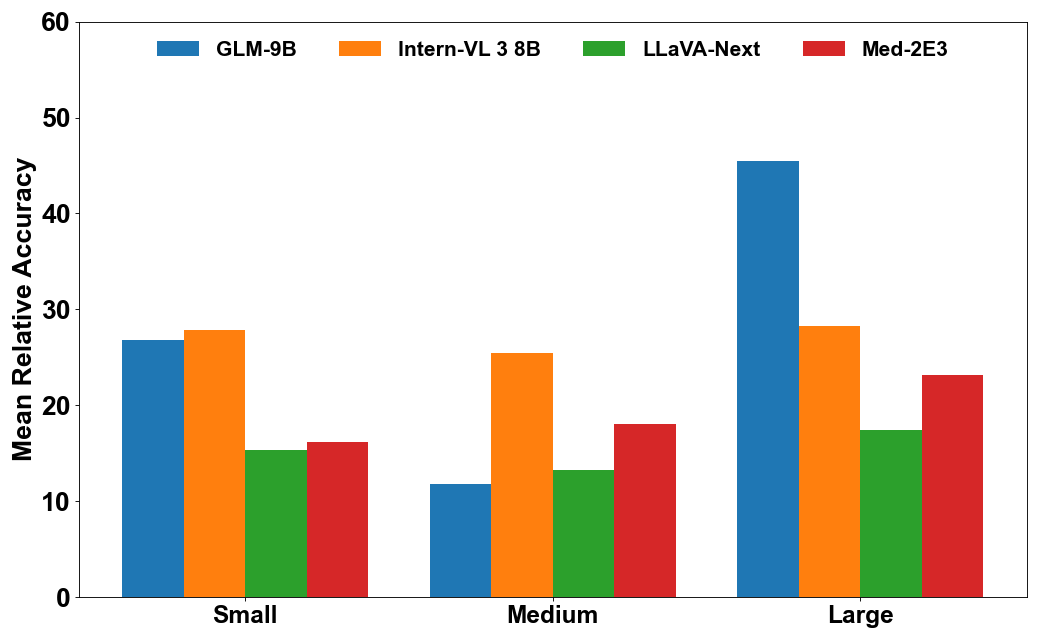
Figure 4: Fine-grained performance analysis across anatomical structures, tumor types, and volume scales. (a) Per-organ accuracy across models in the MCA task. (b) Tumor-wise accuracy across selected models. (c) Performance stratified by anatomical volume buckets using Mean Relative Accuracy.. a — Per-organ accuracy., b — Tumor-wise accuracy., c — Volume-bucketed performance.
4.2 Evaluation on SpatialMed↩︎
Table 2 presents evaluation across multiple model categories, including 2D models (with/without medical pretraining) and 3D models. Results use the aforementioned metrics. For models that lack the capability to produce numerical outputs, the corresponding results are reported as NaN.
Multiple Choice results. Evaluations on the MCA task reveal that several state-of-the-art models are near the random baseline of 25%, underscoring the inherent difficulty of grounded 3D reasoning. Notably, distance reasoning (DIST) emerges as a universal bottleneck, with even medically-pretrained models struggling to accurately compare geometric relations. Interestingly, scaling within the Qwen3-VL family is non-monotonic: the 4B model outperforms the 8B model on overall MCA, suggesting that larger capacity does not uniformly translate into better grounded 3D decision-making. This points to sub-skill interference: improvements in some operators may come at the cost of others when the backbone changes, which is consistent with the unstable ranking patterns observed across model groups. Furthermore, our human-annotated failure analysis (Fig. 5) indicates that Numeric Reasoning Errors dominate the volume estimation tasks, suggesting that MLLMs lack the calibrated output stability required for clinical measurements. This aligns with evidence that common post-training methods can degrade calibration in LLMs, which would directly amplify numeric instability in measurement-style outputs.
Medical pretraining does not uniformly improve MCA performance. A plausible explanation is that medical tuning often prioritizes recognition and justification behaviors, but does not explicitly supervise geometric operators (e.g., distance comparison), so the hardest relational sub-tasks remain under-trained. While LLaVA-Med improves over many general domain baselines on DIR and EXT, other medically pretrained 2D models underperform, with results below the random baseline. For 3D models, Med 2E3 is competitive, whereas M3D fails on directional reasoning, suggesting that simply supporting volumetric input does not guarantee robust spatial reasoning without task-aligned training and output calibration.
Organ wise analysis. The per-organ breakdown in Figure 4 (a) reveals heterogeneity across anatomical targets. First, model ranking is unstable across organs: a model that performs well on one organ can still degrade sharply on another, implying MCA accuracy depends on both spatial reasoning and organ specific visual grounding. Second, weaker models show uniformly low accuracy across nearly all organs, indicating the model cannot reliably localize the referenced structure and defaults to shallow answer patterns. In contrast, stronger models show more balanced heatmaps, but still exhibit clear organ dependent gaps. This suggests CT grounded spatial reasoning is limited not only by reasoning operators such as distance comparison, but also by the upstream perception reliability, including organ boundary cues, local context, and multi-view projection stability. This motivates reporting organ conditioned scores, since a single average can hide clinically meaningful failure cases.
Tumor-related MCA behavior. Figure 4 (b) further isolates tumor-related MCA questions and shows that tumor understanding varies by tumor type and anatomical context. While leading models form similar overall shapes, they diverge on specific axes, indicating that improvements are not uniform across tumor categories. In particular, some tumor types appear consistently easier across models, whereas others show a larger spread, which points to sensitivity to factors such as tumor size, contrast, and proximity to surrounding structures. Importantly, these tumor-conditioned differences align with the earlier observation that distance reasoning is difficult: when tumors are near complex boundaries, small spatial errors can flip relative distance or adjacency judgments. As a result, stronger tumor recognition alone does not guarantee robust spatial reasoning, and future model training should explicitly couple lesion localization with geometric relation supervision.
Volume estimation results. Volume estimation is challenging for most models. The best MRA score is obtained by InternVL3 9B, followed by Qwen3-VL 4B and the 3D model Med-2E3. The larger Qwen3-VL 8B underperforms its 4B counterpart on volume estimation (20.72 vs.), indicating scale alone is insufficient. Crucially, the 4B and 8B variants differ not only in the language backbone but also in the vision encoder, so the regression cannot be attributed to language scaling alone. Because volume estimation is highly sensitive to boundary cues and fine-grained localization, changes in visual feature granularity/geometry can materially alter quantitative accuracy, even when a larger LLM is used. Medical pretraining does not improve MRA. LLaVA-Med and Med-Flamingo lag behind several general domain models, suggesting medical tuning prioritizes recognition over measurement. Multiple models return NaN for volume estimation, reflecting limitations in producing stable continuous outputs. Models often avoid numeric commitments or produce poorly calibrated values. This is consistent with broader findings that instruction-tuned models can be miscalibrated, motivating explicit calibration objectives or constrained decoding for stable scalar generation [51]. This requires explicit numeric supervision, unit awareness, and structured output constraints for quantitative clinical tasks. Figure 4 (c) further breaks down MRA by volume ranges (Small, Medium, and Large), showing volume-dependent performance. Small lesions are error-sensitive, as minor mistakes cause large relative deviations; improving quantitative stability on low-volume cases is key for reliable volume estimation.
4.3 Failure analysis↩︎
Following [52] and [53] setups, we randomly sample 50 failure cases in reasoning with the chain-of-thought setup for each task to assess the limitations in the MLLMs’ spatial understanding.
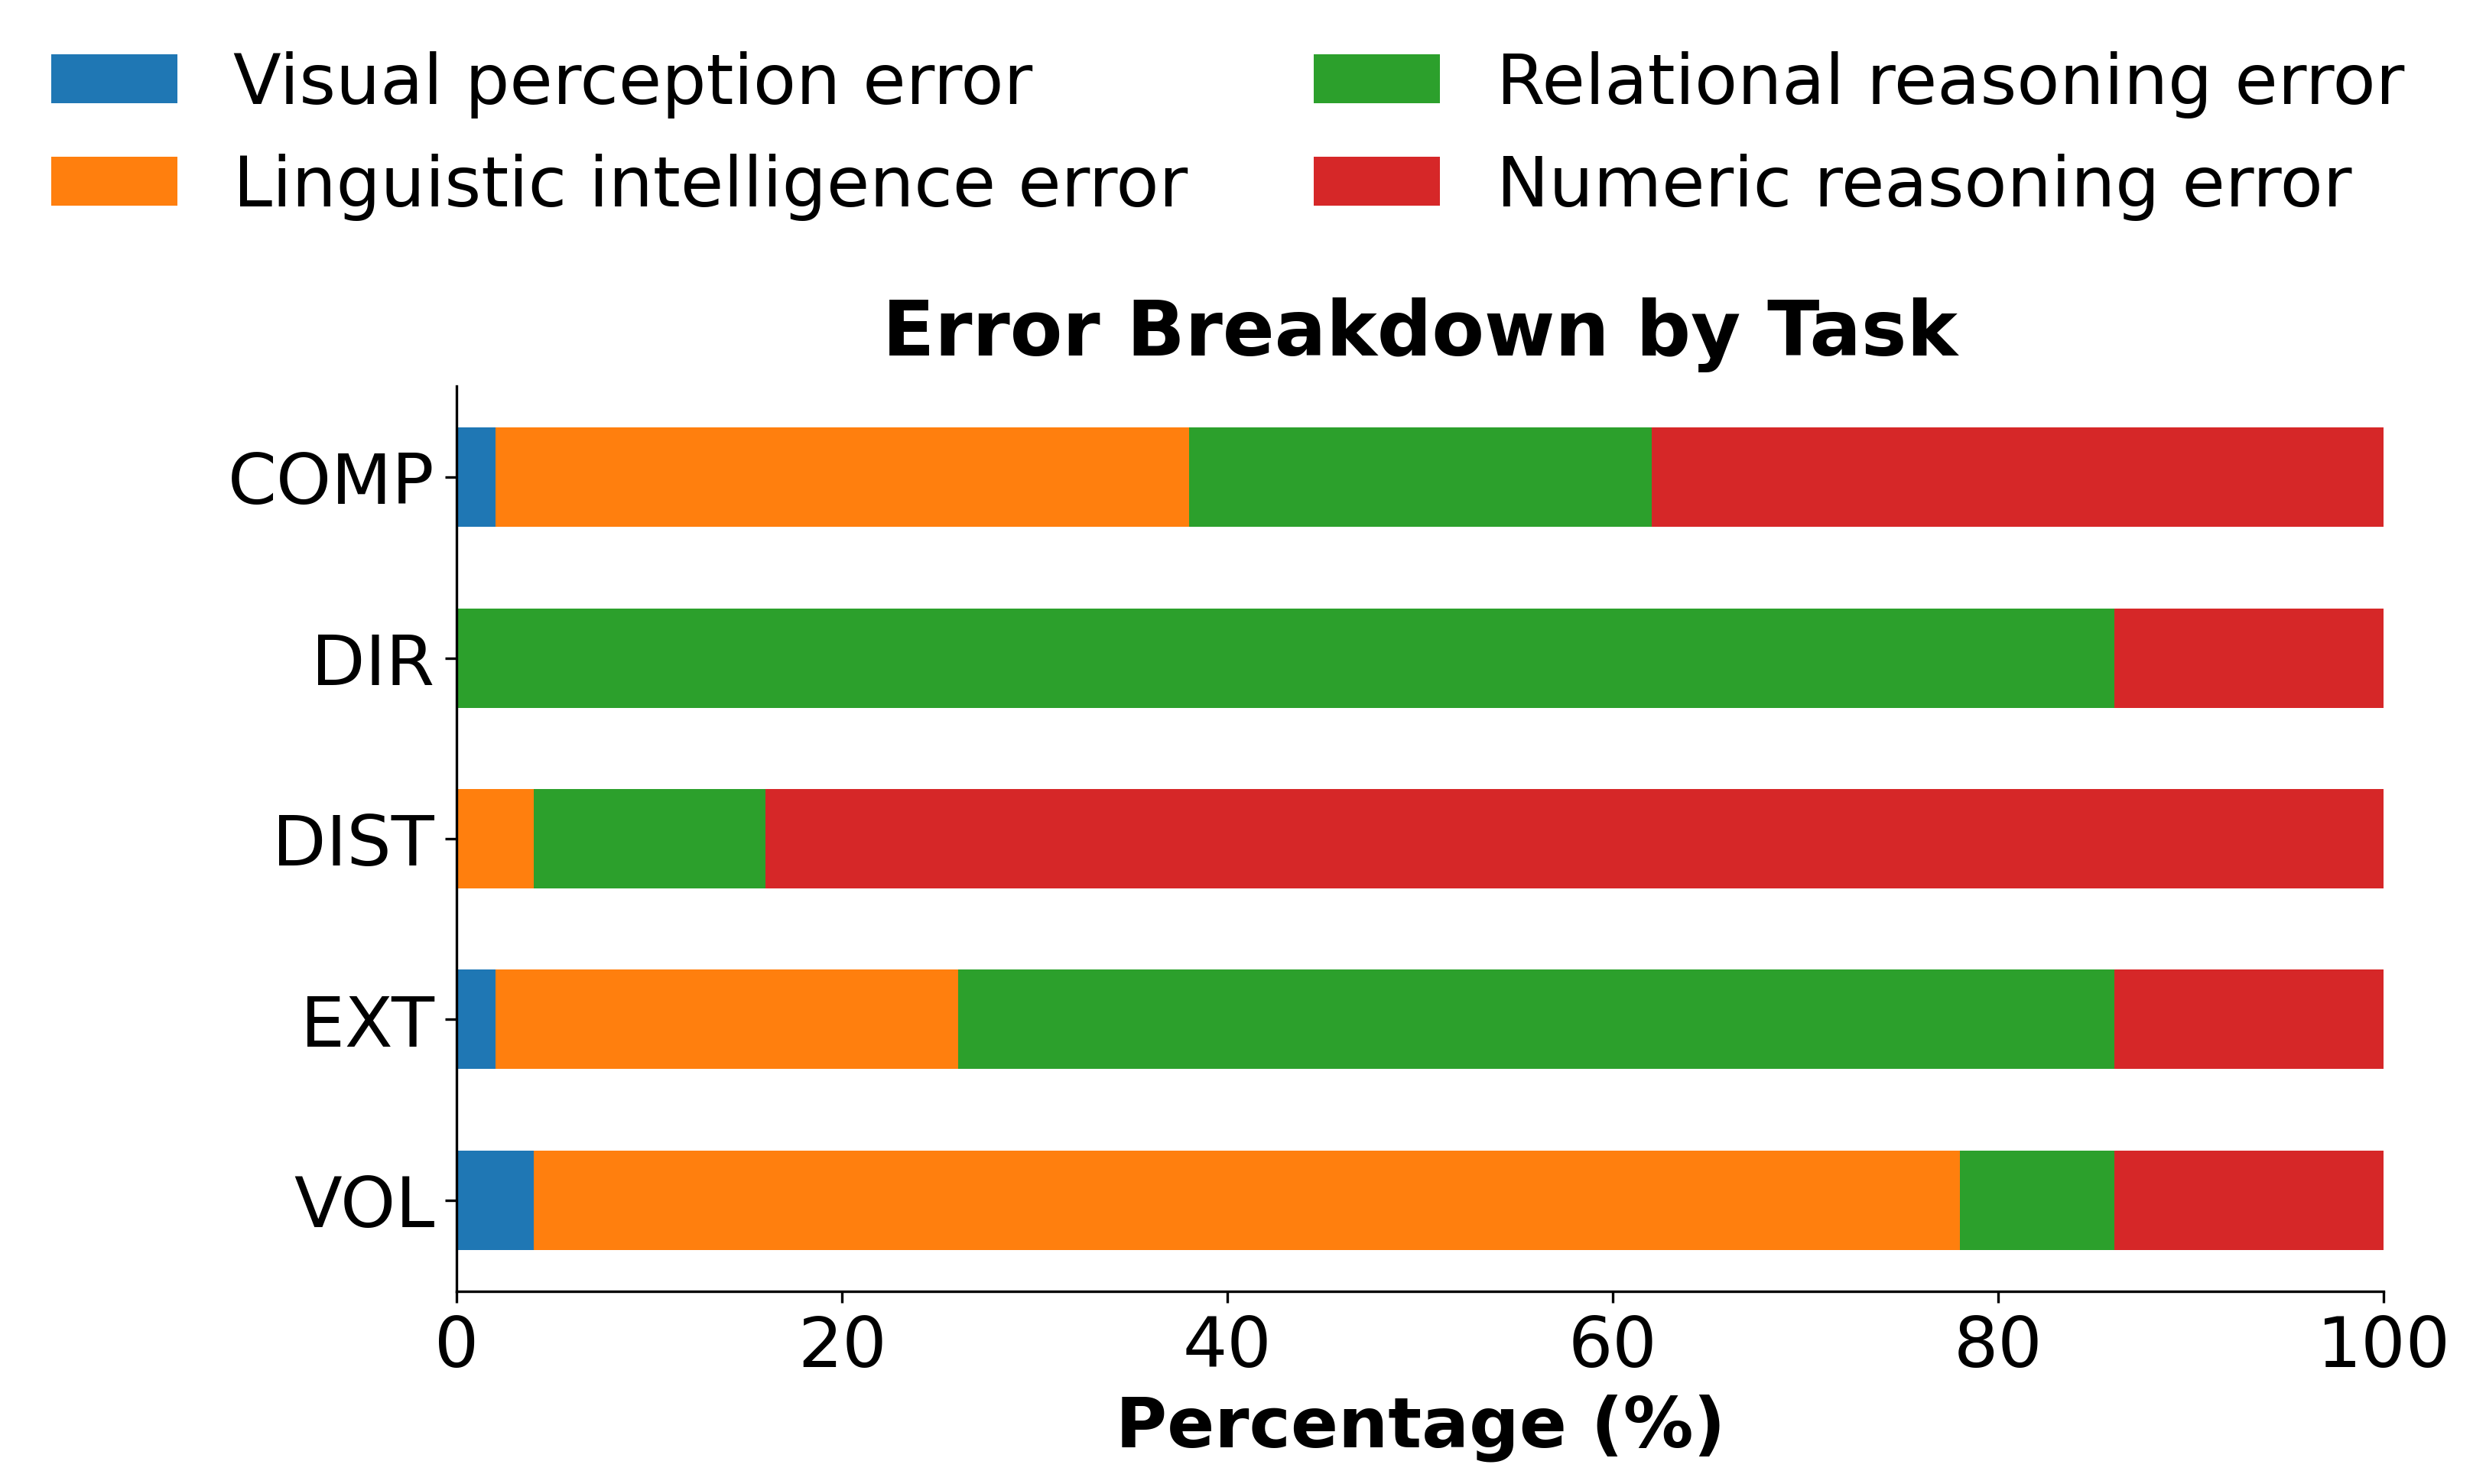
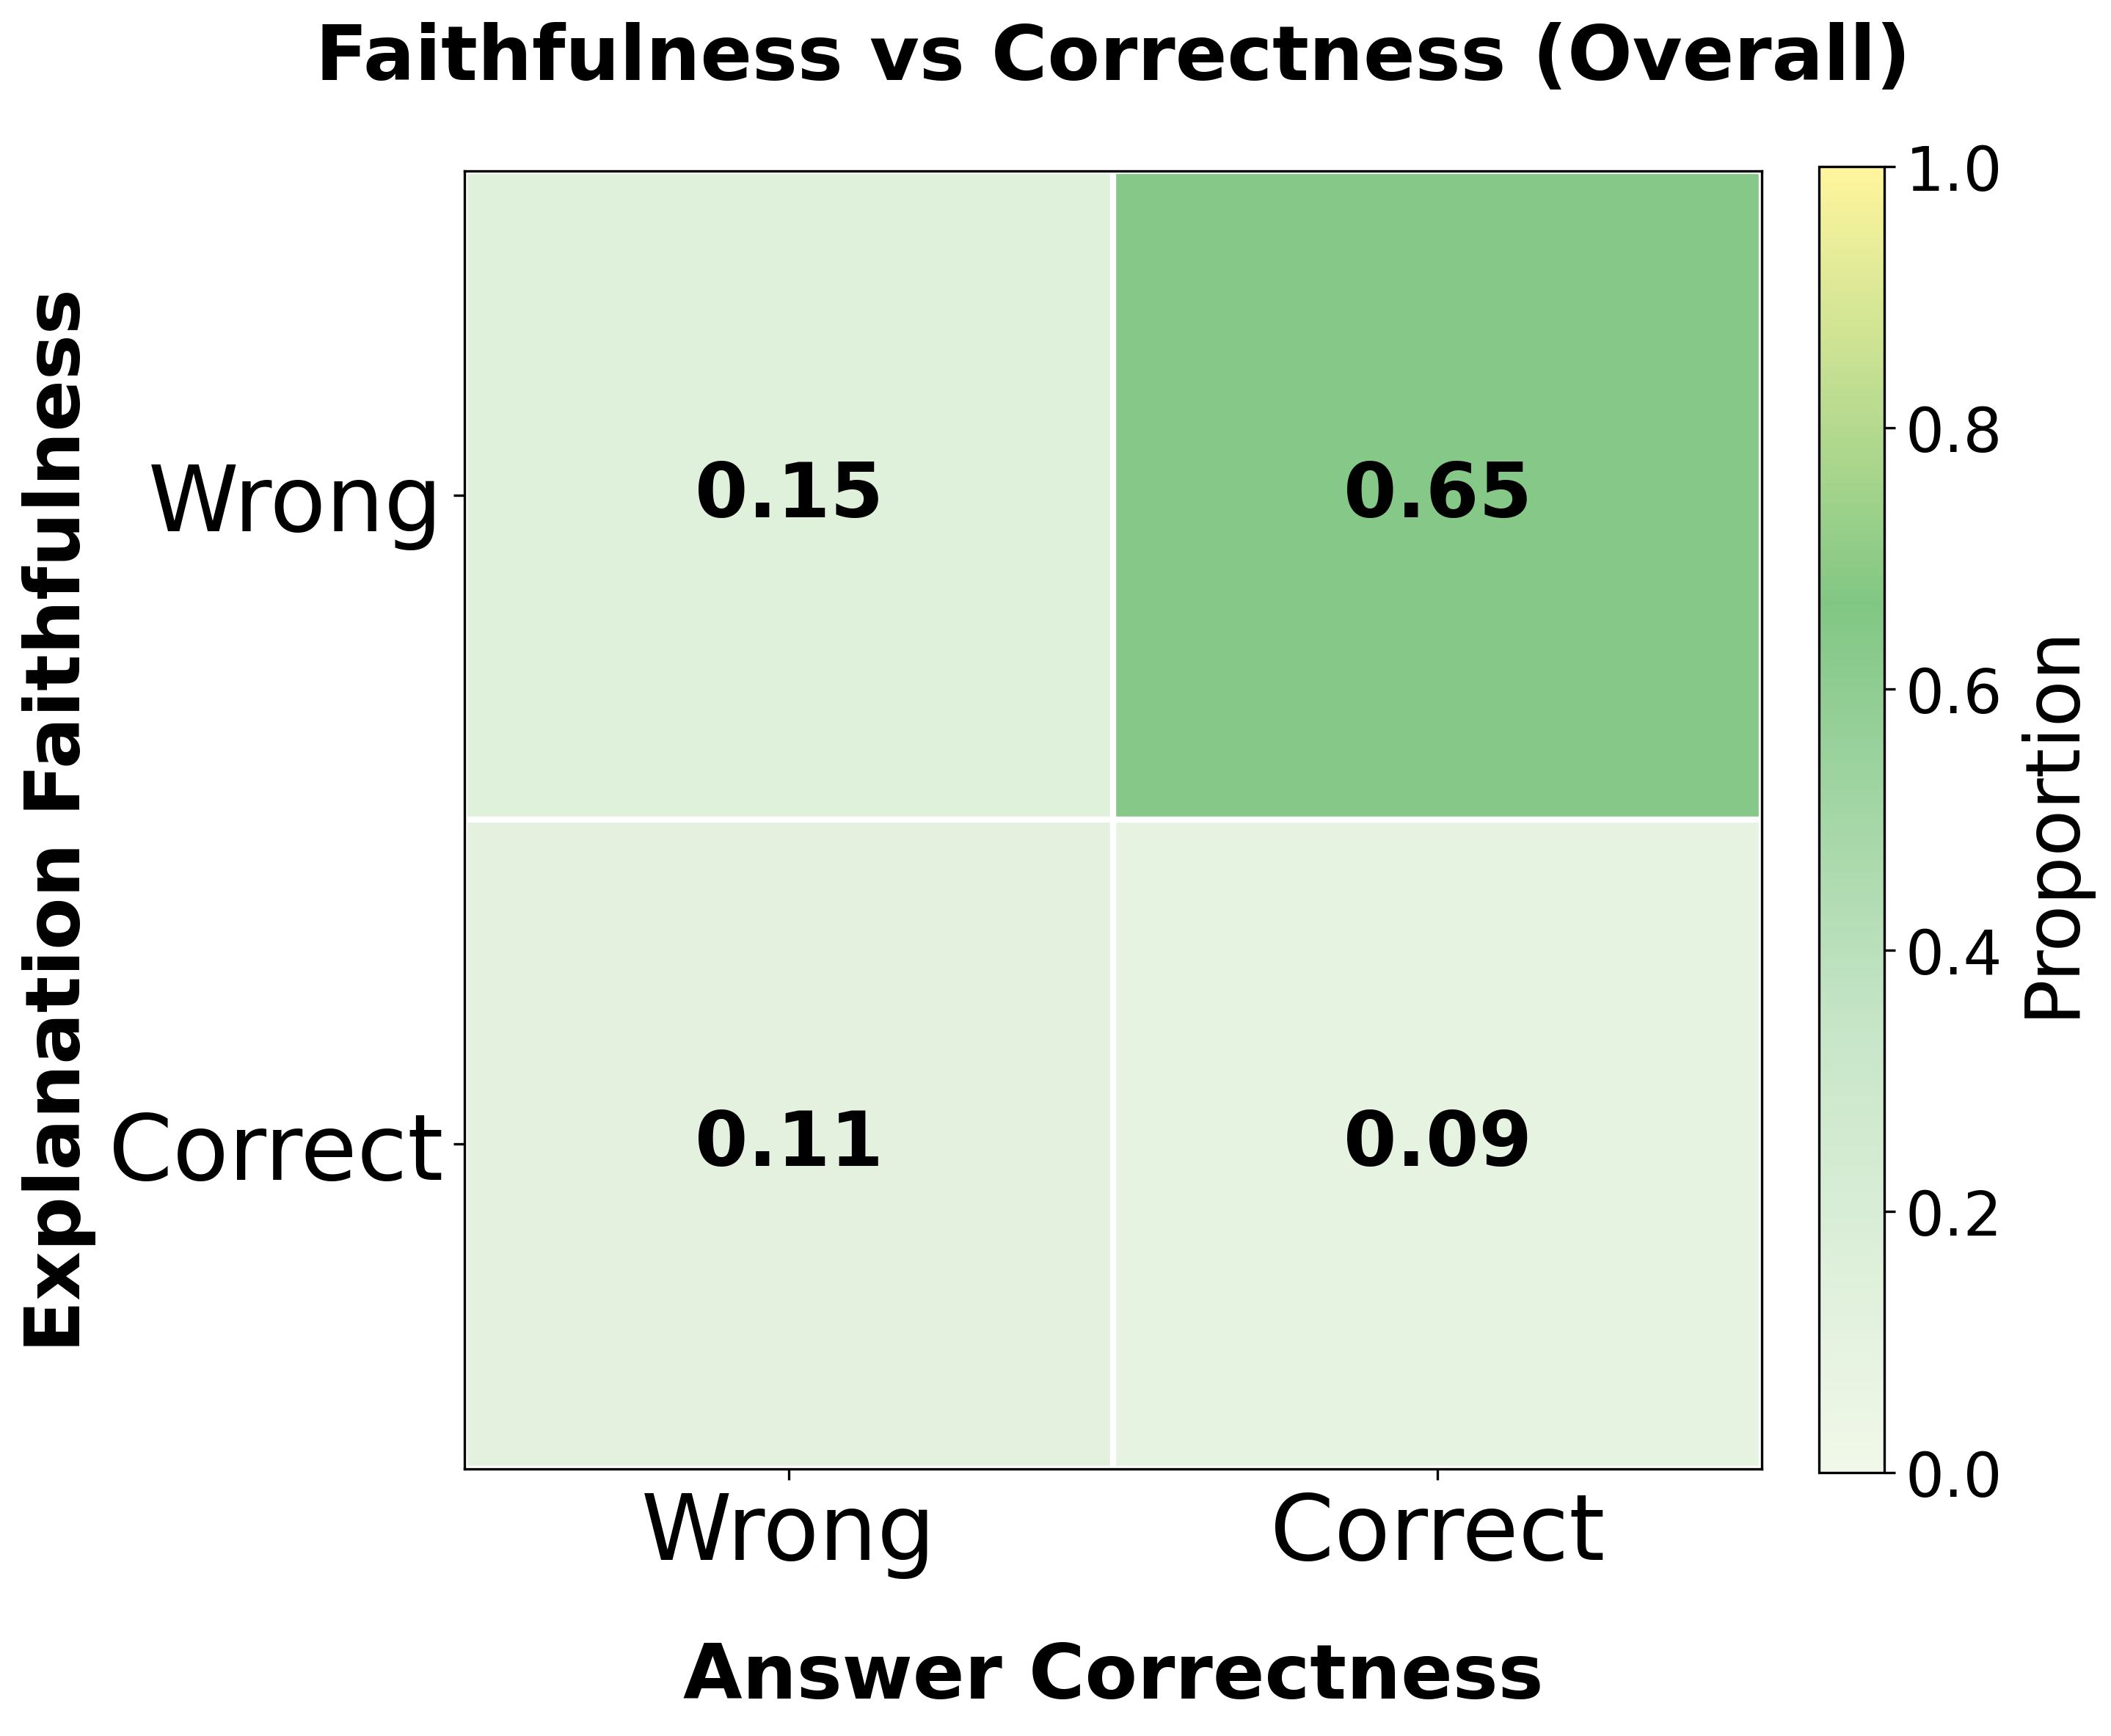
Figure 5: Failure and faithfulness analysis of MLLM spatial reasoning. (a) Human-annotated taxonomy of reasoning errors, where numeric and relational errors dominate. (b) Faithfulness matrix categorizing predictions into faithful reasoning, decision errors, lucky guesses, and hallucination.. a — Human analysis of reasoning error types., b — Reasoning faithfulness analysis.
Human validation. To quantify the limitations of current MLLMs in spatial reasoning, we manually analyze and categorize model failures into four major types, as illustrated in Figure 5 (a). These error categories reflect distinct cognitive and perceptual challenges encountered by MLLMs in spatial reasoning over multimodal medical data: (1) Visual perception error, which arises when models fail to recognize or localize visual entities in medical images, such as misidentifying anatomical structures, missing target regions, or misinterpreting spatial layouts in different views; (2) Linguistic intelligence error, stems from the error in the language artifact, format output, and logic error in reasoning; (3) Relational reasoning error, which refers to failures in modeling spatial relationships among anatomical structures or lesions, such as incorrect reasoning about relative position, distance, size, direction, or hierarchical spatial relations; and (4) Numeric reasoning error, which occurs when models incorrectly perform quantitative reasoning, including volumes, distances, ratios, etc. derived from visual or textual information.
Results from the SpatialMed suggest that: The spatial reasoning, and the language to interpret the model’s spatial understanding, is the challenge of the MLLMs.
Reasoning Faithfulness. From human validation for the reasoning of MLLMs, we observe that hallucination and the random generation frequently occur during spatial reasoning, as illustrated in Figure 5 (b). To further disentangle the relationship between reasoning quality and prediction accuracy, we analyze the faithfulness of model explanations by examining whether the generated chain-of-thought supports the ground-truth answer. As shown in Figure 5 (b), model outputs can be categorized into four reasoning outcomes: (i) faithful reasoning, where both the explanation and the final answer are correct; (ii) decision errors, where the explanation aligns with the ground truth but the final answer is incorrect; (iii) lucky guesses, where the explanation is inconsistent with the ground truth yet the answer is correct; and (iv) hallucinated reasoning, where both the explanation and the answer are incorrect. The results demonstrate that recent MLLMs suffer from fundamental limitations in spatial understanding and reasoning. Moreover, they exhibit significant hallucination issues in spatial reasoning, which can lead to unreliable predictions, posing a critical challenge for safety and trustworthiness in medical imaging applications.
From the SpatialMed benchmark, we emphasize that: It is necessary for the faithfulness-aware evaluation and training strategies in medical spatial reasoning.
Model Stability and Numeric Commitment. We observe that a significant subset of evaluated models frequently returned NaN results for absolute volume estimation, reflecting a fundamental limitation in producing stable, continuous numerical outputs. Rather than a failure of the benchmark format, these results highlight a lack of numeric commitment in current MLLMs, where models often prioritize qualitative recognition over calibrated quantitative measurement. This NaN behavior underscores the urgent need for specialized numeric supervision, unit-aware training objectives, and structured output constraints to make MLLMs viable for quantitative clinical applications.
5 Conclusion↩︎
In conclusion, we present SpatialMed, the first benchmark for evaluating 3D spatial reasoning in medical MLLMs, comprising 9,782 QA pairs across 2,375 CT scans. Our evaluation of 14 state-of-the-art models and extensive analyses reveals substantial limitations: even top performers achieve only modest accuracy above a random baseline, with pronounced failures in distance reasoning and numerical estimation, and the majority of reasoning chains are hallucinated. These findings demonstrate that current MLLMs lack fundamental for robust spatial reasoning in clinical applications. Future directions include spatial chain-of-thought reasoning, self-supervised spatial objectives, structured numeric output constraints, and faithfulness-aware training. We release the SpatialMed along with the dataset creation pipeline to advance spatially-aware medical AI development.
Acknowledgement. This work was supported in part by U.S. NSF grants DBI-2238093, DBI-2422619, IIS-2211597, and MCB-2205148.
Appendices
6 Prompt for Dataset Creation↩︎
In this section, we provide the additional details of the prompt for Spatial QA Generation, Filtering Process, and Trivial Validation as follows:
[Medical context retrieved from the RAG pipeline] You are a radiologist analyzing a 3D medical volume. You are given:
[a list of anatomical volumes],
[a list of distances between pairs of anatomical structures],
[a set of 3D bounding boxes].
Example question–answer pairs are provided below:
[List of example question–answer pairs]
Instruction. Based on the provided spatial information, and your knowledge for the tumor names, generate 10 question–answer pairs that require clinically meaningful spatial reasoning. The questions and answers must be medically relevant and consistent with a radiologist’s viewpoint, and must be diverse in the medical context linguistic. Return response in tempate Question: [Your question here] - Answer: [Your answer here]
You are a radiologist, and you are seeing the 3D volumes. You are given: Context: Relevant contexts to the question and answer pair
[a list of anatomical volumes],
[a list of distances between pairs of anatomical structures],
[a set of 3D bounding boxes].
You are giving a question and an answer pair: Question and answer pair
Instruction. From your knowledge, evaluate if this question and answer pairs meet these criteria: (1) contain medical content, (2) the correctness of the content with the context you know.
Return only 0 for unqualified, and 1 for qualified data.
Context: Medical Context relevant to question retrieved from RAG pipeline
You are a doctor, and you get these question and answers from the client.
Instruction: With the provided relevant context you are provided, answer the question:
Question and choices
Return the final answer only, for example, "A. liver.", do not return anything else.
For the spatial annotations input for the prompt, they are calculated by the tools, mentioned in Section 3.1.
During the generation process, by using few-shot prompting and provide the context from the RAG pipeline, the agents are provided the medical knowledge, therefore enhance the capability to generate robust medical content robust, and ensure the linguistic quality of the question-answer samples. Moreover, all of stages, we also leverage the instruction prompting template for the output, which can help us to ensure the correct format of the generation from the models.
7 Retrieved Augmented Generation Details↩︎
In terms of the Retrieved Augmented Generation pipeline, we leverage the Qwen3-8B-Embedding model [54] as the based embedding model to extract all embeddings from the text of the PubMed [45] dataset. All of the embeddings are stored via the index storage of Faiss [55]. During the inference process of the agent, the top 5 most relevant records are chosen as the input context for the agent.
8 Impact Statement↩︎
This paper introduces a new benchmark and data generation pipeline to study spatial reasoning in medical vision language models using 3D CT scans. The main goal of this work is to advance machine learning methods for understanding spatial relations in medical images, which is an important step toward more reliable AI systems in healthcare.
Potential positive impact. Improved spatial reasoning in medical AI systems may support clinical practice in several ways. Models that better understand size, distance, and relative position of anatomical structures could assist with image interpretation, treatment planning, and medical education. This may help reduce workload for clinicians and improve consistency in image based analysis. The proposed benchmark may also encourage more transparent evaluation of model limitations, which is important for safety in medical AI.
Risks and limitations. Despite these potential benefits, there are risks. First, models evaluated on this benchmark may still make errors in real clinical settings. Good performance on a benchmark does not guarantee safe or correct behavior in practice. Second, there is a risk that users may over trust model outputs, especially for quantitative values such as volume or distance. Such errors could lead to incorrect clinical decisions if systems are used without proper human oversight. The dataset is built from existing medical imaging data with segmentation masks. Although the data are processed for research use, any use of medical data raises concerns about privacy and data governance. We follow the licenses and usage rules of the source datasets. Future work should continue to consider data protection and responsible sharing.
Future societal considerations. As medical vision language models become more capable, they may be integrated into clinical tools. This increases the need for clear evaluation standards, human in the loop design, and regulatory review. Our benchmark highlights current weaknesses in spatial and numeric reasoning, which may help prevent premature deployment of unreliable systems.