High Resolution VLA Radio Observations of the Boomerang Pulsar Wind Nebula
February 23, 2026
Abstract
We present a radio polarimetric study of the Boomerang pulsar wind nebula G106.65+2.96 with VLA observations at the 6 GHz band. Our high-resolution image discovers new small-scale features in the nebula, including an elliptical core of \(40''\times20''\) surrounding the central pulsar and a \(2'\)-long arc wrapping around the core in the north. The latter shows a clear gap from the core, and it consists of a bright lobe in the northwest and a tongue-like structure in the northeast. These could be resulting from the pulsar wind interaction with the environment. Our polarization measurement reveals a highly ordered magnetic field with toroidal geometry. The small scale features are all highly linearly polarized. In particular, the lobe has a polarization fraction of \(\sim\)60%, close to the synchrotron limit. This is also much higher than the value measured at a lower frequency, implying significant depolarization. We show that this can be explained by Faraday rotation in the nebula, and we constructed a simple 3D model accordingly to infer a magnetic field strength of \(\sim\)50–105 \(\mu\)G.
1 Introduction↩︎
A pulsar is a rapidly rotating, highly magnetized neutron star produced in a supernova explosion at the end stage of massive stellar evolution. As an analog to a rotating magnet, a pulsar can create a huge electric potential around it. This accelerates charged particles to relativistic speeds, driving a magnetized outflow known as a pulsar wind [1]. The wind mainly composes of electrons and positrons. When these particles interact with the surrounding medium, either the interstellar medium or the supernova remnant (SNR), a termination shock is formed, and they are further accelerated to ultra-relativistic energies at the shock. The high energy particles then inflate a synchrotron bubble emitting from radio to X-ray bands. Such a structure is called a pulsar wind nebula (PWN).
The fast rotation of a pulsar wraps its magnetic field lines, making them nearly toroidal before reaching the termination shock [2]. Downstream of the shock, the plasma flow becomes turbulent and a poloidal \(B\)-field component emerges [3]–[5]. Observationally, this can be tested with polarimetric measurements, since PWN emission is dominated by synchrotron emission which is highly linearly polarized and the polarization angle can reveal the local magnetic field direction at the emission site. Previous observations of PWNe show a vast variety of magnetic field configurations, including a radial field [e.g., DA 495 and G21.5\(-\)0.9; [6]; [7]], a large-scale toroidal field [e.g., Vela; [8]], an elongated field aligned with the pulsar spin axis [9], and other complex structures [e.g., the Crab and G292.0+1.8; [10]; [11]]. The diverse behavior is very difficult to be explained by a unified picture.
The Boomerang (G106.6+2.9 or G106.65+2.96) is a middle-aged PWN located at the tip of the associated SNR G106.3+2.7 [12]. It is powered by pulsar J2229+6114 which has spin period \(P=51.6\) ms, spin-down rate \(\dot{P}=7.83\times10^{-14}\), surface magnetic field \(B=2.0\times10^{12}\) G, spin-down luminosity \(\dot{E}=2.2\times10^{37}\) erg s\(^{-1}\), and characteristic age \(\tau_c=10.5\) kyr [13]. In the radio band, the PWN shows an arc-like overall morphology of \(\sim3'\) long that resembles a boomerang [14]. This shape is highly unusual among PWNe, as the emission is found only on one side of pulsar, and the peak is significantly offset from the pulsar location. This is believed to be resulting from crushing of the nebula by the supernova reverse shock \(3.9\,\)kyr ago [14]. The X-ray image of the Boomerang reveals a drastically different structure: the radio core and tongue are not detected, but there is an X-ray arc of \(\sim20''\) with a jet-like feature surrounding the pulsar [13], which is interpreted as the toroidal termination shock [15], [16]. Beyond that, there is very faint, large-scale diffuse X-ray emission extending south [17]. Such morphology indicates that the X-ray nebula could be a revived or reborn PWN after the passage of the SNR reverse shock.
The Boomerang has drawn much attention in gamma-ray studies lately. Ultra-high energy photons up to 570 TeV are detected in the direction of the SNR, suggesting that this is a PeVatron—an astrophysical source that can accelerate particles up to PeV energies [18]. The exact production site and mechanism of the gamma-rays are still under debate. Previous radio observations discovered a dense Hi shell surrounding the Boomerang [12], which provides some support for a hadronic origin [17], [19], but a leptonic origin from pulsar wind is also possible [20].
Single-dish radio measurements found a spectral break for the Boomerang around 4.3 GHz [14]. This is rather uncommon. If interpreted as the synchrotron cooling break, the magnetic field strength of the Boomerang would be 2.6 mG, much stronger than the typical values of 10–100 \(\mu\)G [21], [22]. Later studies argue for a much weaker field from \(3\,\mu\)G to \(140\,\mu\)G based on pressure estimate [23] and modeling of the broadband spectrum from radio to gamma-rays [24], [25]. This implies that the 4.3 GHz break could be intrinsic instead of due to cooling. Radio polarization measurements found a toroidal configuration for the projected \(B\)-field, similar to that of the Vela PWN [8]. However, the distribution of rotation measure (RM) in the nebula prefers a radial field instead [14].
In this paper, we revisit the Boomerang PWN using high resolution radio observations taken with the Karl G. Jansky Very Large Array (VLA) to further investigate the nebular magnetic field structure. We note that in the literature there are various distance estimates for this source, ranging from 0.8 to 12 kpc [25]. We adopt 0.8 kpc in this work as this best explains the PWN and SNR morphology in radio [12], [14]. This paper is organized as following: the observation details and imaging method are described in Section 2 and the results are presented in Section 3. In Section 4, we present an interpretation of the PWN morphology, and we model the magnetic field strength and structure based on the observational results. Finally, we summarize our findings in Section 5.
2 Observation and Data Reduction↩︎
cccccc VLA array configuration & B & B & B & C
Center frequency (GHz) & 6.0 & 6.0 & 6.0 & 6.0
Bandwidth (GHz) & 4.0 & 4.0 & 4.0 & 4.0
On-source time (min) & 40 & 95 & 95 & 60
Baseline (km) & 0.18–9.9 & 0.12–10.3 & 0.24–10.7 & 0.03–3.1
\(u\)-\(v\) coverage (k\(\lambda\)) & 2.5–260 & 2–270 & 3.5–280 & 0.42–82
Flux calibrator & 3C138 & 3C286 & 3C138 & 3C138
Phase calibrator & J2148+6107 & J2148+6107 & J2148+6107 & J2148+6107
Polarization angle calibrator & 3C138 & 3C286 & 3C138 & 3C138
Polarization leakage calibrator & J2355+4950 & J1407+2827 & J2355+4950 & J2355+4950
The Boomerang PWN was observed with the Karl G. Jansky Very Large Array (hereafter: VLA) in the C band (4–8 GHz). The observations were taken in the B array configuration on 2017 Nov 3, 12, and 21, with 230 min total on-source time and in the C array configuration on 2021 Jul 11, with 60 min on-source time. We combined all data to produce high-resolution images. The \(u\)-\(v\) coverage and calibrators of the observations are listed in Table [tab:obs]. All data reduction was done using the Common Astronomical Software Application (CASA) version 6.2.1 [26]. The data were first processed with the pipeline for preliminary flaggings and standard calibrations. We then further examined and flagged the remaining suspected RFI signals, and re-calibrated the data manually. The polarization calibration was also performed manually at this stage.
All the images were generated and cleaned using the CASA task tclean. To optimize between sensitivity and resolution, we chose the Briggs weighting algorithm with robust \(=1.0\) for all the images. The
Stokes I, Q, and U maps at 6 GHz were produced by combining all the available data using the full bandwidth. Since we mainly focus on the extended emission of the PWN, we applied a Gaussian \(uv\)-taper of \(80\,{\rm k}\lambda\) to effectively smooth the images and increase sensitivity towards extended emission. The cleaned images are restored and then corrected for primary beam sensitivity. The linear polarization intensity (PI)
map is obtained by combining the Stokes Q and U maps (\({\rm PI} = \sqrt{{\rm Q}^2 + {\rm U}^2}\)), with the Ricean bias corrected [27]. Our final Stokes I and PI images at 6 GHz have a beam size of FWHM \(2\farcs3\times1\farcs8\) and rms noise of 5 \(\mu\)Jy beam\(^{-1}\). The latter is compatible with the theoretical estimate.
Forming images using the entire 4 GHz bandwidth improves the \(u\)-\(v\) coverage, but this could lead to slight bandwidth depolarization. Previous studies found that the rotation measure (RM) of the nebula is around \(-\)200 rad m\(^{-2}\) [14], therefore combining the 4–8 GHz data would cause \(\sim7\%\) depolarization1. We argue that this level is acceptable, as it is comparable to the measurement uncertainties of our observations.
To correct for foreground Faraday rotation, we divided the full band into four 1 GHz-wide subbands to generate the polarization position angle (PA) maps. The same imaging and deconvolution procedures as above were employed, but we slightly reduced the spatial resolution to boost the signal-to-noise ratio, by employing a \(uv\)-taper of 40 k\(\lambda\) and a restoring beam of FWHM \(5\farcs0\times5\farcs0\). The observed PA of the polarization vectors is calculated from the Stokes Q and U maps as \({\rm PA}=\frac{1}{2}\arctan{({\rm U}/{\rm Q})}\). A linear fit to PA values with respect to the square of wavelength (\(\lambda^2\)) gives the RM map and the intrinsic PA. We discard any fits that have RM uncertainty over 45 rad m\(^{-2}\) or intrinsic PA uncertainty over \(15^\circ\), or if the total intensity is fainter than 15 \(\mu\)Jy beam\(^{-1}\)at 6 GHz.
The same subband images in Stokes I are used to perform spectral tomography [11] to determine the spectral index of the small scale features in the Boomerang. We scaled the subband intensity maps at 4.5 and 7.5 GHz with trial spectral indices \(\alpha_t\) to form difference images. When a feature blends into the background, \(\alpha_t\) then gives its spectral index.
3 Observation Results↩︎
3.1 Source structure↩︎
![Figure 1: (a) VLA total intensity and (b) linear polarized intensity maps of the Boomerang PWN at 6 GHz. The white crosses mark the position of PSR J2229+6114. The radio images have a beam size of 2\farcs3\times1\farcs8 FWHM and rms noise of 5 mJy beam^{-1}. (c) same as (a) with different PWN features labeled. The arrow pointing west shows the pulsar spin axis direction inferred from the X-ray PWN [15]. The arrow pointing southeast indicates the direction to the relic PWN [12]. (d) Exposure corrected ChandraX-ray image of the same field, showing the central pulsar J2229+6119 and the surrounding torus.](/article/2602.20230/boomerang.png "fig:")
Figure 1a shows the 6 GHz total intensity map of the Boomerang formed using the full bandwidth of 4 GHz. Our high resolution images reveal, for the first time, the detailed structure of the PWN. We discover several bright radio features embedded in diffuse emission. In the inner PWN, PSR J2229+6114is not detected in our observations, but there is a compact radio nebula, which we call the “core”, near the pulsar position. It has an elliptical shape of \(40''\times20''\) lying along the northeast-southwest direction and has mean brightness temperature of \(\sim\)0.15 K at 6 GHz. The pulsar is located at the southeastern edge of the core. Further southeast of the pulsar, there exists a subluminous zone of \(25\arcsec\times12\arcsec\) without obvious radio emission. At the northern tip of the core, there is a hint of extended emission towards southeast. If confirmed, then the overall morphology of the core would also resemble a mini boomerang instead of merely elliptical.
In the north, there is a semicircular arc-like feature that encloses the entire core. It has a width of 20–30with a sharp boundary in the north. Its morphology closely follows that of the core, and there is a gap of \(\sim30''\) between them (see Fig. 1c). The arc can be roughly divided into two parts. The northwestern part, which we refer to as the “lobe”, is about \(120''\times40''\) in size, and it contains the peak emission of the radio PWN with a brightness temperature of up to \(\sim\)0.3 K at 6 GHz. The northeastern part of the arc is significantly fainter and smaller (\(80''\times20''\)) and is called the “tongue” in a previous study [14]. All these bright features are embedded in faint diffuse emission that fills the gap between the arc and the core. It further extends southwest in the general direction of the orientation core. The emission fades and becomes undetectable at \(3.5\arcmin\) from the pulsar.
In Figure 1d we show an X-ray image taken with the Chandra X-ray Observatory for comparison [13]. The X-ray PWN exhibits a clear torus structure with a \(\sim0.5'\) diameter [15], [16], which is significantly smaller than the radio core and has a different orientation. This is surrounded by faint diffuse X-ray emission of approximately circular shape with \(\sim2'\) diameter. The emission fills in the gap between the radio core and the arc. Its surface brightness drops radially outward and becomes undetectable near the inner edge of the radio arc.
3.2 Polarization↩︎
The PI map of the Boomerang is shown in Figure 1b. The polarized emission well follows the total intensity. The core, the lobe, and the tongue have high polarized fractions (PF) of \(\sim\)57%, \(\sim\)60% and \(\sim\)45%, respectively, and the average PF of the overall PWN is \(\sim\)50%. These values are higher than the previously reported value at a similar frequency [14], likely due to reduced beam depolarization in our high-resolution image.

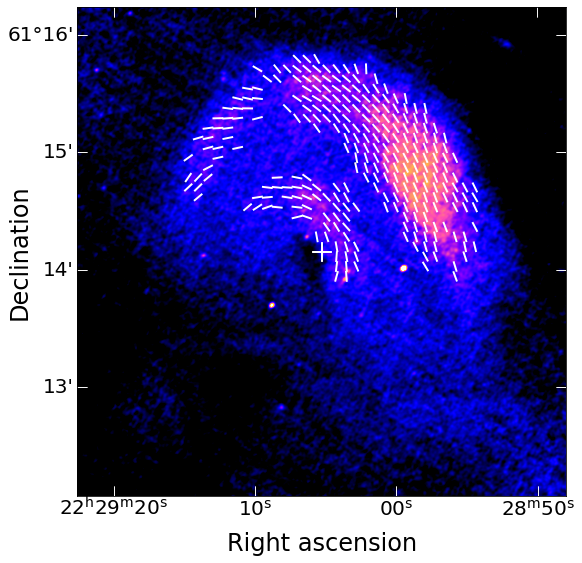
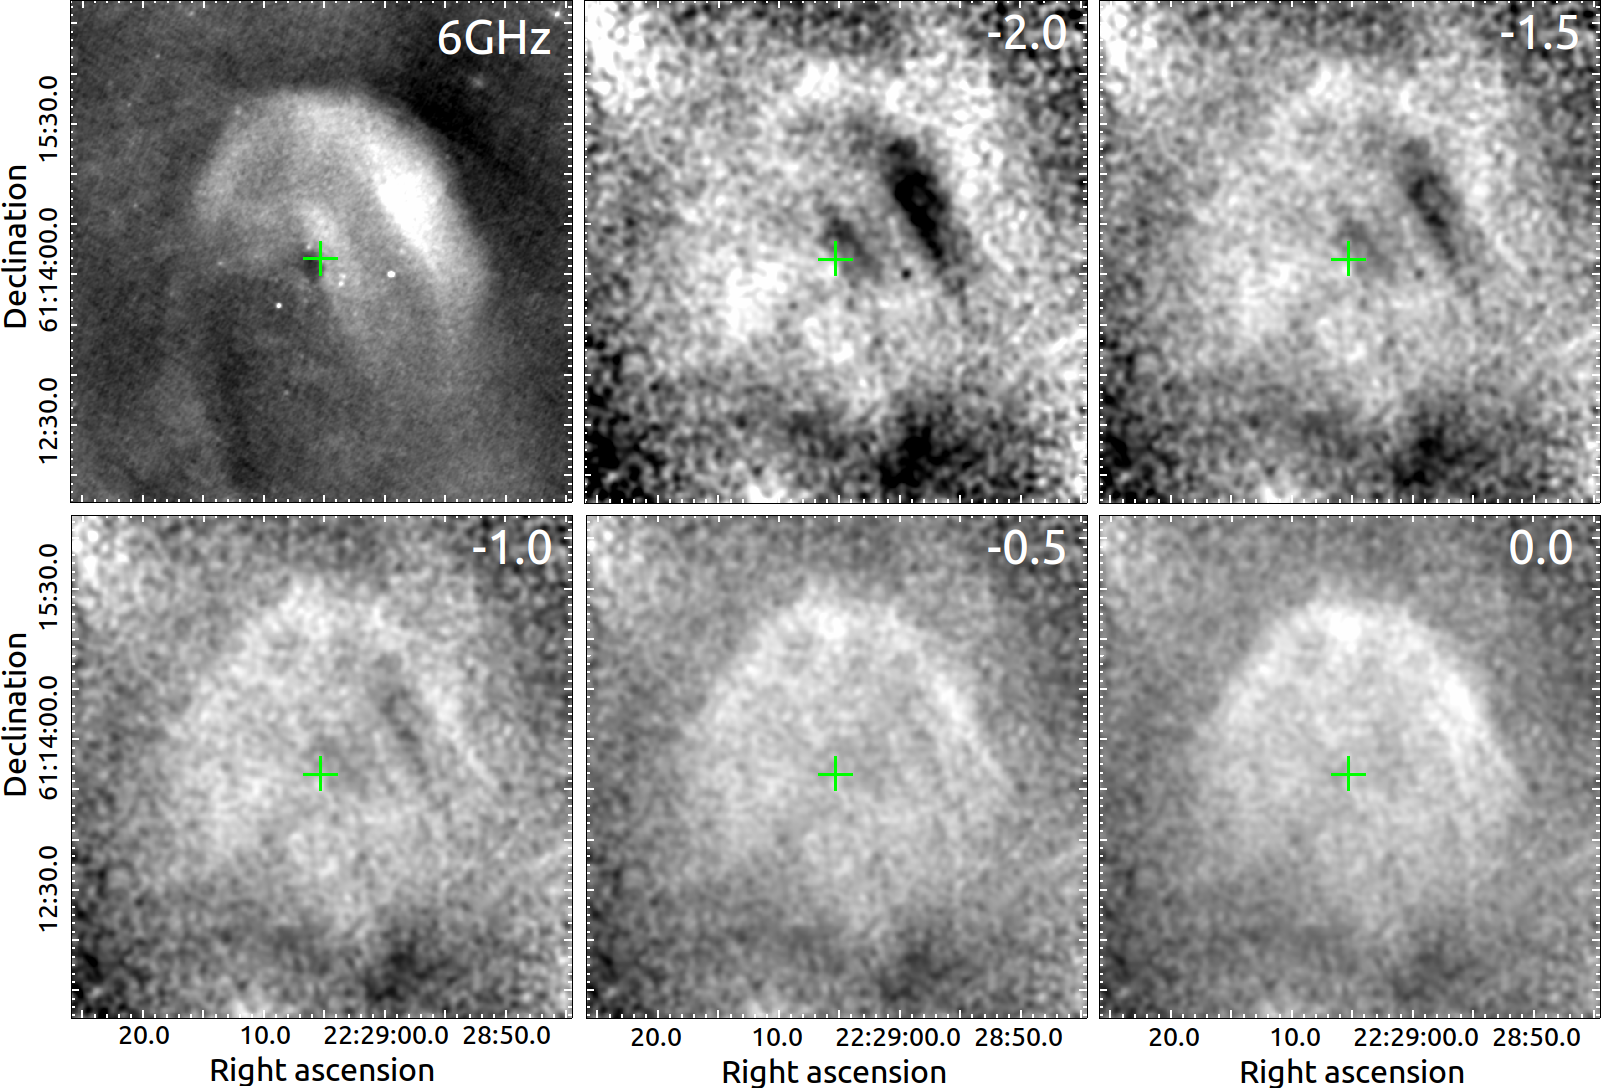
Figure 2 presents the RM map of the nebula. The RM value ranges from \(-380\) to \(-20\) rad m\(^{-2}\) across the PWN, and the measurement uncertainties are better than 45 rad m\(^{-2}\). Most region of the PWN has roughly constant RM between \(-250\) and \(-150\) rad m\(^{-2}\). This is consistent with the values of \(\sim-200\) rad m\(^{-2}\) and \(-187\) rad m\(^{-2}\) previously reported for the nebula and the pulsar, respectively [14], [28]. The core, the lobe, and the tongue have slightly different RM values (\(-230\), \(-180\), and \(-160\,\)rad m\(^{-2}\), respectively), but the discrepancy is not significant given the measurement uncertainty.
Figure 3 shows the intrinsic magnetic field orientation (PA+\(90\arcdeg\)) of the Boomerang. We find a highly ordered field structure, compatible with the large PF observed. The \(B\)-field in the core has a toroidal configuration, consistent with previous findings [14] and the prediction from the canonical PWN model [2], [29]. On the other hand, the \(B\)-field of the lobe and the tongue are mostly unidirectional. The former well follows the lobe’s elongation, while the latter mainly lies along the east-west direction, misaligned with the elongation of the tongue. The overall magnetic field structure of the lobe and the tongue shows a general toroidal geometry similar to the core but with slight distortion. For example, we would expect the field lines to curve around the northern tip, which is however not observed.
3.3 Spectrum↩︎
We measure the flux density of the overall Boomerang PWN from the 6 GHz total intensity map and obtain \(80\pm30\) mJy. The tongue, the lobe, and the core have flux densities of \(7\pm3\), \(30\pm10\), and \(9\pm3\) mJy, respectively. Here we report a rather conservative uncertainty of \(\sim\)30%, due to a highly non-uniform background affected by sidelobes. This is because the observations are only sensitive to angular scales \(\lesssim 4\arcmin\), comparable to the size of the Boomerang. Adding so the issue is that some short baselines are affected by severe RFI and hence are flagged. All these made the deconvolution process difficult. For this reason, we did not attempt to derive the in-band spectral index from our data. Instead, we estimate the spectral index using tomography. Figure 4 shows the tomography images with a few representative \(\alpha_t\). The core and the lobe show a flat spectrum with an index \(\alpha\approx -0.5\), but the tongue and the northwestern edge of the lobe have steeper spectrum of \(\alpha\approx-1.0\) and \(-1.5\), respectively. Note that these estimates could be subject to large uncertainties of \(\Delta\alpha\sim 0.2\).
4 Discussion↩︎
4.1 PWN structure↩︎
Our VLA observations discover new radio features of the Boomerang PWN, including the core, the lobe, and the tongue. The core shows radially decreasing surface brightness. This reflects decreasing magnetic field strength or particle density when the post-shock wind transports outwards in a diffusive manner, as observed in X-rays [24]. The outer arc, which consists of the lobe and the tongue, was previously only detected at 1.42 GHz but not at higher frequencies [14]. Our observations with better sensitivity clearly show its emission up to at least 6 GHz.
If we consider the core as the termination shock, then the radio emission of the Boomerang forms a double tori/arc structure similar to some X-ray PWNe, including the Crab and MSH 15\(-\)52 [30], [31]. The outer arc of the Boomerang has a radius of 0.3 pc (80at 0.8 kpc) comparable to the outer torus of the Crab of 0.4 pc radius [15], [32]. Magnetohydrodynamic simulations suggest that such a feature could represent bending of the postshock flow from the pulsar equatorial plane towards the spin axis, due to magnetic hoop stress and slowing down of the flow [3], [33], [34]. The compression enhances the particle density and \(B\)-field strength, hence forming a toroidal feature. However, we note that this is rarely seen in radio PWNe [35], [36]. For young sources, the radio structure could be disrupted by Rayleigh-Taylor instability from the pulsar wind interaction with the surrounding medium [23]. The Boomerang is believed to be a reborn PWN after the passage of the supernova reverse shock, similar to the Vela PWN [14]. The high pressure environment could suppress the instabilities, such that these two PWNe both exhibit toroidal morphology in radio [23]. In addition, our high resolution radio map found no filamentary structure in the Boomerang, adding support to the lack of instabilities. A thick torus model has been developed to explain the torodial structure of radio PWNe, and it was shown that different flow structure, viewing angle, and ambient pressure gradient can produce different PWN morphologies, from a one-sided arc to two-lobe morphology with asymmetrical brightness [22], [23].
Alternatively, the lobe could be caused by the interaction between the pulsar wind and a dense cloud in the surrounding. Previous radio observations found an Hi shell engulfing the Boomerang in the north, and the pulsar wind is directly interacting with the cloud [12]. In this scenario, the shock wave drives a shell in the cloud and accelerates high energy protons that can give rise to the observed gamma-ray emission [17]. The shock can also reaccelerate the pulsar wind to form the outer arc. This picture gains some support from our polarization results, as we found that the lobe has \(B\)-field generally parallel to its elongation, i.e.the shock front. This is similar to some young supernova remnants [37], and is suggested to be the result of shock compression.
Finally, the non-detection of PSR J2229+6114in our 6 GHz data is not unexpected. At lower frequencies it has phase-averaged flux densities of \(1.5\pm0.1\) mJy and \(0.25\pm0.08\) mJy at 350 MHz and 1412 MHz, respectively [13], [38]. These give a spectral index of \(1.3\pm0.3\). An extrapolation to 6 GHz with a simple power-law suggests \(20\pm10\,\mu\)Jy, which is comparable with the noise level of our image. The actual flux density could be lower if there is any spectral turnover between 1–6 GHz, as those gigahertz-peaked pulsars [39].
4.2 Magnetic Field↩︎
There is a previous claim that the Boomerang has radially increasing RM distribution, and a radial \(B\)-field geometry was proposed [14]. Our high resolution RM map found no evidence for such RM variation (Fig. 2). We suspect that the large beam size in the previous work (\(1\farcm15\)) could lead to artificial features because of the complex interplay between the field geometry, the source brightness, and the external Faraday dispersion. Moreover, a radial field would result in very faint emission at the center due to the small viewing angle. This is clearly incompatible with the intensity map in Fig. 1. Our result prefers a toroidal field instead. It well explains the polarization structure seen the core (see Fig. 3). For the lobe and the tongue, the \(B\)-field is mostly toroidal, albeit with slight distortion that could possibly be due to environmental effects.
Our new study finds very high PF for the Boomerang. In particular, the lobe has intrinsic PF of 67% after accounting for the \(\sim7\)% bandwidth depolarization. This is very close to the theoretical maximum of \(\sim\)70% for synchrotron radiation2, indicating a highly ordered \(B\)-field with negligible depolarization. To compare with PF measured at other frequencies in previous study, we smoothed our Stokes I, Q, and U maps to lower resolution to determine the beam depolarization effect, assuming that the relative brightness between different regions remains the same across frequency bands. The PF values after correction are listed in Table [tab:pf95corrected]. They are all near the synchrotron limit at 4.85, 8.35, and 10.45 GHz, except at 1.42 GHz which is only 33%. These are plotted verses the square of wavelength in Figure 5.
cccc
6 & \(\sim2''\) & \(67\pm11\)% & \(67\pm11\)%
1.42 & \(50''\) & \(31\pm5\)% & \(33\pm5\)%
4.85 & \(147''\) & \(37\pm5\)% & \(62\pm8\)%
8.35 & \(84''\) & \(52\pm5\)% & \(64\pm6\)%
10.45 & \(69''\) & \(50\pm6\)% & \(57\pm7\)%
The low PF at 1.42 GHz cannot be attributed to bandwidth depolarization, since the observations have small bandwidth of 10–50 MHz [12], [40], [41], which can induce at most 6% depolarization for RM=\(-200\) rad m\(^{-2}\). We therefore believe that this is due to Faraday effect, either non-uniform RM in the foreground (i.e.external Faraday dispersion) or Faraday rotation within the PWN. The former effect can be estimated by \[\label{eq:EFD} {\rm PF} = {\rm PF}_{\rm max} e^{-2\sigma_{\rm RM}^2 \, \lambda^4},\tag{1}\] where \(\sigma_{\rm RM}\) is the standard deviation of the RM values within an observing beam [42], [43]. Comparing the observed PF of 33% at 1.42 GHz with PF\(_{\rm max}=67\%\) implies \(\sigma_{\rm RM} \approx 13\,\)rad m\(^{-2}\). We derived in Appendix 6 that if the turbulence in the magnetic field follow the Kolmogorov model, then its characteristic strength \(B_{\rm ran}[\mu \rm G] \approx 2\sigma_{\rm RM} [\rm rad \,m^{-2}]\) for the observation beam size of \(50''\). This requires \(B_{\rm ran} \approx 26\,\mu\)G in the interstellar medium (ISM) along the line of sight, much higher than the typical values of a few \(\mu\)G. We therefore conclude that this scenario is rather unlikely. Note that our high resolution RM map has too large uncertainty (45 rad m\(^{-2}\)) for \(\sigma_{\rm RM}\) estimate. Better measurements are needed to determine the true value of \(\sigma_{\rm RM}\) from observation.
![Figure 5: Observed PF versus the square of wavelength. The [14] data points are corrected for beam depolarization and the line shows the best-fit Burn slab model with |RM_{\rm in}| = 43 rad m^{-2}.](/article/2602.20230/pf_model.png "fig:")
We next discuss the case that the PWN medium is Faraday thick, such that depolarization is caused by Faraday rotation within the emission volume. Here we focus on the lobe only as it dominants the observed flux. We model it as a Burn slab in the plane of the sky with uniform emissivity, density, and magnetic field [42]. The observed PF is given by \[\label{eq:burn} {\rm PF}={\rm PF}_{\rm max}\left|\frac{\sin{(\lambda^2{\rm RM}_{\rm in})}}{\lambda^2{\rm RM}_{\rm in}} \right|,\tag{2}\] where \(\lambda\) is the observation wavelength and \({\rm RM}_{\rm in}\) is the equivalent RM if the slab acts as a foreground Faraday screen [42]. Taking \({\rm PF}_{\rm max} = 67\%\), \(|{\rm RM}_{\rm in}| \approx 43\,\)rad m\(^{-2}\) is needed to explain the PF of 33% at 1.42 GHz. This is illustrated in Figure 5.
The internal RM depends on the slab thickness \(l\), the magnetic field strength along the line of sight \(B\cos\theta\), and the cold electrons density \(n_{e,{\rm cold}}\) as \[{\rm RM}_{\rm in}\approx0.812n_{e,{\rm cold}} B l \cos\theta.\] We ignore relativistic electrons since they contribute very little to the Faraday rotation [44]. \(B\) can be estimated with the standard equipartition assumption \[B_{\rm eq} = [6\pi c_{12} (1+k) L \Phi^{-1} V^{-1}]^{2/7} (\sin\theta)^{-3/7},\] where \(c_{12}\) is a constant [45], [46]. We assume the ion-to-electron energy ratio \(k=0\) and the volume filling factor \(\Phi = 1\). Using our observed flux density and spectral index of the lobe, we obtain synchrotron luminosity \(L\approx3.5\times10^{33}\,d^2_{0.8}\) erg s\(^{-1}\), assuming the emission is in the range \(6\times10^9\) to \(10^{18}\) Hz [24] at the distance \(d = 0.8\,d_{0.8}\,\)kpc. We take \(l=0.2\) pc, same as the width of the lobe. This gives the emission volume \(V \approx 6\times10^{53}\,d_{0.8}^3\) cm\(^3\), and hence \[\label{eq:b95eq95num} B_{\rm eq} \approx 53\,(\sin\theta)^{-3/7} d_{0.8}^{-2/7}\,\mu{\rm G}\tag{3}\] and \[\label{eq:n95ecold95num} n_{\rm e, cold} \approx 5.0 \, (\sin\theta)^{3/7}\,(\cos\theta)^{-1}\, d_{0.8}^{-5/7}\,{\rm cm}^{-3}.\tag{4}\]
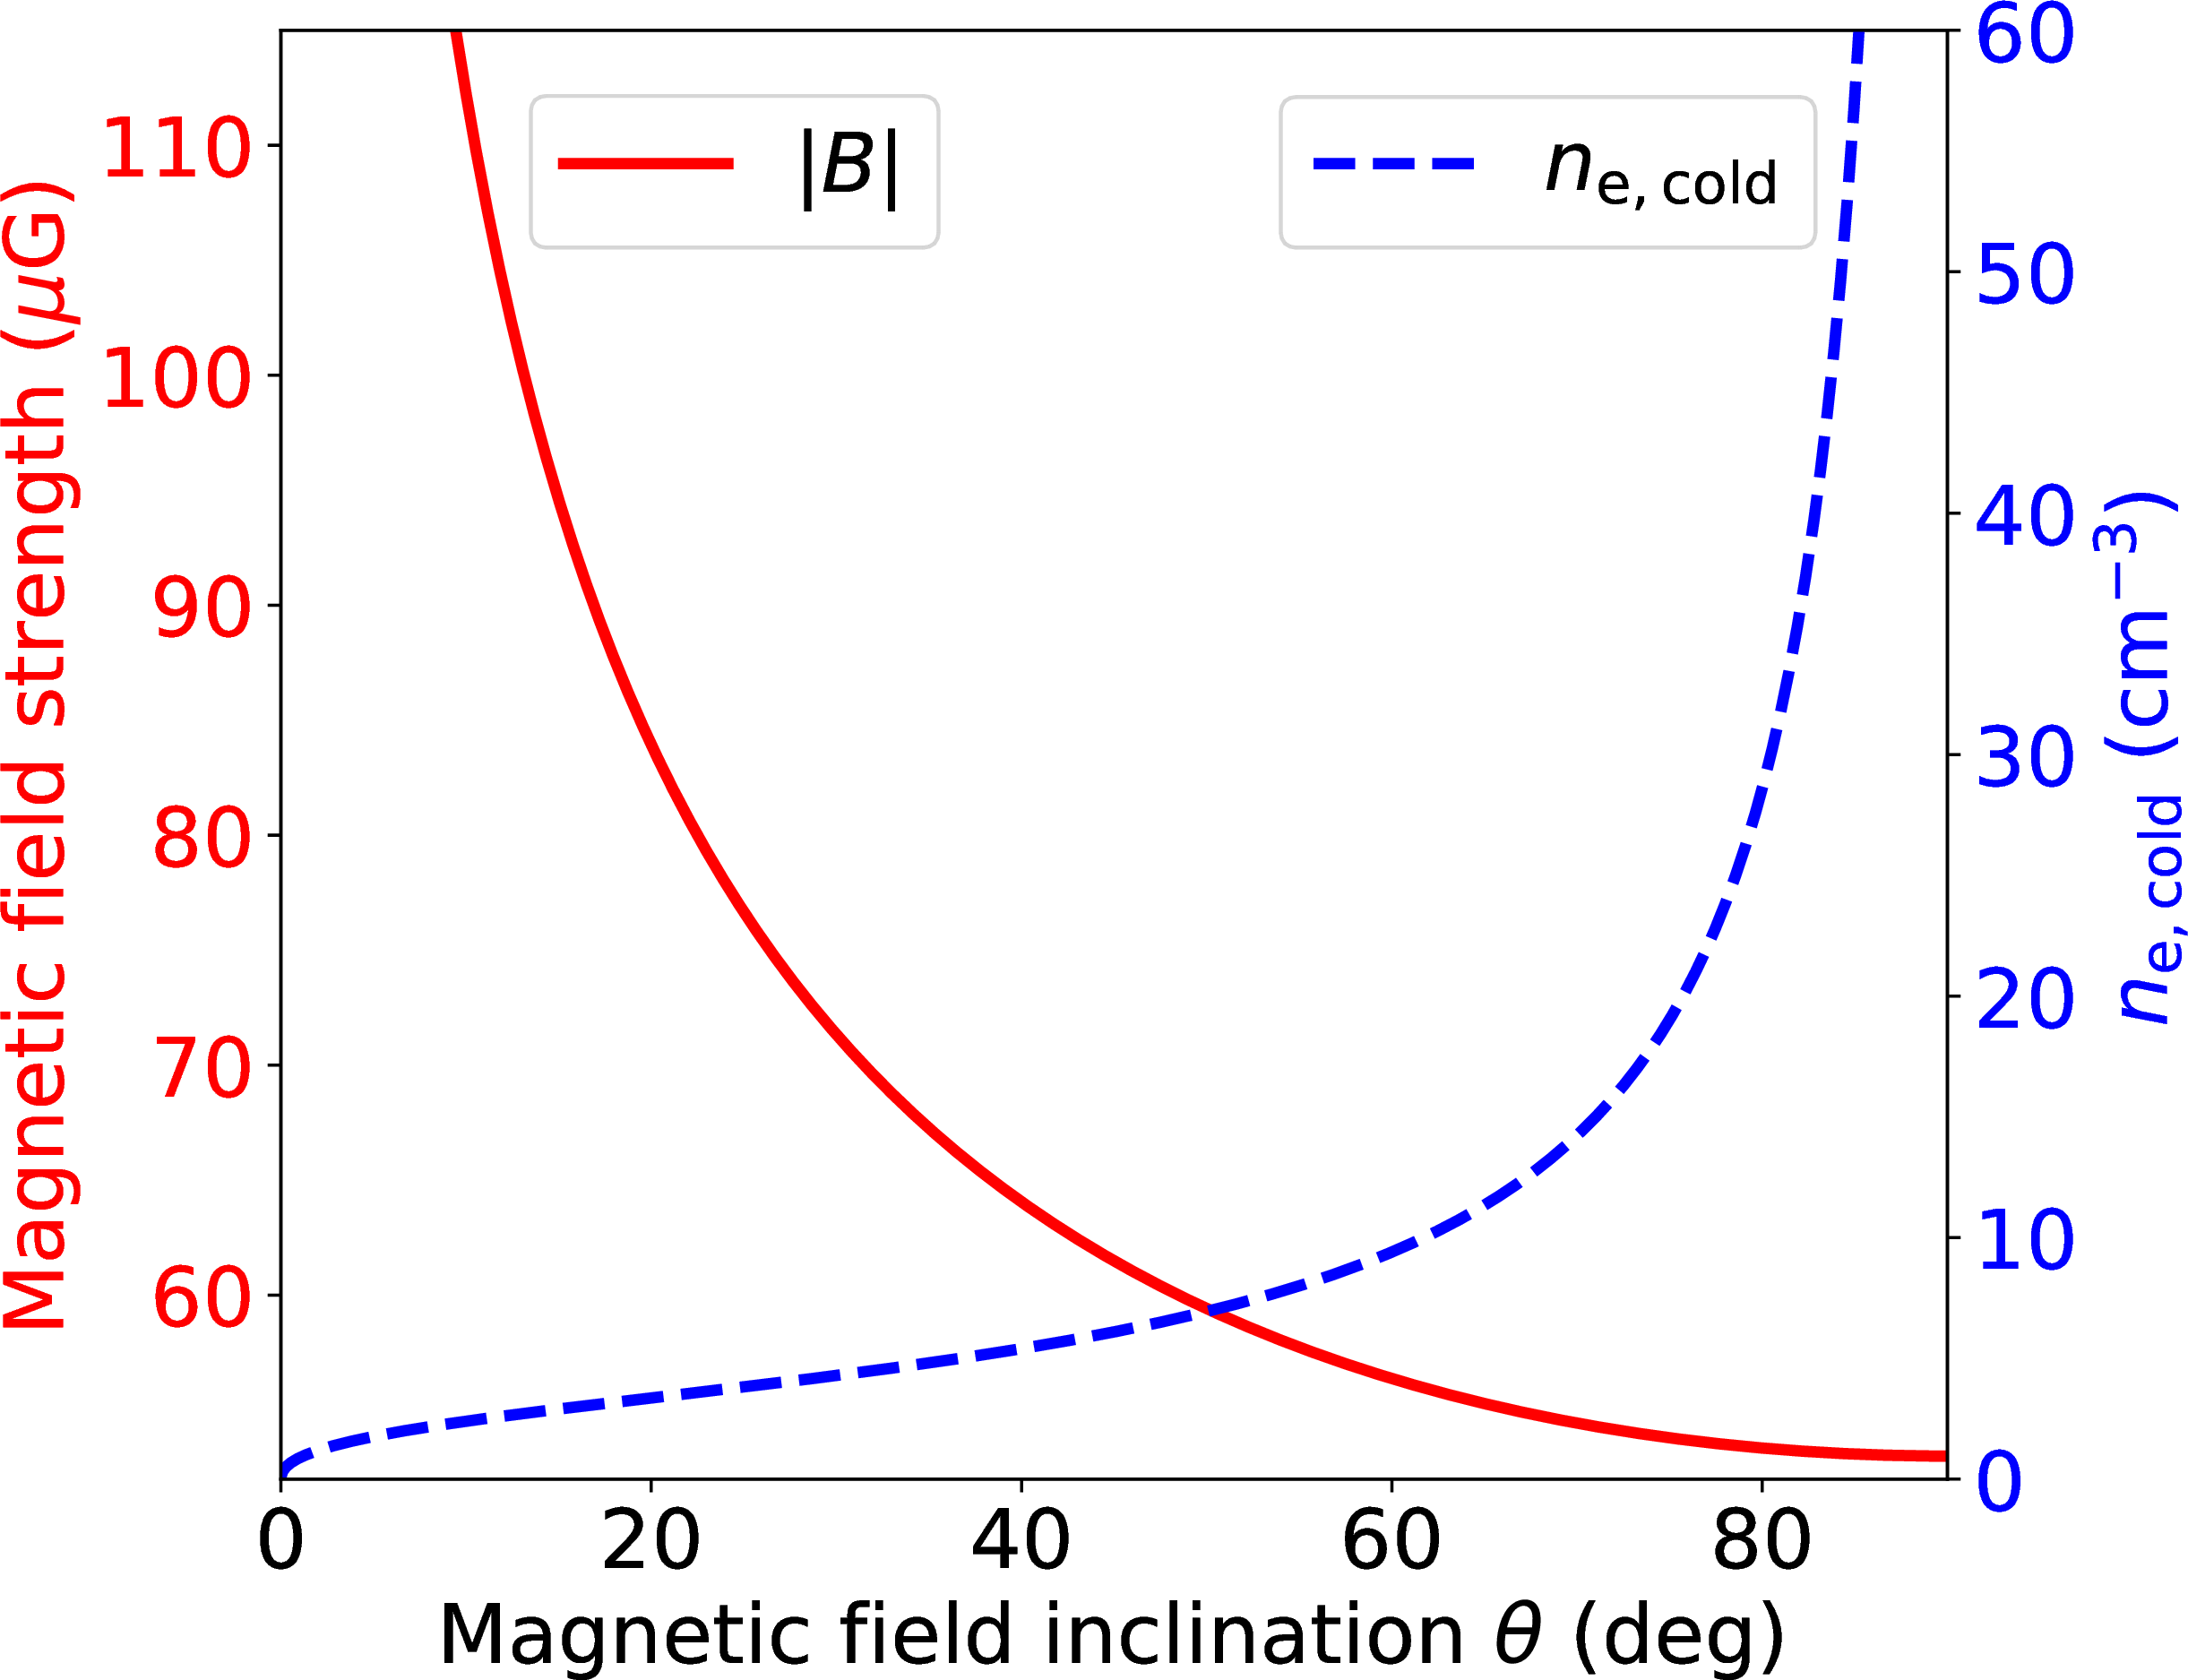
Figure 6 shows the dependence of \(B\) and \(n_{e, {\rm cold}}\) on the viewing angle \(\theta\) between the field and the line of sighte, generated by Eqs. 3 and 4 above. For random \(B\)-field orientation, there is 90% chance that \(\theta\) is between \(10^\circ\) and \(85^\circ\). This corresponds to field strength approximately between 50 and 105 \(\mu\)G and electron density of 2 to 60 cm\(^{-3}\). The former is compatible with estimates from previous study [24], [25], and the latter is feasible if the pulsar wind is mixing with the nearby Hi cloud. Note that these values weakly depend on the distance. A larger \(d=7.5\,\)kpc [25], [47] gives slightly lower \(B\) (30–55 \(\mu\)G) and lower \(n_{e, {\rm cold}}\) (0.5–12 cm\(^{-3}\)).
We could further narrow down the range of \(\theta\) if we assume that the large-scale magnetic field is toroidal following the X-ray torus orientation. The latter has an inclination angle of \(46^\circ\) and the projected axis has position angle of \(77^\circ\) (north through east) [15]. Consider the peak emission of the lobe which is at a position angle of \(50\pm10^\circ\) from the pulsar, the local \(B\)-field direction has inclination angle of \(\theta = 65\pm8^\circ\)3. Combining with the modelling result, the magnetic field strength of the lobe is \(56\pm2\) \(\mu\)G, and the electron density \(n_e = 12\pm4\,\)cm\(^{-3}\).
5 Conclusion↩︎
We present a high resolution radio study of the Boomerang using VLA observations at 6 GHz. We discover that the radio PWN consists of a compact core surrounding the pulsar and a bright lobe with a tongue. The latter two form an outer arc of \(\sim2'\) diameter. Such structure is rather uncommon among PWNe. We suggest that the arc could be either intrinsic due to the flow structure, or due to the environment, either interaction with the supernova reverse shock or with the surrounding dense cloud. Our polarization measurement reveals a nebular \(B\)-field that is mostly toroidal, consistent with what conventional theories predict. We also find a high PF at 6 GHz close to the synchrotron limit, implying a highly ordered \(B\)-field structure. On the other hand, the PF at 1.42 GHz is significantly lower. We attribute the discrepancy to Faraday rotation within the emission volume. This allows us to constrain the \(B\)-field to be within 50 to 105 \(\mu\)G. If we further assume that the lobe is part of a toroidal structure, then we can infer a field strength of \(\sim56\,\mu\)G.
We thank Roland Kothes for providing us the data of their previous observations on the Boomerang PWN. PCWL is supported by a UCL Graduate Research Scholarship and a UCL Overseas Research Scholarship. C.-Y. N. and S. Zhang are supported by GRF grants of the Hong Kong Government under HKU 7301723 and HKU 17304524. The National Radio Astronomy Observatory is a facility of the National Science Foundation operated under cooperative agreement by Associated Universities, Inc.
6 External Faraday Dispersion↩︎
To derive the expected external Faraday dispersion, we first find the suitable RM structure function that describes the Boomerang PWN. The RM structure function is defined as \[D_{\rm RM}(\delta \theta) = \langle [{\rm RM}(\theta) - {\rm RM}(\theta+\delta\theta)]^2 \rangle_\theta \;.\] It describes the mean squared difference of RM at two positions given a angular separation of \(\delta \theta\).
The RM structure function is derived by [48] assuming a turbulent interstellar medium that follows the Kolmogorov model, and we find the values of the parameters following the procedures in [7]. The RM structure function can be expressed as \[\label{eq:rm32structure} \begin{align} D_{\rm RM} (\delta \theta)= &\Bigg\{ 251.226 \Bigg[ \left( \frac{n_{e}}{0.1\,{\rm cm}^{-3}} \right)^2 \left( \frac{C_B^2}{10^{-13}\,{\rm m}^{-2/3}\,\mu{\rm G}^2} \right) \\ &+ \left( \frac{B_{\|}}{\mu{\rm G}} \right)^2 \left( \frac{C_n^2}{10^{-3}\,{\rm m}^{-20/3}} \right) \Bigg] \\ &+ 23.043 \left( \frac{C_n^2}{10^{-3}\,{\rm m}^{-20/3}} \right) \\ &\times \left( \frac{C_B^2}{10^{-13}\,{\rm m}^{-2/3}\,\mu{\rm G}^2} \right) \left( \frac{l_0}{\rm pc} \right)^{2/3} \Bigg\} \\ &\times \left( \frac{L}{\rm kpc} \right)^{8/3} \left( \frac{\delta\theta}{\rm deg} \right)^{5/3}, \end{align}\tag{5}\] where \(n_e\) is the mean density of the medium, \(B_\parallel\) is the mean magnetic field strength of the line-of-sight component, \(L\) is the distance to the source, \(l_0\) is the outer scale of the Kolmogorov turbulence, \(C_n^2\) and \(C_B^2\) is related to the level of fluctuation in density and magnetic field, respectively [48]. In particular, \(C_B^2\) can be expressed as \(C_B^2 = 5.2B_{\rm ran}^2 (l_0)^{-2/3} \times 10^{-13}\,\) m\(^{-2/3}\,\mu\)G\(^2\), where \(B_{\rm ran}\) is the strength of the random \(B\)-field.
From observations of the host pulsar of the Boomerang PWN PSR J2229+6114, we know \({\rm DM} = n_e L \approx 205\,\)pc cm\(^{-3}\) [49] and \(|{\rm RM}| \approx 0.812 \, n_e |B_\parallel| L = 187\,\)rad m\(^{-2}\) [28]. Given the distance to the Boomerang PWN is \(L = 800\,\)pc [12], \(n_e \approx 0.26\,\)cm\(^{-3}\) and \(|B_\parallel| \approx 1.1\,\mu\)G. We further adopt \(l_0 = 3.6\,\)pc and \(C_n^2 = 10^{-3}\,\)m\(^{-20/3}\) as suggested in [48]. \(B_{\rm ran}\) of the interstellar medium varies quite a lot depending on the location, but is in general smaller than 10 \(\mu\)G [48], [50]. Putting the values back into Eq. 5 , we get \[\label{eq:rm32structure2} D_{\rm RM}(\delta \theta) \approx \Bigg[ 2.33 \left( \frac{B_{\rm ran}}{\mu{\rm G}} \right)^2 + 0.18 \Bigg] \left( \frac{\delta\theta}{1'} \right)^{5/3} \,{\rm rad}^2\,{\rm m}^{-4}.\tag{6}\]
Given a circle with angular size \(r\), the expected value of \(D_{\rm RM}\) between two randomly selected points within the circle can be expressed as \[\begin{align} \langle D_{\rm RM} \rangle_r &= & \langle ({\rm RM}_i - {\rm RM}_j)^2 \rangle_r \nonumber \\ &=& 2 \langle {\rm RM}^2 \rangle_r - 2 \langle {\rm RM} \rangle^2_r \nonumber\\ &=& 2 \sigma_{\rm RM}^2, \end{align}\] where \(\sigma_{\rm RM}\) is the standard deviation of RM within a beam that we want to find for Eq. 1 . With Eq. 6 , we calculate \(\langle D_{\rm RM} \rangle_r\) using Monte Carlo simulation and found \(\langle D_{\rm RM} \rangle_{r = 50''} \approx 0.51 B_{\rm ran}^2\). Therefore, we obtain \[\sigma_{\rm RM} \, [{\rm rad}\,{\rm m}^{-2}] \approx 0.5 B_{\rm ran} \, [\mu{\rm G}].\]
References↩︎
The bandwidth depolarization fraction is given by \(f_{\rm depol} = 1 - \sin{(\Delta \theta)}/\Delta \theta\), where \(\Delta \theta = 2{\rm RM}c^2 \Delta \nu/\nu_{\rm c}^3\), \(\nu_{\rm c}\) is the center frequency and \(\Delta \nu\) is the bandwidth.↩︎
For synchrotron radiation, the maximum PF depends on the spectral index \(\alpha\) as PF\(=(1+\alpha)/(5/3+\alpha)\). Adopting \(\alpha=0.59\) [14] gives PF\(\approx\)70%.↩︎
\(\cos\theta = \sin\theta^\prime \sin i\), where \(\theta^\prime\) is the position angle of the lobe on the equatorial plane of the torus, \(i=46\arcdeg\) is the torus inclination angle, \(\tan\theta_{\rm obs} = \tan\theta^\prime \cos i\), and \(\theta_{\rm obs}\) is the observed angle difference between the torus axis and the direction of the lobe.↩︎