Are Whitepaper Claims Reflected in Market Structure? A Contamination-Aware Pipeline and a Power-Limited Null
January 28, 2026
Abstract
Do the functional narratives in cryptocurrency whitepapers correspond to how their tokens behave in markets? We develop a content-verified, contamination-aware pipeline for measuring structural correspondence between project narratives and market structure, and report two results. The first is a cautionary one. An apparent entity-level signal in an earlier version of our corpus—specialised tokens appearing to align more strongly than broad infrastructure tokens—was entirely an artifact of corpus contamination: roughly a quarter of the documents were failed-download stubs or wrong-document whitepapers (for example, a “Cosmos” entry that was in fact Binance Smart Chain text), and the apparent ordering does not survive content verification: on the clean corpus no token registers as helping alignment. We therefore report it as a contamination diagnosis, not a finding. The second is an honest null. Combining zero-shot NLP classification of 43 content-verified whitepapers across 10 semantic categories with seven cross-sectional market-structure statistics computed from hourly data (17,543 timestamps, 2023–2024), and aligning the two spaces with Procrustes rotation and Tucker’s congruence coefficient (\(\phi\)), we do not detect a significant claims–market alignment in this \(n = 43\) sample (dimension-matched \(\phi = 0.303\), zero-padded \(\phi = 0.223\); both non-significant). A positive-control and power analysis shows the binding constraint is the low reliability of the text instrument: the minimum detectable effect is \(\phi \approx 0.66\), well above the observed \(\approx 0.22\). This is absence of evidence for alignment, not evidence of its absence—we can reject strong alignment (\(\phi \geq 0.70\)) but cannot distinguish weak alignment (\(\phi \approx 0.3\)) from none. A positive-control simulation confirms the estimator recovers injected cross-domain congruence almost exactly, so the non-detection reflects limited power rather than an insensitive pipeline. We frame the contribution as a method plus a cautionary tale for text-based studies of narrative–market structural correspondence, which routinely operate below an unstated detectability floor.
Keywords: Cryptocurrency, Narrative Economics, NLP, Procrustes Rotation, Tucker’s Congruence Coefficient, Zero-Shot Classification, Power Analysis, Corpus Contamination
JEL Codes: G14, G12, C38, C45
Are Whitepaper Claims Reflected in Market Structure?
A Contamination-Aware Pipeline and a Power-Limited Null
Murad Farzulla1,2,*
1Dissensus, London, UK 2King’s College London, London, UK
*Correspondence: murad@dissensus.ai ORCID: 0009-0002-7164-8704
June 2026
Acknowledgements. The author acknowledges Claude (Anthropic) for assistance with pipeline development, mathematical exposition, and technical writing. All errors, omissions, and interpretive limitations remain the author’s responsibility.
Data & Code Availability. Reproducible code and data are available at https://github.com/studiofarzulla/whitepaper-claims.
1 Introduction↩︎
Cryptocurrency projects typically articulate their value propositions at inception, in whitepapers that make explicit claims about functionality, use cases, and technical architecture. Unlike equities, whose fundamentals emerge gradually through earnings reports and analyst coverage, these founding documents are often the first and most detailed statement of what a token is for, and they should, in principle, relate to how the asset subsequently behaves in markets. Whether they do is an open question. The efficient-market view [1] holds that informative narratives are quickly impounded into prices; [2] argues instead that “narrative economics” can decouple prices from fundamentals; and [3] documents significant price–sentiment correlations across nearly two thousand cryptocurrencies.
This tension motivates our research question: are whitepaper claims reflected in market structure? We measure contemporaneous structural correspondence between two representational spaces—a claims matrix \(\mathbf{C} \in \mathbb{R}^{N \times K}\) obtained from zero-shot classification of whitepaper text across \(K = 10\) semantic categories, and a market-statistics matrix \(\mathbf{S} \in \mathbb{R}^{M \times J}\) of \(J = 7\) cross-sectional financial metrics—aligning them with Procrustes rotation and comparing them with Tucker’s congruence coefficient \(\phi\). This is a test of structural alignment between two spaces, not of prediction or forecasting.
We report two results. The first is a cautionary tale. An apparent entity-level signal in an earlier version of our corpus—specialised tokens appearing to align more strongly than broad infrastructure tokens—was entirely an artifact of corpus contamination. Roughly a quarter of the documents were failed-download stubs or wrong-document whitepapers (for example, a “Cosmos” entry that was in fact Binance Smart Chain text), and the apparent ordering does not survive content verification: on the clean corpus no token registers as helping alignment. We report it as a contamination diagnosis, not a finding. The second is an honest null. On \(n = 43\) content-verified whitepapers matched to hourly market data (17,543 timestamps, 2023–2024), we do not detect a significant claims–market alignment (dimension-matched \(\phi = 0.303\), zero-padded \(\phi = 0.223\); both non-significant). A positive-control and power analysis shows the binding constraint is the low reliability of the text instrument: the realistic minimum detectable effect is \(\phi \approx 0.66\), far above the observed \(\approx 0.22\). This is absence of evidence for alignment, not evidence of its absence—we can reject strong alignment (\(\phi \geq 0.70\)) but cannot distinguish weak alignment (\(\phi \approx 0.3\)) from none.
Contributions. (1) We introduce a content-verified, contamination-aware pipeline for comparing textual and market representational spaces in cryptocurrency research, together with a positive-control and power apparatus that bounds what such a comparison can detect. (2) We report a power-limited non-detection of claims–market alignment on a clean corpus. (3) We show how undetected corpus contamination can manufacture a spurious cross-sectional result, motivating content-level corpus verification as a precondition for text–market analysis.
The remainder is organised as follows. Section 2 reviews related work; Section 3 describes the data; Section 4 sets out the pipeline; Section 5 reports the results; and Sections 6–7 interpret and conclude. The extended methodology, the full robustness battery, and an extended discussion are relocated to the Supplementary Appendix.
2 Related Work↩︎
Our question sits between two readings of how narrative relates to price: the efficient-market view, on which informative narratives are quickly impounded [1], and Shiller’s narrative economics, on which stories can decouple price from fundamentals [2]. Prior whitepaper research is largely cross-sectional and at issuance—technical depth and informativeness predict ICO success and post-listing returns [4]–[6]—whereas we test correspondence with ongoing market structure; notably, [7] find that whitepaper-based clustering does not separate time-series dynamics. Methodologically we draw on Procrustes rotation [8] and Tucker’s congruence coefficient [9], [10], using the latter’s thresholds (\(\geq 0.65\) moderate, \(<0.65\) weak/none) as rough benchmarks. The full survey—cryptocurrency narratives and sentiment, NLP in finance, factor and tensor models, and factor-comparison methods—is given in Supplementary Appendix 8.
3 Data↩︎
Market data. We collect hourly OHLCV data via the Binance API (through CCXT) for 49 cryptocurrency assets spanning 1 January 2023 to 31 December 2024, yielding 17,543 timestamps per asset; selection follows liquidity and data-availability criteria and spans major coins (BTC, ETH) alongside a diverse set of DeFi, infrastructure, and utility tokens. Table 1 summarises the dataset.
| Dimension | Value |
|---|---|
| Assets (market data) | 49 |
| Assets (whitepapers, content-verified) | 43 |
| Assets (common intersection) | 43 |
| Time period | Jan 2023 – Dec 2024 |
| Timestamps (hourly) | 17,543 |
| Market features (OHLCV) | 5 |
| Derived statistics | 7 |
| Narrative categories | 10 |
Whitepaper corpus. We collect and content-verify whitepapers for 43 assets that have both an official foundational document and matched market data (AAVE, ADA, ALGO, API3, ARB, ATOM, AVAX, BTC, COMP, CRV, DOT, ETH, FIL, GRT, ICP, LINK, MKR, NEAR, SC, SOL, STORJ, UNI, XMR, ZEC, and others; the full list is in Appendix 15, with corpus statistics in Supplementary Table 10). Each document is verified for word count and correct-project provenance (right-document, name-match) before inclusion, after an earlier version of the corpus was found to contain failed-download stub and wrong-document files. PDF text is extracted with sentence-level tokenisation; assets without extractable PDFs use the official markdown documentation. Intersecting the verified corpus with the market panel (\(n = 49\)) yields 43 common assets for alignment (Table 2); six market-panel assets are retained for the tensor calibration base but lack a usable whitepaper, and several verified whitepapers (e.g.AR, DCR, ZIL) lack matched market data and are excluded.
| Data Source | Assets | Notes |
|---|---|---|
| Whitepaper corpus (verified) | 43 | Content-verified documents |
| Market data (Binance) | 49 | 2-year hourly OHLCV |
| Tensor factors (CP) | 49 | Rank-2 decomposition (calibration base) |
| NLP \(\cap\) Market | 43 | Primary analysis sample |
| Market-only | 6 | Market data, no usable whitepaper |
4 Methodology↩︎
The reported pipeline has three stages: (i) NLP claims extraction, (ii) market-statistics computation, and (iii) Procrustes alignment with congruence testing. We additionally build a market tensor and its CP decomposition, but—for the reasons given in the scope note below—this is not aligned against the claims; it serves only as a real-data base for the positive-control power calibration (Section 4.4). The tensor construction, CP/ALS decomposition, rank selection, and Tucker decomposition are set out in full in Supplementary Appendix 9.
4.0.0.1 Scope of the factor representation.
We do not report a factor-based alignment leg. Under the global feature-slice normalisation used to build the tensor, the CP factor matrix is degenerate for raw-scale OHLCV features: Bitcoin’s level dominates the leading factor (a multi-sigma loading against a near-zero mean), so the asset-factor space mostly re-expresses Bitcoin’s magnitude rather than a portable latent structure. We therefore restrict the letter’s reported correspondence to the claims–statistics comparison, and retain the factor matrix only as a calibration base for the positive control (Sections 4.4 and 5.3), where the quantity of interest is the estimator’s ability to recover an injected congruence, not the base matrix’s own loadings.
4.1 NLP Claims Extraction↩︎
We classify whitepaper text with BART-large-MNLI [11] for zero-shot classification via the HuggingFace Transformers library.1 Documents are segmented into 500-word chunks and each chunk is scored against ten domain-relevant categories (Store of Value, Medium of Exchange, Smart Contracts, DeFi, Governance, Scalability, Privacy, Interoperability, Data Storage, Oracle Services; Supplementary Table 5), following the entailment approach of [13]. For text segment \(t\) and labels \(\{l_1,\dots,l_K\}\) we use the probability-weighted profile \(P(l_k\mid t)=\exp(s_k)/\sum_j \exp(s_j)\) rather than argmax, then aggregate across an asset’s chunks: \[c_{nk} = \frac{1}{|T_n|} \sum_{t \in T_n} P(l_k \mid t),\] yielding the claims matrix \(\mathbf{C} \in \mathbb{R}^{N \times K}\). Classifier reliability is the binding constraint on this study (Section 4.4): inter-model top-1 agreement against DeBERTa-v3 is fair (\(\kappa = 0.25\); 68% at relaxed top-3), and a three-method comparison (BART-NLI, sentence embeddings, a local LLM) gives mean pairwise \(r \approx 0.31\). The full validation—taxonomy, inter-model agreement, multi-method correlations, and per-category breakdown—is in Supplementary Appendix 10.
4.1.0.1 Contamination-aware verification protocol.
The more consequential data-quality issue is not text sparsity but contamination. In assembling the content-verified corpus we screened every document on two content-level criteria computed from the extracted text (not file metadata): a word-count threshold, which removes failed-download stub pages masquerading as whitepapers; and a project-name provenance check, which removes wrong-document files (most consequentially a GitHub-fallback retrieval that substituted the Binance Smart Chain whitepaper for Cosmos, together with wrong-document files for ADA, NEAR, and GRT). Assets failing verification were re-collected from genuine sources or dropped. This protocol is the precondition for the analysis below; Section 5 shows that omitting it manufactures a spurious cross-sectional result (further detail in Appendix 16).
4.2 Market Statistics↩︎
For each asset we compute seven summary statistics and z-normalise them cross-sectionally (across assets): mean return \(\bar{r}_a\); volatility \(\sigma_a\); annualised Sharpe ratio \(\text{SR}_a = (\bar{r}_a/\sigma_a)\sqrt{252\cdot 24}\); maximum drawdown \(\text{MDD}_a\); average volume \(\bar{V}_a\); vol-of-vol \(\sigma_{\sigma,a}\) (rolling-volatility standard deviation); and price trend \(\beta_a\) from \(P_t = \alpha + \beta t + \epsilon\). This yields the statistics matrix \(\mathbf{S} \in \mathbb{R}^{M \times 7}\).
4.3 Procrustes Alignment and Tucker’s \(\phi\)↩︎
Definition 1 (Orthogonal Procrustes Problem). Given matrices \(\mathbf{A}, \mathbf{B} \in \mathbb{R}^{n \times p}\), find orthogonal \(\mathbf{Q} \in \mathbb{R}^{p \times p}\) minimising \(\|\mathbf{A}\mathbf{Q} - \mathbf{B}\|_F^2\).
Theorem 1 ([8]). The optimal rotation is \(\mathbf{Q}^* = \mathbf{U}\mathbf{V}^\top\) where \(\mathbf{U}\boldsymbol{\Sigma}\mathbf{V}^\top = \text{SVD}(\mathbf{A}^\top\mathbf{B})\).
Proof. See Appendix 13. ◻
After alignment we compute the congruence coefficient between aligned columns, \[\phi(\mathbf{x}, \mathbf{y}) = \frac{\sum_i x_i y_i}{\sqrt{\sum_i x_i^2 \cdot \sum_i y_i^2}},\] which equals cosine similarity without mean-centring (so sign and magnitude both carry meaning), and report the mean absolute \(\phi\) across columns. Following [10] we read \(|\phi| \geq 0.65\) as moderate similarity and \(|\phi| < 0.65\) as weak or none.2
4.3.1 Dimension Handling↩︎
When the two spaces differ in column dimension we zero-pad the smaller matrix before alignment (e.g.padding the 7-dimensional statistics matrix with three zero columns to match the 10-dimensional claims matrix). This preserves all information but introduces a downward bias in \(\phi\), since padded dimensions contribute nothing to the numerator. We report this zero-padded estimator as a deliberately conservative lower bound and, as our primary estimate, a matched-dimension variant that SVD-reduces the higher-dimensional matrix with no padding (Supplementary Appendix 11); the two differ by a mechanical factor of about \(1.4\times\).
4.4 Power and Inference↩︎
With \(n = 43\) common entities, statistical power to detect alignment is limited. A positive-control Monte Carlo (500 iterations per effect size, 200 permutations each; seed 20260627; Section 5.3) injects a known cross-domain congruence of magnitude \(\phi\) into the real factor matrix and pushes it through the unmodified pipeline. We report power under two instruments: an ideal instrument (clean signal, isolating estimator sensitivity) and a realistic instrument whose claims side is attenuated by the measured classifier reliability (\(\rho \approx 0.31\)):
| True \(\phi\) | Power (ideal) | Power (realistic, \(\rho = 0.31\)) |
|---|---|---|
| 0.20 | 31% | 10% |
| 0.30 | 62% | 20% |
| 0.50 | 99% | 52% |
| 0.65 | 100% | 79% |
| 0.80 | 100% | 96% |
The estimator itself is sensitive: under an ideal instrument the minimum detectable effect (80% power, \(\alpha = 0.05\)) is \(\phi \approx 0.40\). The binding constraint is the noisy claims instrument, whose low reliability raises the practical minimum detectable effect to \(\phi \approx 0.66\). The study is thus adequately powered (\(>\)80%) to detect strong alignment (\(\phi \geq 0.70\)); the moderate-similarity threshold \(\phi = 0.65\) falls just below the realistic detection limit. Our null should therefore be read cautiously: we can confidently reject strong alignment but cannot distinguish weak alignment (\(\phi \approx 0.3\)) from none.
Significance is assessed by a one-sided permutation test (permute rows of \(\mathbf{B}\), recompute \(\phi\); \(B = 1000\); \(p = \frac{1}{B}\sum_b \mathbf{1}[\phi^{(b)} \geq \phi^*]\), testing \(H_0\): \(\phi \leq \phi_{\text{random}}\)). We also computed percentile bootstrap CIs but do not report them as headline quantities: small-sample Procrustes resampling induces a documented upward bias whose lower bound can exceed the point estimate (Supplementary Appendix 11.11). All stochastic procedures use fixed seeds (42 for CP-ALS, tensor operations, and permutation tests); implementation is Python 3.11+ with NumPy, SciPy, TensorLy, scikit-learn, and HuggingFace Transformers. Code and data: https://github.com/studiofarzulla/whitepaper-claims.
5 Results↩︎
We report the three load-bearing results—the bounded null on the claims–statistics leg, the collapse of the apparent entity-impact ordering under verification, and the positive control—and point to the Supplementary Appendix for the claims matrix, temporal stability, feature importance, and the full robustness battery (subsample stability, Bitcoin sensitivity, alternative metrics, jackknife, market-cap control, multiple-testing), all of which corroborate the null.
5.1 Primary Alignment: A Bounded Null↩︎
Table 3 reports the claims–statistics alignment under the conservative zero-padded estimator.
| Comparison | \(\boldsymbol{\phi}\) | p-value | Interpretation |
|---|---|---|---|
| Claims–Statistics | 0.223 | 0.459 | Weak |
Note: the \(p\)-value is a one-sided permutation test (\(B = 1000\)). We omit bootstrap confidence intervals from the headline table: small-sample Procrustes resampling produces a documented upward bias (Supplementary Appendix 11.11) that renders the percentile interval incoherent—its lower bound can exceed the point estimate.
Because the claims (10D) and statistics (7D) spaces differ in dimension, the zero-padded coefficient is mechanically deflated; Table 3 reports it as a conservative lower bound. Our primary, matched-dimension estimate (SVD-reduction, no padding; Supplementary Appendix 11) is claims–statistics \(\phi = 0.303\) (\(p = 0.353\)). Under either estimator the comparison is weak (\(\phi \leq 0.30\)) and non-significant, well below the \(0.65\) moderate-similarity threshold. At this sample size we read this as a non-detection—whatever cross-sectional market structure exists is not registered in whitepaper content—while noting that a weak sub-threshold effect cannot be excluded (Section 4.4). The positive control (Section 5.3) confirms the estimator recovers an injected cross-domain congruence, so this non-detection reflects limited power, not an insensitive pipeline.
5.2 Entity-Level Analysis: An Ordering That Did Not Survive↩︎
The sharpest illustration of why corpus verification matters is the entity-level analysis. Figure 1 shows leave-one-out entity impact before and after content verification.
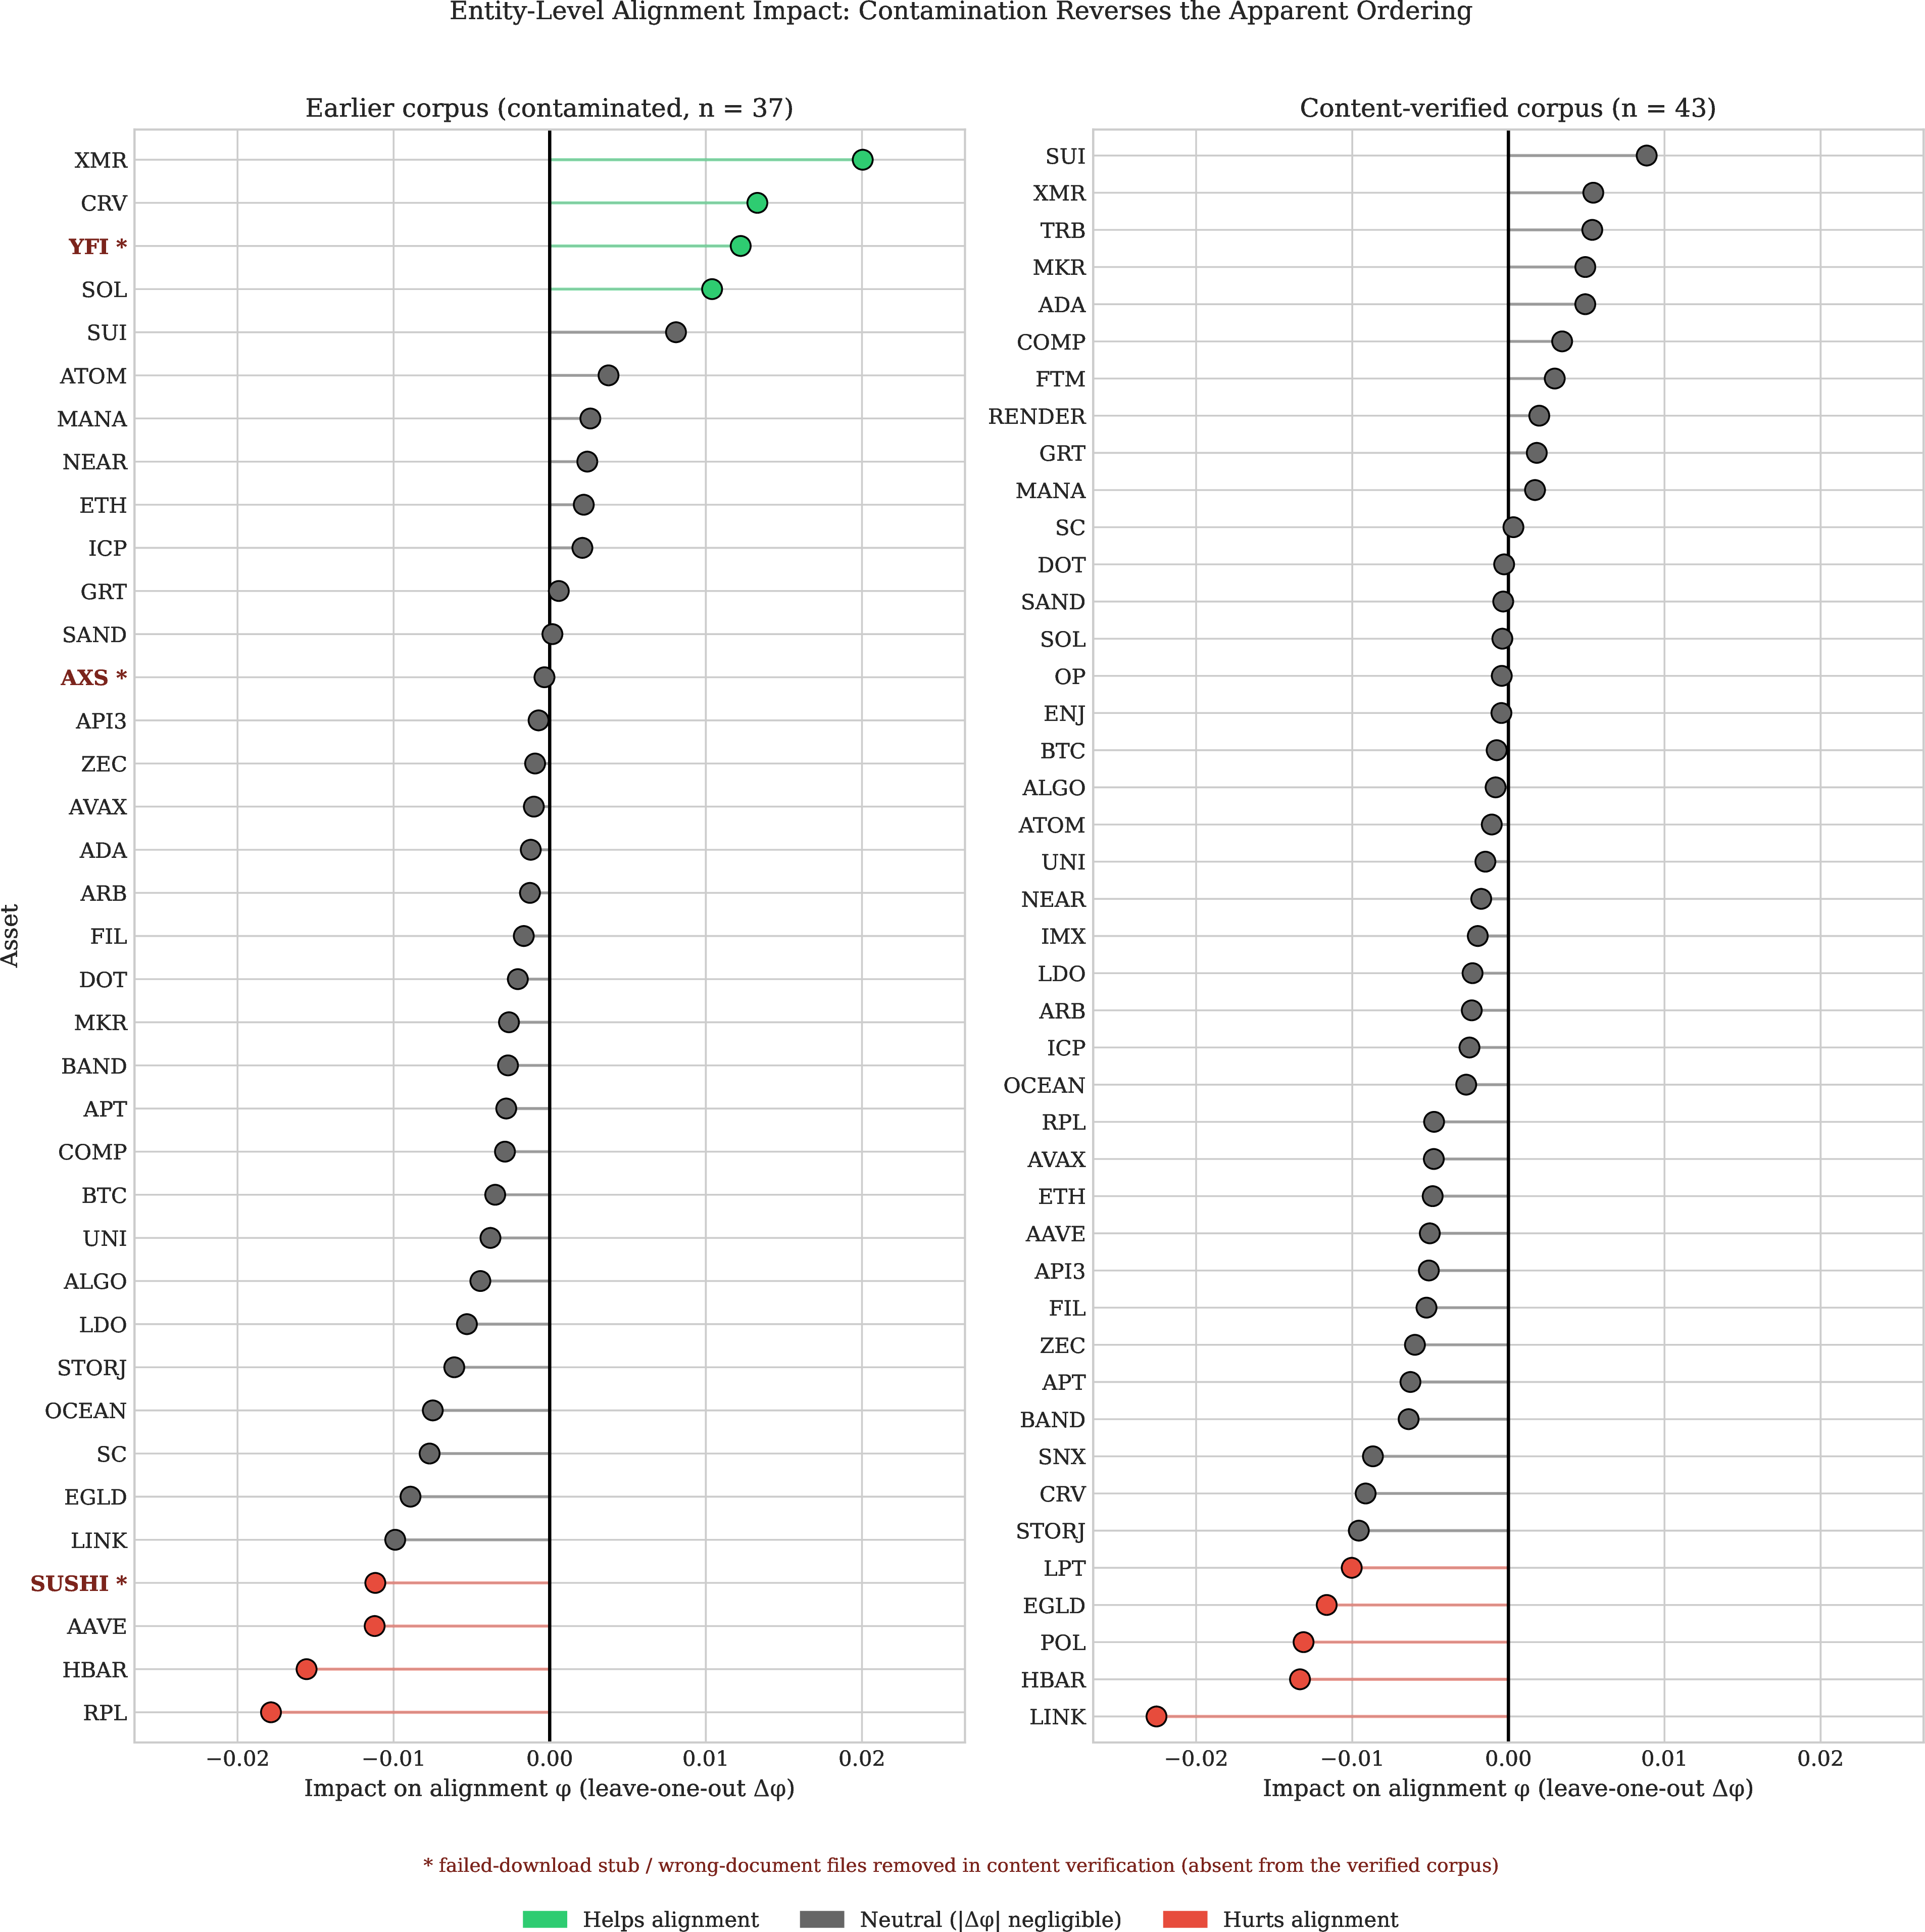
Table 4 gives the top and bottom contributors on the verified corpus.
| Asset | Impact | Interpretation |
|---|---|---|
| SUI | \(+0.009\) | Marginal |
| XMR | \(+0.005\) | Marginal |
| TRB | \(+0.005\) | Marginal |
| MKR | \(+0.005\) | Marginal |
| EGLD | \(-0.012\) | Hurts alignment |
| POL | \(-0.013\) | Hurts alignment |
| HBAR | \(-0.013\) | Hurts alignment |
| LINK | \(-0.022\) | Hurts alignment |
On the content-verified corpus no coherent specialised-versus-infrastructure pattern emerges: 38 of 43 entities have negligible leave-one-out impact (\(|\Delta\phi| < 0.01\)), the largest positive contributors are weak and heterogeneous (SUI \(+0.009\), XMR \(+0.005\), TRB \(+0.005\)), and the largest negative contributors are broad L1/infrastructure tokens (LINK \(-0.022\), HBAR \(-0.013\), POL \(-0.013\)). An earlier version of this corpus reported a striking ordering—privacy and DeFi tokens appearing to align while broad infrastructure tokens detracted—but several of the tokens defining that ordering were failed-download stub or wrong-document files rather than genuine whitepapers; once the contaminated documents are removed or re-collected from verified sources, the ordering does not survive. Bitcoin, despite its exceptional cross-sectional leverage, has negligible impact (\(-0.001\)): removing it leaves the weak, non-significant correspondence essentially unchanged. We therefore treat entity-level heterogeneity as uninformative here, consistent with the overall null and as a cautionary illustration of how corpus contamination can manufacture an apparent cross-sectional signal.
5.3 Positive Control: Cross-Domain Detection Sensitivity↩︎
To confirm that the pipeline can detect cross-domain congruence, we run a positive-control simulation. For a grid of true congruence values \(\phi \in \{0.20, 0.30, 0.50, 0.65, 0.80\}\) we construct a synthetic \(43 \times 10\) claims-like matrix as a noisy orthogonal rotation of the real clean-43 market-structure matrix (the CP asset-factor matrix, used here only as a calibration base; Section 4), calibrated so each column is recovered at the target \(\phi\), then pass it through the unmodified Procrustes and permutation pipeline (\(500\) replications \(\times\;200\) permutations per cell; seed \(20260627\)). Recovered congruence tracks the injected target almost exactly (targets \(0.20/0.50/0.80\) recover to \(0.234/0.501/0.806\)), validating the data-generating process. Because the control injects and then recovers a known congruence on top of the calibration base, the base’s own factor structure—whose leading component is Bitcoin-dominated—does not affect the recovered power; only the injected signal does. The resulting power curve (Section 4.4) shows the estimator is sensitive to genuine cross-domain structure—under an ideal instrument the minimum detectable effect (80% power) is \(\phi \approx 0.40\)—and that the binding constraint is the low reliability of the claims instrument (\(\rho \approx 0.31\)), which raises the practical minimum detectable effect to \(\phi \approx 0.66\). The observed claims–statistics congruence lies far below this floor, so the null is consistent with a true null within the limits of detectable effect size, though a weak sub-threshold effect cannot be excluded.
5.4 Robustness↩︎
The non-detection is stable across the full battery, reported in Supplementary Appendix 11: the claims matrix is near-homogeneous and recovers no intuitive token archetype (Supplementary Figure 3); alignment is weak in every rolling window (\(\phi = 0.163 \pm 0.028\); Supplementary Table 7); no single semantic category moves \(\phi\) by more than \(0.02\) (Supplementary Table 8, Figure 4); subsample resampling (\(\phi = 0.252 \pm 0.019\)) and jackknife leave the estimate firmly weak; four methodologically distinct alignment measures (RV, distance correlation, CCA, PLS) are all non-significant (Supplementary Table 9); residualising on market capitalisation leaves the result unchanged (partial \(\phi \approx 0.26\)); and because no comparison clears \(\alpha = 0.05\), any multiple-testing correction leaves the conclusion intact.
6 Discussion↩︎
Interpreting the null. Our central result is a non-detection: at \(n = 43\) we find no significant claims–market alignment, but the design is underpowered (realistic minimum detectable effect \(\phi \approx 0.66\)) to separate weak alignment from none. We can reject strong alignment (\(\phi \geq 0.70\)) but cannot rule out a weak (\(\phi \approx 0.3\)) effect. Three readings are consistent with the data: whitepapers may state aspirational narratives that projects later pivot away from (Bitcoin’s “peer-to-peer electronic cash” framing diverged sharply from its “digital gold” market reality); market behaviour may be driven by factors orthogonal to functional claims—speculation, liquidity, Bitcoin co-movement, macro [14]—that swamp project-specific narrative; or the zero-shot pipeline may simply fail to capture price-relevant narrative nuance.
Contamination as a cautionary tale. We initially observed what looked like a structural distinction—specialised tokens with clear niches aligning while broad infrastructure tokens detracted—but this ordering was an artifact of corpus contamination: several of the tokens defining it were failed-download stub or wrong-document files, and the split dissolves once they are removed or re-collected. On the verified corpus the entity-level impacts are uniformly small (\(|\Delta\phi| \leq 0.022\)) with no coherent niche-versus-infrastructure structure. We therefore advance no cross-sectional pricing hypothesis; the episode instead shows how undetected corpus contamination can manufacture a plausible but spurious heterogeneity result in text-based studies of narrative–market correspondence—which is why content-level corpus verification (word counts, project-name checks, right-document confirmation) should be a precondition for cross-sectional text–market analysis. (Extended theoretical and practical implications are in Supplementary Appendix 12.)
Limitations. Three limitations bind the interpretation; further caveats are in Supplementary Appendix 12.
Limited power is the binding constraint. With \(n = 43\) entities and a low-reliability text instrument, the realistic minimum detectable effect is \(\phi \approx 0.66\) (Section 4.4); we can reject strong alignment but not distinguish weak alignment from none. The result is absence of evidence for alignment, not evidence of its absence. Expanding to 50+ projects would be needed for adequate power at moderate effects and for sector-level subsample analysis.
Construct validity of the narrative instrument. Inter-method agreement is modest (\(\kappa = 0.25\); mean \(\rho \approx 0.31\)). This bears not only on reliability—noise that merely attenuates a true signal—but on validity: off-the-shelf zero-shot classification may not measure the price-relevant narrative content the test requires. A weak measured alignment is thus consistent with either a genuinely weak relationship or an instrument that misses the construct, and our design cannot separate the two.
Temporal-coverage mismatch. The corpus is mostly founding-era text (Supplementary Table 10; several documents predate 2018), whereas market structure is measured over 2023–2024. Treating inception narratives and contemporaneous market behaviour as comparable can attenuate alignment and cannot be cleanly separated from the validity issue; resolving it requires a time-stamped, multi-period narrative corpus matched to market windows.
Practical implications. We are cautious about prescriptions from an underpowered non-detection. A study that can reject only strong alignment cannot license claims that whitepaper analysis “offers limited value” to investors, that messaging is secondary for project teams, or that a narrative–market disconnect complicates disclosure-based regulation. At most our results offer a weak prior—narrative-classification strategies (e.g.”DeFi basket,” “Layer 1 portfolio”) should not be assumed to capture return differentials without independent evidence—and motivate the larger, feature-enriched study any firmer recommendation would require.
7 Conclusions↩︎
We investigated whether cryptocurrency whitepaper claims are reflected in market structure, combining NLP claims extraction, cross-sectional market-statistics construction, and Procrustes alignment under a contamination-aware verification protocol. The result is layered. The claims–market comparison is weak and non-significant (dimension-matched \(\phi = 0.303\)), and a positive-control and power analysis shows the design can reject strong alignment but cannot adjudicate weak alignment from none—so we report a power-limited non-detection, not a demonstrated decoupling of narrative from markets. Separately, an apparent entity-level ordering reported for an earlier corpus did not survive content verification; we document it as a corpus-contamination artifact and a methodological caution.
The paper’s contribution is therefore a method plus a cautionary tale: a reproducible, content-verified pipeline for comparing textual and market representational spaces, with a positive-control power apparatus that bounds what the comparison can detect; a power-limited empirical null on a clean corpus; and a demonstration that undetected contamination can manufacture a spurious cross-sectional result. Whether the weak measured alignment reflects a genuine narrative–market disconnect, an under-powered design, or a low-validity text instrument remains open: our data can reject strong alignment but cannot adjudicate among these accounts. The natural next steps—a 50+-project corpus, domain-adapted classifiers, crypto-native market features, and a time-stamped narrative corpus matched to market windows (Supplementary Appendix 12)—would raise power and validity enough to make the bounded null decisive in either direction.
Acknowledgements↩︎
Portions of this manuscript were drafted and revised with assistance from Claude (Anthropic). The author retains full responsibility for all intellectual content, analytical decisions, and interpretive claims. This work was conducted as part of the Adversarial Systems Research program at Dissensus. Working papers and replication materials are available through the Adversarial Systems & Complexity Research Initiative (ASCRI). Comments and correspondence are welcome at murad@dissensus.ai.
Declarations↩︎
7.0.0.1 Conflict of Interest.
The author declares no competing interests.
7.0.0.2 Funding.
This research received no external funding. Computational resources were provided by King’s College London.
7.0.0.3 Data Availability.
Cryptocurrency market data obtained via the Binance exchange API through CCXT (publicly available). Whitepaper corpus collected from official project documentation (publicly available). Processed datasets and NLP classification outputs available at https://github.com/studiofarzulla/whitepaper-claims.
7.0.0.4 Code Availability.
Full replication code available at https://github.com/studiofarzulla/whitepaper-claims under CC BY 4.0.
7.0.0.5 AI Assistance.
Claude (Anthropic) assisted with manuscript drafting, code review, and statistical exposition. All research design, data analysis, and interpretation are solely the author’s.
7.0.0.6 Author Contributions.
Sole author.
Supplementary Appendix↩︎
The following material relocates, in full, the extended methodology, NLP validation, robustness battery, and extended discussion referenced in the main text. No analyses or results have been removed; the main text retains only the contamination-aware pipeline and protocol, the collapse of the apparent entity-impact ordering under verification, the positive-control/power bound, and the bounded null on the claims–statistics leg.
8 Extended Related Work↩︎
8.1 Cryptocurrency Narratives and Sentiment↩︎
Research on cryptocurrency narratives spans social media, whitepaper studies, and sentiment measurement. [15] predict Bitcoin price movements from engineered sample dimensions; [16] find that Elon Musk’s tweets generate abnormal returns for mentioned coins; [17] document narrative-driven herding; and [14] establish crypto-specific momentum, size, and market factors. Whitepaper analysis has grown as a quality signal: [6], [18], and [19] link technical depth and design to ICO success, and more sophisticated NLP has followed—[4] topic-model 5,210 whitepapers, [5] shows issuers systematically exaggerate claims, [20] relate length and complexity to funds raised, and [21] find post-listing returns better predicted by whitepaper content than by analyst ratings. These studies, however, focus on prediction at issuance rather than ongoing alignment between narrative and market behaviour. Indeed [7] find that clustering coins by whitepaper content yields no significant difference in time-series dynamics, and high-profile failures [22], [23] illustrate the gap between elaborate specifications and realised outcomes. Our study tests whether claims align with ongoing market structure. The theoretical frame is narrative economics [2] and the behavioural-finance literature on sentiment and mispricing [24]–[27].
8.2 NLP in Finance↩︎
Applying NLP to financial text is now standard [28]: general dictionaries misclassify financial language [29], [30], motivating domain models such as FinBERT [31], [32] and transformer benchmarks [33]. Zero-shot classification [11] allows categorisation without labelled training data, and developer-communication sentiment predicts crypto prices [34]. Beyond sentiment, distinctive microstructure—24/7 trading, fragmentation, Bitcoin co-movement—may dominate narrative effects [35], and infrastructure shocks generate larger volatility responses than regulatory ones [36].
8.3 Factor Comparison Methods↩︎
Comparing structures across spaces requires controlling for rotational indeterminacy. Procrustes rotation [8] finds the optimal orthogonal alignment, [37] maximises congruence directly, and Tucker’s \(\phi\) [9], [10] measures aligned-factor similarity, with chance distributions established by [38] and [39]. [10] give interpretation thresholds (\(|\phi| \geq 0.95\) equivalence, \(\geq 0.85\) fair, \(\geq 0.65\) moderate, \(< 0.65\) weak/none) that we use as rough benchmarks throughout.
8.4 Factor Models in Cryptocurrency↩︎
Traditional asset pricing employs factor models to explain cross-sectional return variation. [1] established the theoretical foundation for efficient markets and factor-based returns; [40] introduced the three-factor model for equities, with analogous developments in cryptocurrency emerging more recently. [41] demonstrate how random matrix theory can distinguish signal from noise in financial correlation matrices—a perspective we extend to narrative-factor comparisons. [42] review network-based approaches to financial systemic risk, complementing factor-based perspectives with topological analysis, and [43] establishes the theoretical and generative foundations for information filtering networks, offering principled methods for extracting sparse dependency structures from high-dimensional financial data.
[14] document that cryptocurrency returns load on common factors explaining substantial cross-sectional variation analogous to Fama-French factors; [44] subsequently formalise a three-factor model—market, size, and momentum—for the cross-section of cryptocurrency returns. [45] apply Instrumented PCA to show that time-varying factor loadings outperform observable risk factors; [46] extends crypto CAPM with a downside-beta factor across 1,700 coins; and [47] introduce blockchain-native factors—computing power, network size—as procyclical pricing factors with positive risk premia. Such systematic factors—market co-movement, size, liquidity—may dominate any narrative-based signal, consistent with our non-detection of a claims–market correspondence.
Multi-way data in finance. Financial data naturally exhibits multi-way structure: assets \(\times\) time \(\times\) features. While matrix methods (PCA, factor analysis) collapse this structure, tensor decomposition preserves it; this literature motivates the market-structure representation we use as a calibration target for the power analysis (Section 4.4).
8.5 Tensor Methods in Finance↩︎
Tensor decomposition provides a natural framework for multi-way financial data. [48] review tensor decomposition methods, establishing the foundations for CP and Tucker decomposition. [49] develop tensor factor models for high-dimensional time series (TIPUP/TOPUP estimators) with finance applications; [50] apply Tucker decomposition to high-dimensional vector autoregression; [51] develop CP factor models for dynamic tensors with uncorrelated latent factors applicable to asset pricing; [52] introduce the POET estimator for high-dimensional covariance with factor structure; and [53] regularise principal components with network topology. CP (CANDECOMP/PARAFAC) decomposition decomposes a tensor into rank-one components, extracting interpretable latent factors [54]; for market data structured as (time \(\times\) asset \(\times\) feature) it yields asset-level loadings analogous to PCA but preserving multi-way structure, with Tucker decomposition an alternative offering mode-specific ranks and a core tensor.
9 Tensor Construction and Decomposition (Calibration Base)↩︎
The market tensor and its CP decomposition are used only as a real-data base for the positive-control power calibration (Sections 4.4, 5.3); for the reasons given in the scope note in Section 4, no factor-based alignment leg is reported.
9.1 Tensor Construction↩︎
Definition 2 (Market Tensor). A market tensor \(\mathcal{X} \in \mathbb{R}^{T \times V \times A \times F}\) is a 4-way array with modes:
Time (\(T = 17,543\) hourly timestamps)
Venue (\(V = 1\), Binance)
Asset (\(A = 49\) cryptocurrencies)
Feature (\(F = 5\), OHLCV)
With a single venue, the effective structure is 3-way: \(\mathcal{X} \in \mathbb{R}^{T \times A \times F}\). Each entry \(x_{taf}\) represents the value of feature \(f\) for asset \(a\) at time \(t\). Prior to decomposition, we z-normalise each feature slice across both assets and time (i.e., each \(\mathcal{X}_{::f}\) has zero mean and unit variance), ensuring that scale differences across OHLCV features do not dominate the factor structure.
9.2 Tensor Decomposition↩︎
Definition 3 (CP Decomposition). The CANDECOMP/PARAFAC (CP) decomposition approximates a tensor as a sum of rank-one tensors: \[\mathcal{X} \approx \sum_{r=1}^{R} \lambda_r \, \mathbf{a}_r \circ \mathbf{b}_r \circ \mathbf{w}_r\] where \(\circ\) denotes outer product, \(\lambda_r\) are weights, and \(\mathbf{a}_r \in \mathbb{R}^T\), \(\mathbf{b}_r \in \mathbb{R}^A\), \(\mathbf{w}_r \in \mathbb{R}^F\) are mode-specific factor vectors.
The factor matrices are: \[\begin{align} \mathbf{A} &= [\mathbf{a}_1 | \cdots | \mathbf{a}_R] \in \mathbb{R}^{T \times R} \quad \text{(time factors)} \\ \mathbf{B} &= [\mathbf{b}_1 | \cdots | \mathbf{b}_R] \in \mathbb{R}^{A \times R} \quad \text{(asset factors)} \\ \mathbf{W} &= [\mathbf{w}_1 | \cdots | \mathbf{w}_R] \in \mathbb{R}^{F \times R} \quad \text{(feature factors)} \end{align}\]
The asset factor matrix \(\mathbf{B} \in \mathbb{R}^{A \times R}\) (the asset mode has \(A = 49\)) holds the latent asset loadings; in this letter it serves only as the calibration base for the positive-control power analysis (Section 4.4). We write the feature-factor matrix as \(\mathbf{W}\) (not \(\mathbf{C}\)) to reserve \(\mathbf{C}\) for the claims matrix \(\mathbf{C} \in \mathbb{R}^{N \times K}\).
CP decomposition is computed via alternating least squares (ALS):
| 1: | Initialise \(\mathbf{A}\), \(\mathbf{B}\), \(\mathbf{W}\) randomly |
| 2: | repeat |
| 3: | \(\mathbf{A} \gets \mathbf{X}_{(1)} (\mathbf{W} \odot \mathbf{B}) (\mathbf{W}^\top\mathbf{W} * \mathbf{B}^\top\mathbf{B})^{\dagger}\) |
| 4: | \(\mathbf{B} \gets \mathbf{X}_{(2)} (\mathbf{W} \odot \mathbf{A}) (\mathbf{W}^\top\mathbf{W} * \mathbf{A}^\top\mathbf{A})^{\dagger}\) |
| 5: | \(\mathbf{W} \gets \mathbf{X}_{(3)} (\mathbf{B} \odot \mathbf{A}) (\mathbf{B}^\top\mathbf{B} * \mathbf{A}^\top\mathbf{A})^{\dagger}\) |
| 6: | until convergence |
where \(\mathbf{X}_{(n)}\) is mode-\(n\) matricisation, \(\odot\) is Khatri-Rao product, \(*\) is Hadamard product, and \(\dagger\) denotes pseudoinverse. We select rank \(R\) to achieve target explained variance \(\text{EV}(R) = 1 - \|\mathcal{X} - \hat{\mathcal{X}}_R\|_F^2 / \|\mathcal{X} - \bar{x}\|_F^2\); with target \(\text{EV} \geq 0.90\) we obtain \(R = 2\) (EV = 92.45%). For robustness we also implement Tucker decomposition, \(\mathcal{X} \approx \mathcal{G} \times_1 \mathbf{A} \times_2 \mathbf{B} \times_3 \mathbf{W}\), where \(\mathcal{G} \in \mathbb{R}^{R_1 \times R_2 \times R_3}\) is the core tensor and \(\times_n\) the mode-\(n\) product. As the scope note explains, under the global feature-slice normalisation this factor space is degenerate for raw-scale OHLCV (Bitcoin’s level dominates the leading factor), so we report no factor-based alignment leg and use \(\mathbf{B}\) only to inject and recover a known congruence in the positive control.
10 NLP Classification: Validation Detail↩︎
10.1 Semantic Taxonomy↩︎
Our taxonomy comprises \(K = 10\) categories capturing core blockchain functionality (Table 5).
| Category | Description |
|---|---|
| Store of Value | Digital gold, inflation hedge, wealth preservation |
| Medium of Exchange | Payment system, transactions, currency |
| Smart Contracts | Programmable contracts, automation, trustless execution |
| Decentralised Finance | Lending, borrowing, yield, liquidity provision |
| Governance | Voting, DAOs, community decision-making |
| Scalability | High throughput, low latency, Layer 2 solutions |
| Privacy | Anonymous transactions, zero-knowledge proofs |
| Interoperability | Cross-chain communication, bridges, multi-chain |
| Data Storage | Decentralised storage, file systems, permanence |
| Oracle Services | External data feeds, real-world information |
Whitepapers are segmented into 500-word chunks (\(n = 2{,}056\) across the initial 24-asset corpus; subsequently expanded and content-verified to the 43 assets analysed here). Zero-shot classification follows the entailment approach of [13], constructing hypotheses of the form “This text is about [category]” for each candidate label.
10.2 Model Validation↩︎
We assess classification reliability through inter-model agreement using DeBERTa-v3 [55] as an alternative classifier.3 On a random sample of 200 chunks, exact top-1 agreement is 37% (Cohen’s \(\kappa = 0.25\)), reflecting known sensitivity of zero-shot NLI to model-specific category boundaries. Relaxed agreement—where the alternative model’s top prediction appears in the primary model’s top-3—reaches 68%, suggesting models capture similar semantic neighbourhoods with different decision thresholds. Recent advances using large language models [56] suggest alternative approaches for future work. Bootstrap 95% confidence intervals on aggregate category proportions (1,000 resamples) yield tight bounds—Medium of Exchange 23.1–26.2%, Data Storage 13.0–16.2%, Scalability 9.9–12.2%, Smart Contracts 9.8–11.7%, Governance 3.2–4.1%—indicating stable estimates at the corpus level despite chunk-level uncertainty.
10.3 Multi-Method Validation↩︎
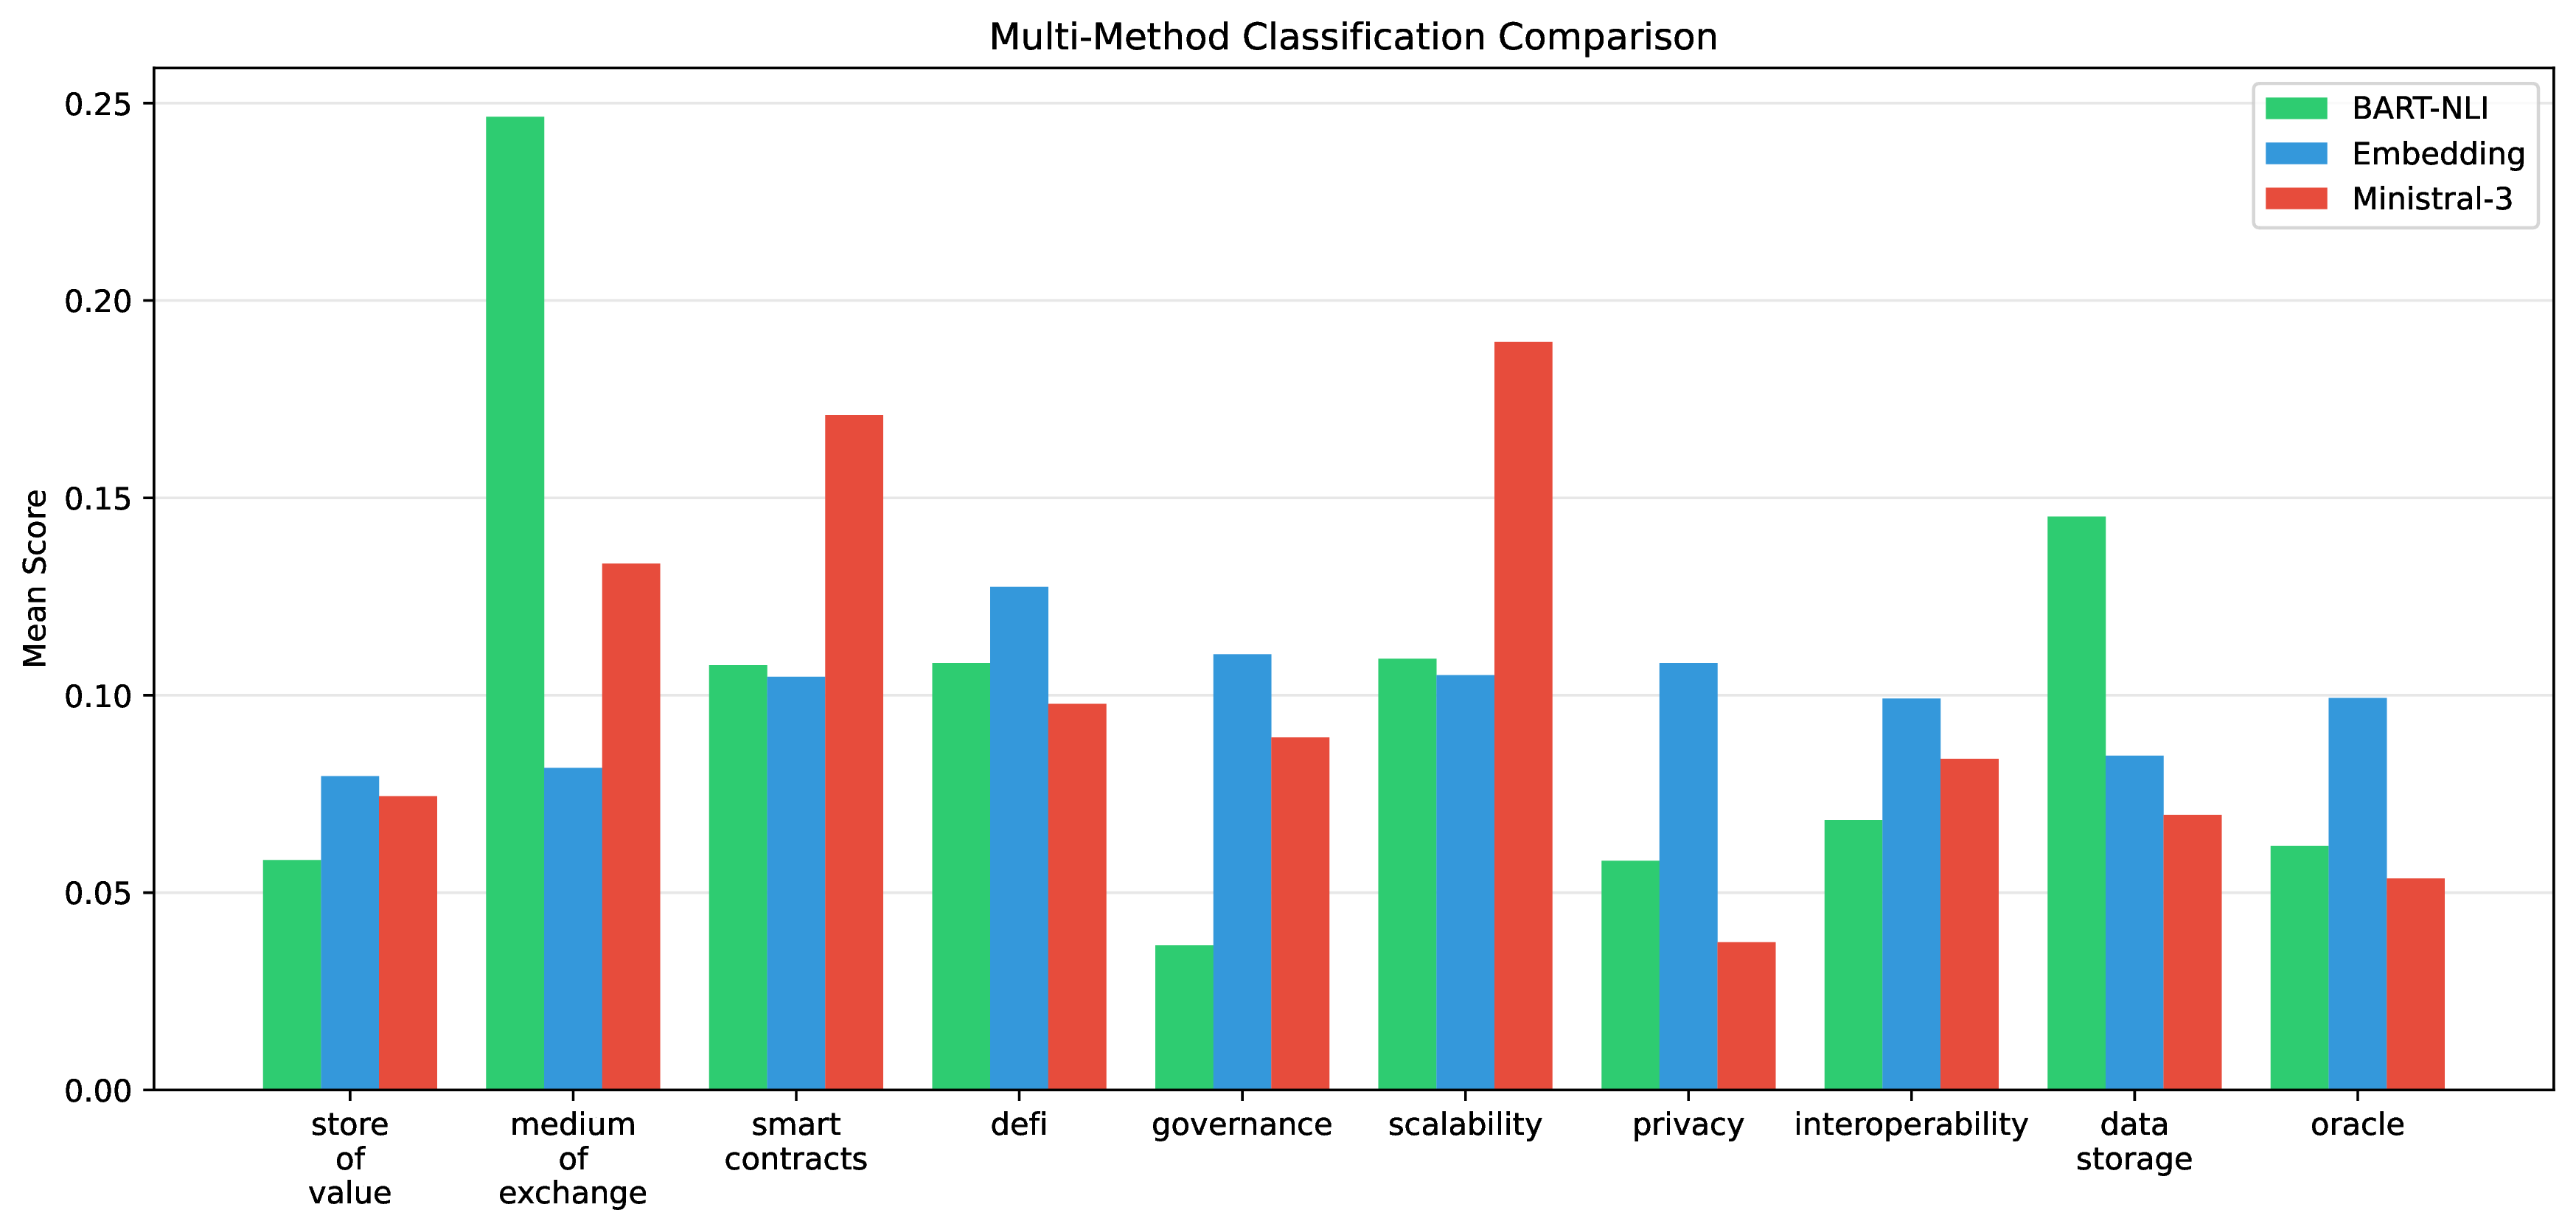
To further assess robustness, we implement three independent methods with distinct inductive biases: (1) BART-MNLI (NLI-based entailment), (2) sentence embeddings using all-mpnet-base-v2 [57] with cosine similarity to category descriptions, and (3) Ministral-3 3B, a local language model via structured JSON prompting. Table 6 reports pairwise correlations across the content-verified corpus.
| Method Pair | Pearson \(r\) | Spearman \(\rho\) |
|---|---|---|
| BART-NLI vs Embedding | 0.070 | 0.082 |
| BART-NLI vs LLM | 0.475 | 0.526 |
| Embedding vs LLM | 0.395 | 0.333 |
| Mean pairwise | 0.314 | 0.314 |
The LLM-based classifier exhibits moderate correlation with both other methods (\(r \approx 0.4\)), while BART and embedding methods show weaker agreement (\(r = 0.07\)), suggesting distinct inductive biases. Discretised Fleiss’ Kappa (\(\kappa = 0.067\)) indicates slight but positive inter-rater agreement above chance. Per-category agreement varies substantially (full heatmap in Appendix 18): categories with clear linguistic markers show strong convergence (DeFi \(\bar{r} = 0.82\), oracle \(\bar{r} = 0.77\), privacy \(\bar{r} = 0.71\)), while abstract concepts show weaker agreement (smart_contracts \(\bar{r} = 0.21\), store_of_value \(\bar{r} = 0.42\)). Figure 2 visualises these cross-method patterns.
11 Robustness Battery↩︎
This appendix reports, in full, the robustness analyses summarised in Section 5. All corroborate the bounded null.
11.1 Claims Matrix↩︎
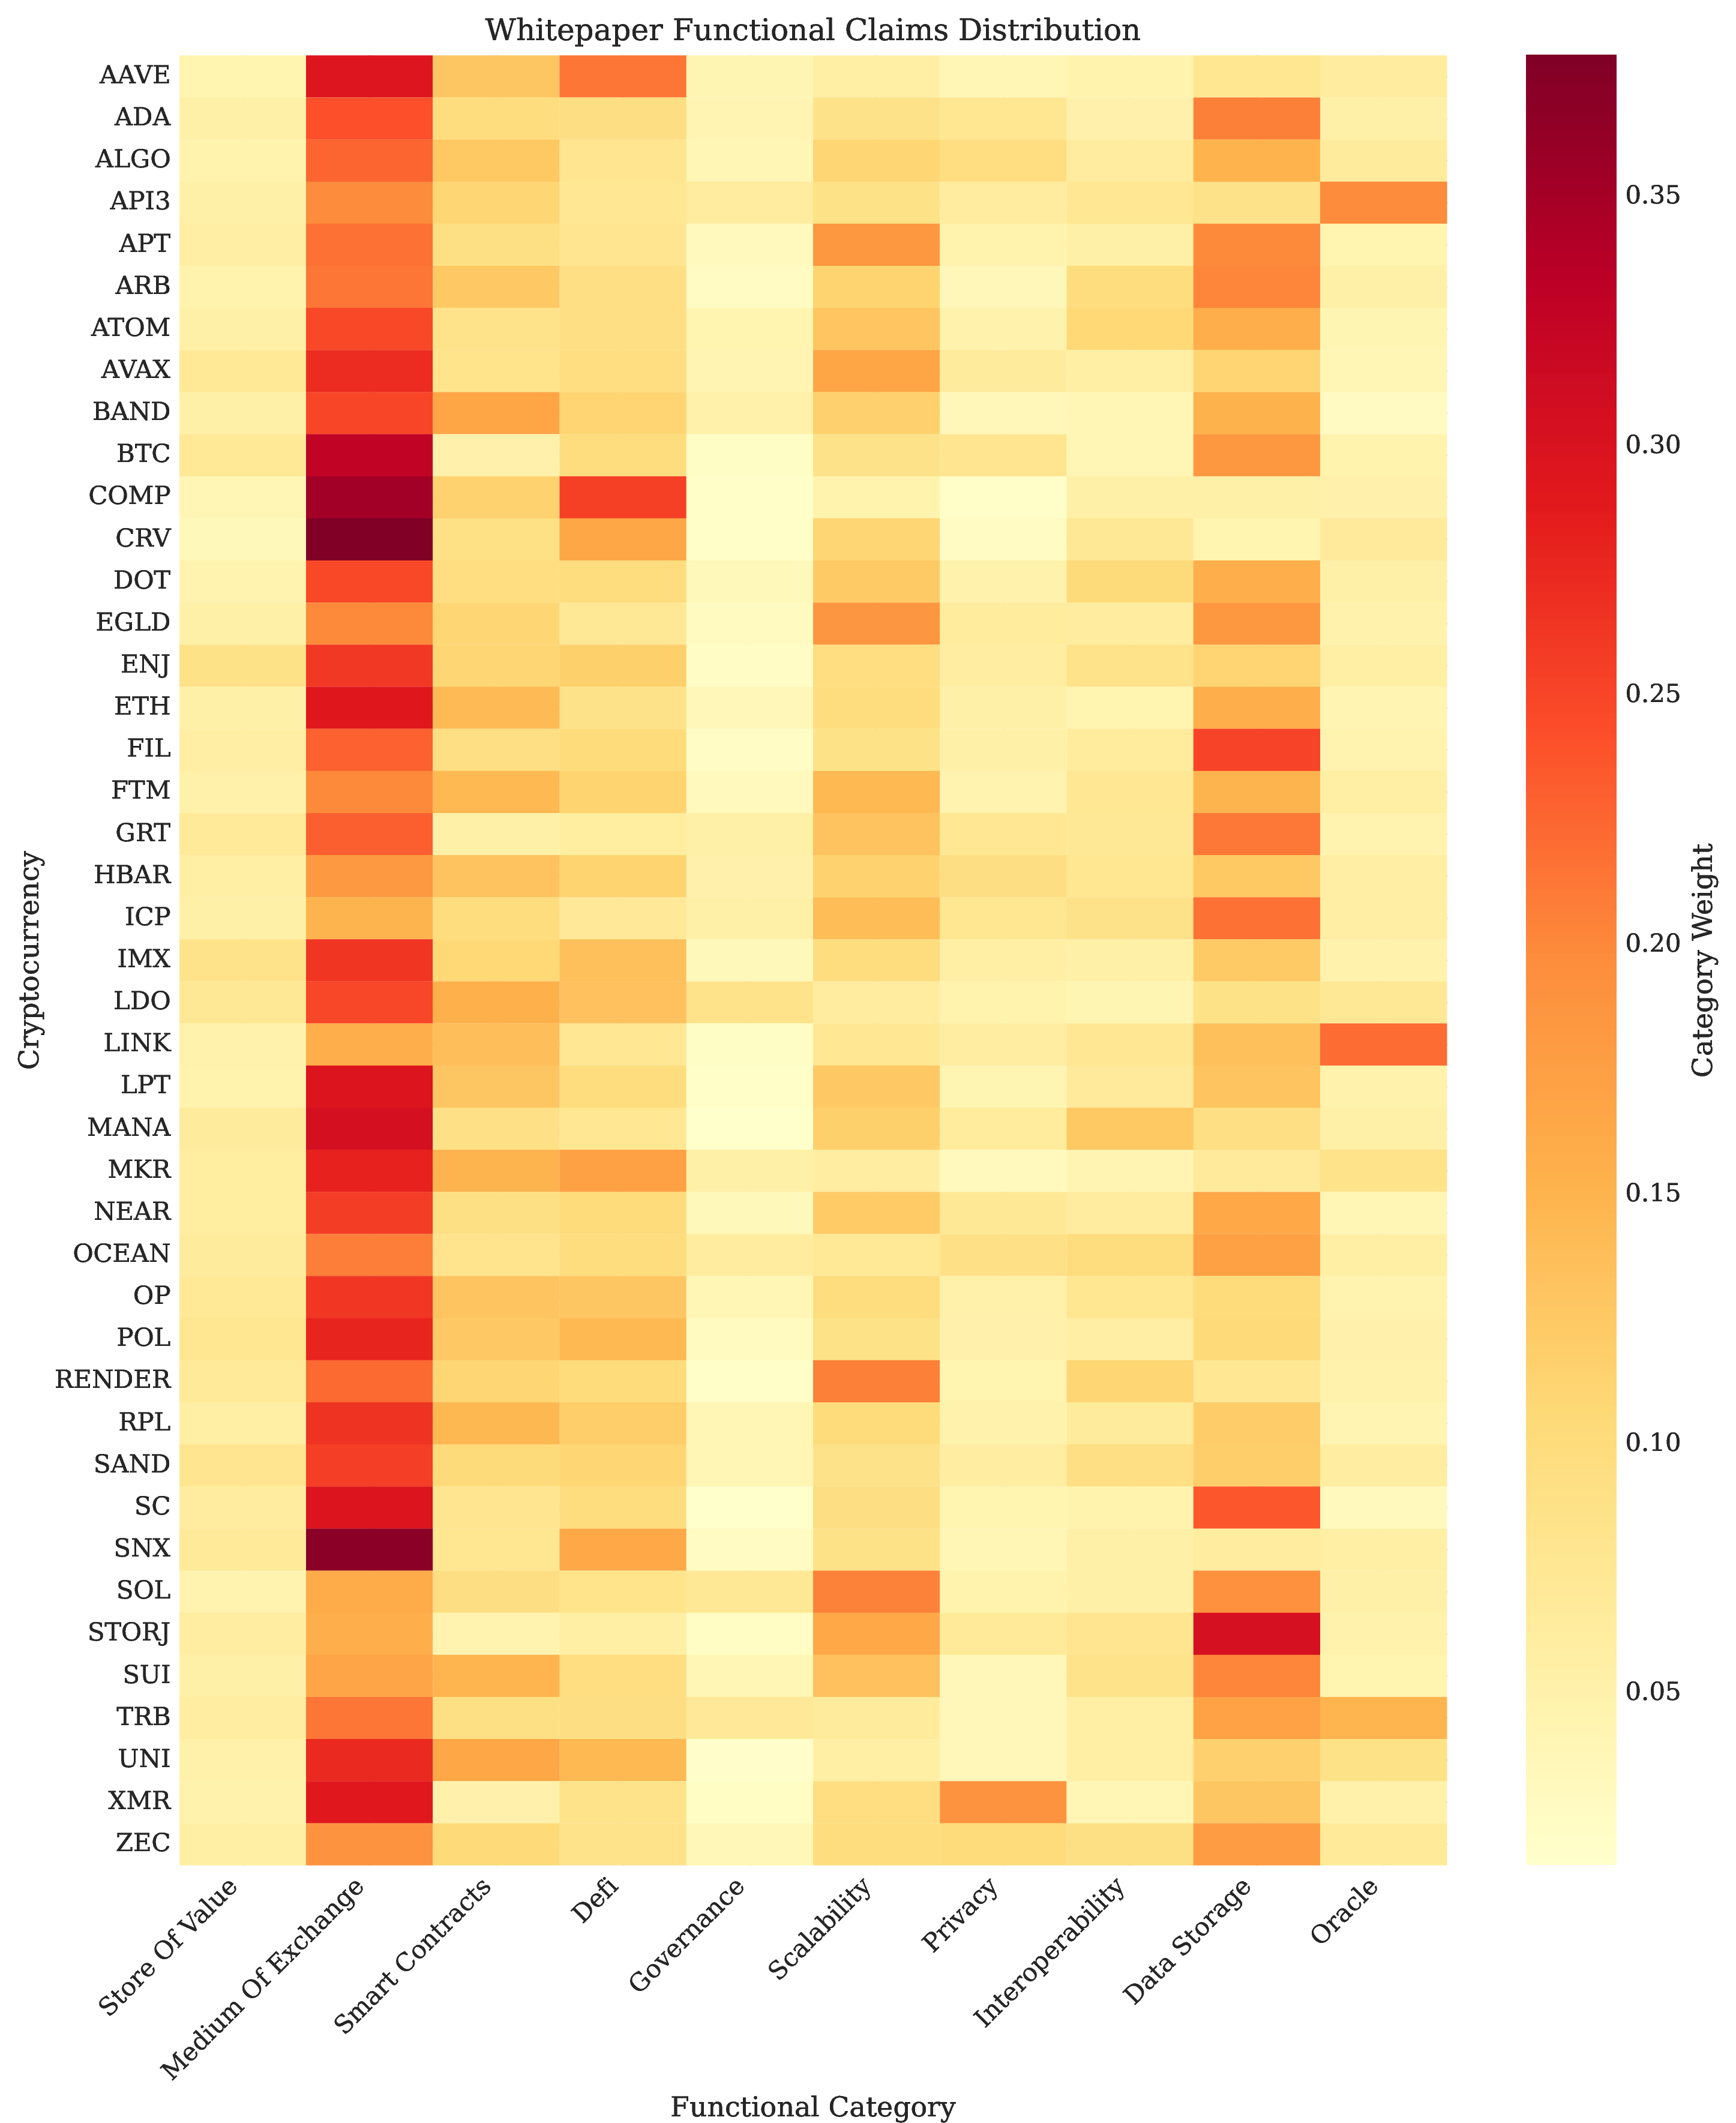
Figure 3 displays the claims matrix heatmap, and its dominant feature is homogeneity rather than archetype. Medium of Exchange is the modal category for roughly forty of the forty-three assets (corpus mean \(24.7\%\)), with Data Storage a consistent second (\(14.5\%\)), ahead of Scalability (\(10.9\%\)), DeFi (\(10.8\%\)), and Smart Contracts (\(10.8\%\)). The zero-shot classifier does not recover the intuitive token archetypes. Bitcoin’s largest weight is Medium of Exchange (\(32.8\%\)), not Store of Value, which ranks only sixth at \(7.0\%\); Data Storage (\(18.3\%\)) is its second category. Ethereum likewise leads on Medium of Exchange (\(29.2\%\)), with Smart Contracts (\(14.2\%\)) third behind Data Storage—and only the eighth-highest Smart Contracts score in the corpus, trailing BAND (\(16.7\%\)), UNI (\(16.4\%\)), LDO (\(15.3\%\)), and MKR (\(14.8\%\)). Solana and NEAR share the same Medium-of-Exchange-plus-Data-Storage backbone: Solana is led by Scalability (\(20.4\%\)) and Data Storage (\(19.1\%\)), NEAR by Medium of Exchange (\(25.7\%\)) and Data Storage (\(16.3\%\)), with Smart Contracts and Governance peripheral in both. The one category that behaves as expected is Privacy, on which Monero records the corpus maximum (\(18.9\%\), next ZEC \(10.0\%\))—though even for Monero, Medium of Exchange (\(29.0\%\)) is the larger weight. This near-uniform pull towards a generic monetary register is itself diagnostic: the instrument compresses heterogeneous technical prose into a narrow band of categories, foreshadowing the weak claims–market correspondence.
11.2 Temporal Stability↩︎
Table 7 reports alignment evolution across six rolling windows (6-month duration, 3-month stride).
| Window | Period | \(\phi\) |
|---|---|---|
| 1 | Jan–Jul 2023 | 0.171 |
| 2 | Apr–Oct 2023 | 0.173 |
| 3 | Jul 2023–Jan 2024 | 0.199 |
| 4 | Oct 2023–Apr 2024 | 0.183 |
| 5 | Jan–Jul 2024 | 0.113 |
| 6 | Apr–Oct 2024 | 0.141 |
| Mean \(\pm\) SD | \(0.163 \pm 0.028\) | |
Alignment shows moderate variation throughout the sample period, ranging from \(\phi = 0.113\) (early–mid 2024) to \(\phi = 0.199\) (late 2023), with all windows remaining in the weak-alignment range. The content-verified corpus (43 assets; 37 with complete coverage in every rolling window) shows comparable temporal heterogeneity, and no window approaches even moderate correspondence.
11.3 Narrative Vintage and Temporal Coverage↩︎
A natural concern is that founding-era whitepapers understate alignment because they predate the market window: a project’s narrative at inception need not match the utility positioning that drives its token over 2023–2024. The textbook reading is that such vintage drift adds noise to the claims matrix relative to the contemporaneous “true” narrative and so biases observed congruence toward zero—that is, can only attenuate a genuine relationship, not manufacture one. We flag this as a caveat rather than a guarantee: the attenuation-only argument presumes the classifier validly captures price-relevant narrative content, which our modest inter-method agreement (\(\kappa = 0.25\)) calls into question—if the instrument mismeasures narrative, vintage drift is not the only force pushing \(\phi\) down. We therefore do not treat founding-era vintage as a reason the non-detection is informative; instead we record the temporal-coverage mismatch—static, mostly pre-sample documents versus the 2023–2024 market window—as a limitation (Section 7). Directly testing whether contemporaneous, multi-period institutional narratives—documentation, governance posts, foundation updates—raise alignment requires a time-stamped corpus matched to market windows, which we leave to future work.
11.4 Feature Importance↩︎
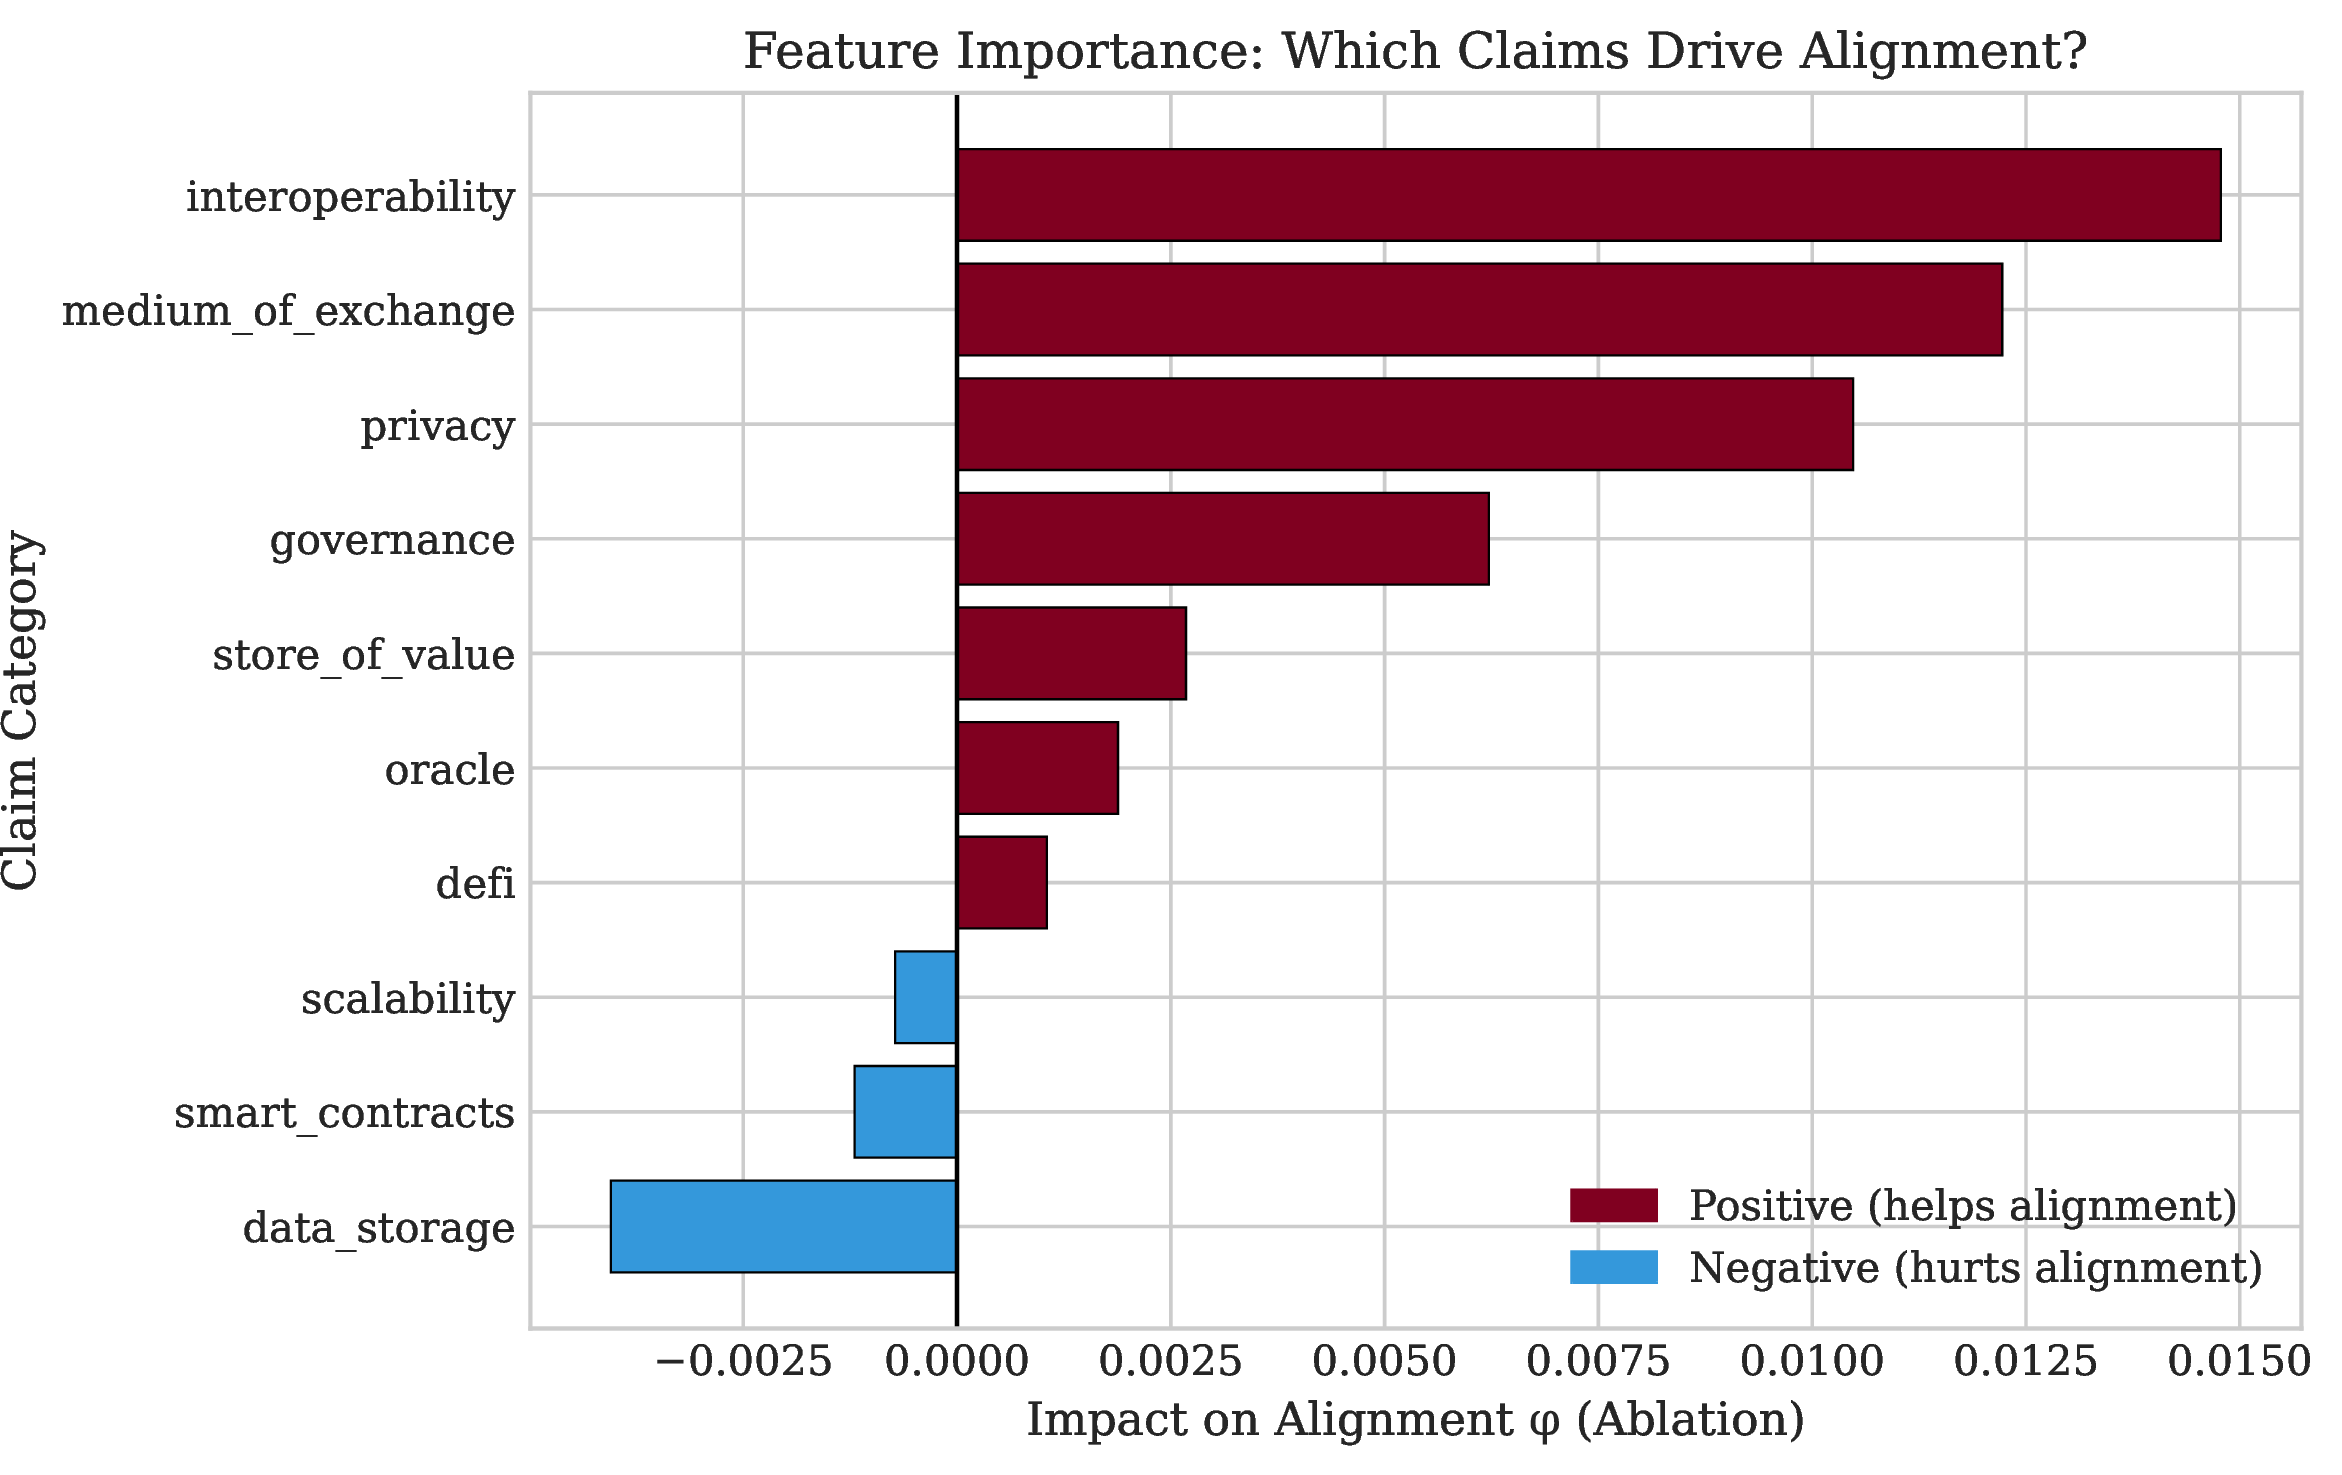
Figure 4 shows ablation-based feature importance, detailed in Table 8.
| Category | Impact |
|---|---|
| interoperability | \(+0.015\) |
| medium_of_exchange | \(+0.012\) |
| privacy | \(+0.010\) |
| governance | \(+0.006\) |
| store_of_value | \(+0.003\) |
| oracle | \(+0.002\) |
| defi | \(+0.001\) |
| scalability | \(-0.001\) |
| smart_contracts | \(-0.001\) |
| data_storage | \(-0.004\) |
Interoperability claims contribute most to alignment (\(+0.015\)), followed by medium-of-exchange and privacy. Data-storage, smart-contracts, and scalability claims show marginally negative impact. Even the most informative category moves \(\phi\) by less than \(0.02\)—an order of magnitude below the threshold for moderate similarity—so no single semantic dimension rescues the weak overall correspondence.
11.5 Subsample Stability↩︎
Bootstrap resampling (100 iterations, 80% subsample) yields mean \(\phi = 0.252 \pm 0.019\) with 95% CI \([0.220, 0.291]\). The point estimate is close to the full-sample result (\(\phi = 0.223\)) and remains firmly in the “weak” range, with the upper confidence bound well below the 0.65 threshold for moderate similarity.
11.6 Bitcoin Sensitivity↩︎
Bitcoin’s exceptional position in the cross-section (the largest asset by market value and trading volume, and a multi-sigma outlier on several market statistics) raises the question of whether our results are driven by this single outlier. On the content-verified corpus (\(n = 43\)), Bitcoin’s leave-one-out impact is negligible (\(-0.001\)), and entity-level contributions are uniformly small (\(|\Delta\phi| \leq 0.022\)) with no coherent niche-versus-infrastructure ordering. Bitcoin’s dominant market position creates statistical leverage in the cross-section, but it does not drive the result: removing it leaves the weak, non-significant claims–market correspondence essentially unchanged.
11.7 Alternative Alignment Metrics↩︎
To ensure our results are not artifacts of the Procrustes-Tucker methodology, we supplement Tucker’s \(\phi\) with four alternative cross-space alignment measures: the RV coefficient [58], distance correlation [59], Canonical Correlation Analysis (CCA), and Partial Least Squares (PLS). These methods employ fundamentally different assumptions—RV coefficient measures configuration similarity, distance correlation detects nonlinear dependencies, CCA finds maximally correlated linear combinations, and PLS maximises covariance in latent space. If all methods converge on similar conclusions, methodological bias is unlikely. Table 9 presents results across all metrics.
| Comparison | RV | dCor | CCA | PLS |
|---|---|---|---|---|
| Claims–Statistics | 0.071 | 0.501 | 0.431 | 0.354 |
| \((p = 0.579)\) | \((p = 0.701)\) | \((p = 0.286)\) | \((p = 0.373)\) |
All four alternative metrics agree with the primary Tucker \(\phi\): the claims–statistics comparison reaches significance under none of them. This convergence across methodologically distinct approaches indicates that the non-detection is not an artifact of our primary Tucker \(\phi\) measure; it does not, however, establish that the alignment is a substantive null, since all four metrics share the same low-reliability claims instrument (\(\kappa = 0.25\)) and none corrects for whether zero-shot classification validly captures price-relevant narrative content.
We compute matched-dimension alignment—the primary estimator reported in Section 5—by reducing the higher-dimensional matrix via SVD before computing Tucker’s \(\phi\), avoiding any zero-padding. Reducing claims from 10D to 7D (to match statistics) yields \(\phi = 0.303\) (\(p = 0.353\)). The pattern is unchanged: claims–statistics alignment fails significance regardless of dimension-matching strategy. This dimension-matched value is roughly \(1.4\times\) larger than the zero-padded Tucker \(\phi\) in Table 3, because zero-padding the lower-dimensional matrix mechanically deflates the coefficient; both estimators nonetheless remain well below the \(0.65\) threshold.
11.8 Jackknife Stability↩︎
Leave-one-asset-out analysis for the claims–statistics alignment (\(n = 43\)) yields uniformly small impacts (\(|\Delta\phi| \leq 0.022\)): the largest positive contributors are SUI (\(+0.009\)), XMR (\(+0.005\)), and TRB (\(+0.005\)), and the largest negative are LINK (\(-0.022\)), HBAR (\(-0.013\)), and POL (\(-0.013\)). Bitcoin shows negligible impact (\(-0.001\)), confirming the null result is not driven by any single dominant asset.
11.9 Controlling for Market Capitalisation↩︎
Market capitalisation may confound narrative–market relationships if larger projects have both distinctive narratives and distinctive market behaviour. We residualise all matrices on average volume (a market cap proxy) before Procrustes alignment. Controlling for market cap, claims–statistics alignment shows minimal change, remaining in the weak range (partial \(\phi \approx 0.26\), versus a raw \(\phi \approx 0.32\) on \(n = 43\)). Market cap does not drive the weak alignment result—size effects are orthogonal to the narrative-market relationship we measure.
11.10 Multiple Testing Correction↩︎
The claims–statistics comparison does not reach nominal significance under the primary Tucker \(\phi\), the dimension-matched estimator, or any of the four alternative metrics (RV, dCor, CCA, PLS). Because no comparison clears the uncorrected \(\alpha = 0.05\) threshold, any multiple-testing correction (e.g.Bonferroni) leaves the conclusion unchanged: the non-detection is robust to multiple-testing considerations.
11.11 Bootstrap Confidence Intervals↩︎
We construct 95% CIs via percentile bootstrap (\(B = 1000\) resamples). However, bootstrap resampling with replacement on small samples (\(n = 43\)) exhibits known pathologies when combined with Procrustes-based alignment: duplicate entities in resampled data artificially inflate \(\phi\) by increasing effective weights on well-aligned pairs. Our bootstrap distributions show substantial upward bias (bootstrap mean exceeds point estimate by 29% for claims–statistics), with moderate right-skewness (skewness \(\approx 0.45\)). Consequently, percentile CIs may be conservative for upper bounds but unreliable for lower bounds—the lower bound can exceed the point estimate. We therefore report these intervals for completeness while treating them as indicative rather than precise, and omit them from the headline table.
12 Extended Discussion↩︎
12.1 Bitcoin’s Narrative Regime↩︎
Bitcoin shows negligible leave-one-out impact (\(-0.001\)). It is nonetheless instructive that Bitcoin has transcended its whitepaper claims (“peer-to-peer electronic cash”) to become a macro asset trading on “digital gold” narratives orthogonal to functional utility claims. Our alignment framework captures functional asset dynamics—the correspondence between what projects claim to do and how their tokens behave—but Bitcoin increasingly operates in a different narrative regime, dominated by macroeconomic positioning, institutional adoption, and store-of-value framing that bears little relationship to its original functional claims. On the content-verified corpus (\(n = 43\)), however, no token or token cluster exhibits more than negligible alignment, so this Bitcoin-specific observation is illustrative rather than evidence of a systematic cross-sectional pattern.
12.2 Feature Importance Patterns↩︎
Interoperability claims contribute most to alignment (\(+0.015\)), followed by medium of exchange (\(+0.012\)) and privacy (\(+0.010\)). This pattern suggests markets reward projects with clear cross-chain and transactional value propositions. Data storage shows the largest negative impact (\(-0.004\)), with smart contracts and scalability marginally negative (\(-0.001\) each). Projects emphasising interoperability and core monetary functionality exhibit better narrative-market correspondence than those with diffuse technical claims. Even so, all effects are an order of magnitude below the moderate-similarity threshold, so this pattern is suggestive at most.
12.3 Theoretical Implications↩︎
Our findings contribute to the growing literature on narrative economics [2] by providing quantitative evidence on the limits of narrative-market coupling in cryptocurrency markets.
Narrative Dissociation Hypothesis. The weak alignment we document is consistent with what we term “narrative dissociation”—an observed weak correspondence between stated project intentions and realised market behaviour. Our limited sample size (\(n = 43\)) provides insufficient power to definitively distinguish weak alignment from no alignment; we can confidently reject strong alignment (\(\phi \geq 0.70\)), but this framing represents a working hypothesis rather than a demonstrated finding. If genuine, narrative dissociation would contrast with efficient market theory, which predicts that informative narratives are rapidly incorporated into prices. The evolving dependency structures in cryptocurrency markets [60] and the documented role of social media in price dynamics [61] suggest narrative-market relationships may be more complex than our static alignment tests capture.
Bounded Rationality in Crypto Markets. The persistence of elaborate whitepaper narratives despite their apparent irrelevance to market outcomes suggests bounded rationality among market participants. Investors may allocate attention to narratives as heuristics, even when such narratives lack predictive power. This parallels findings in behavioural finance on the role of stories in investment decisions [62].
12.4 Further Limitations↩︎
Beyond the three binding limitations in Section 6, several further caveats qualify these findings:
Whitepapers represent static documents that may not reflect current project status. Dynamic narrative analysis (social media, forum posts, governance proposals) may capture narrative evolution.
Our functional taxonomy, while motivated by literature, remains somewhat arbitrary. Alternative taxonomies may reveal alignment in different dimensions.
Two years of data may be insufficient to capture long-term alignment dynamics.
Zero-shot classifiers trained on general-domain NLI corpora exhibit domain shift when applied to specialised cryptocurrency discourse [63]. Crypto-specific terminology (“sharding,” “AMM,” “tokenomics”) may not receive accurate treatment. We interpret this “Semantic Gap” between general-purpose NLP and crypto-native discourse as a substantive measurement challenge: off-the-shelf LLMs should not be deployed for cryptocurrency auditing or regulatory classification without domain adaptation via continued pretraining on cryptocurrency corpora.
Single data provider (Binance) exchange prices may not represent venue-specific microstructure dynamics.
12.5 Summary of Findings↩︎
Our investigation across 43 content-verified whitepapers produced the following key findings:
Claims–Market Non-Detection. The dimension-matched congruence between claims and market statistics (\(\phi = 0.303\)) is weak and non-significant, well below the \(0.65\) threshold; the conservative zero-padded estimator (\(\phi = 0.223\)) is smaller still. We read this as a power-limited non-detection (Section 4.4), not as evidence of no relationship.
Pipeline Liveness (Positive Control). A positive-control simulation recovers injected cross-domain congruence almost exactly (targets \(0.20/0.50/0.80\) recover to \(0.234/0.501/0.806\)), showing the estimator is sensitive where genuine structure exists.
No Stable Entity-Level Heterogeneity. On the content-verified corpus, leave-one-out impacts are uniformly small (\(|\Delta\phi| \leq 0.022\)) with no specialised-versus-infrastructure ordering; an apparent split in an earlier version of the corpus was traced to failed-download stub and wrong-document whitepapers.
Temporal Dynamics. Alignment shows moderate variation across six temporal windows (\(\phi = 0.163 \pm 0.028\)), ranging from \(\phi = 0.113\) to \(\phi = 0.199\).
NLP Validation. Inter-model agreement (BART vs DeBERTa) reaches 68% at relaxed (top-3) threshold, with bootstrap CIs indicating stable category estimates despite 37% exact agreement (\(\kappa = 0.25\)).
12.6 Future Work↩︎
Several extensions could strengthen this work: analysing social media content to capture narrative evolution (dynamic narratives); extending whitepaper analysis to 50+ projects (expanded corpus); fine-tuning transformer models on cryptocurrency text (alternative NLP); examining market reactions to whitepaper updates and narrative pivots (event studies); comparing alignment across blockchain ecosystems (cross-chain analysis); and extending the horizon to 5+ years as data becomes available. The cryptocurrency market remains a fascinating laboratory for studying narrative economics, market microstructure, and the relationship between information and price formation; the simple hypothesis—that projects claiming certain functionality should exhibit market behaviour consistent with those claims—is, at our sample size and instrument reliability, neither confirmed nor refuted.
13 Procrustes Solution Derivation↩︎
Theorem 2. The orthogonal Procrustes problem \[\min_{\mathbf{Q}^\top\mathbf{Q} = \mathbf{I}} \|\mathbf{A}\mathbf{Q} - \mathbf{B}\|_F^2\] has solution \(\mathbf{Q}^* = \mathbf{U}\mathbf{V}^\top\) where \(\mathbf{U}\boldsymbol{\Sigma}\mathbf{V}^\top = \text{SVD}(\mathbf{A}^\top\mathbf{B})\).
Proof. Expanding the objective: \[\begin{align} \|\mathbf{A}\mathbf{Q} - \mathbf{B}\|_F^2 &= \text{tr}[(\mathbf{A}\mathbf{Q} - \mathbf{B})^\top(\mathbf{A}\mathbf{Q} - \mathbf{B})] \\ &= \text{tr}[\mathbf{Q}^\top\mathbf{A}^\top\mathbf{A}\mathbf{Q}] - 2\text{tr}[\mathbf{Q}^\top\mathbf{A}^\top\mathbf{B}] + \text{tr}[\mathbf{B}^\top\mathbf{B}] \end{align}\]
Since \(\mathbf{Q}\) is orthogonal, \(\text{tr}[\mathbf{Q}^\top\mathbf{A}^\top\mathbf{A}\mathbf{Q}] = \text{tr}[\mathbf{A}^\top\mathbf{A}]\) is constant. Thus we maximise: \[\max_{\mathbf{Q}^\top\mathbf{Q} = \mathbf{I}} \text{tr}[\mathbf{Q}^\top\mathbf{A}^\top\mathbf{B}]\]
Let \(\mathbf{A}^\top\mathbf{B} = \mathbf{U}\boldsymbol{\Sigma}\mathbf{V}^\top\). Then: \[\begin{align} \text{tr}[\mathbf{Q}^\top\mathbf{U}\boldsymbol{\Sigma}\mathbf{V}^\top] &= \text{tr}[\mathbf{V}^\top\mathbf{Q}^\top\mathbf{U}\boldsymbol{\Sigma}] = \text{tr}[\mathbf{Z}\boldsymbol{\Sigma}] \end{align}\] where \(\mathbf{Z} = \mathbf{V}^\top\mathbf{Q}^\top\mathbf{U}\) is orthogonal.
By von Neumann’s trace inequality, \(\text{tr}[\mathbf{Z}\boldsymbol{\Sigma}] \leq \sum_i \sigma_i\) with equality when \(\mathbf{Z} = \mathbf{I}\). Setting \(\mathbf{Z} = \mathbf{V}^\top\mathbf{Q}^\top\mathbf{U} = \mathbf{I}\) yields \(\mathbf{Q}^\top = \mathbf{V}\mathbf{U}^\top\), and therefore \(\mathbf{Q}^* = \mathbf{U}\mathbf{V}^\top\). ◻
14 Tucker’s Congruence Properties↩︎
Proposition 1. Tucker’s \(\phi\) has the following properties:
Bounded: \(-1 \leq \phi \leq 1\)
Scale invariant: \(\phi(c\mathbf{x}, \mathbf{y}) = \text{sign}(c) \cdot \phi(\mathbf{x}, \mathbf{y})\)
Not mean-centred (unlike Pearson correlation)
\(\phi = 1\) iff \(\mathbf{x} = c\mathbf{y}\) for \(c > 0\)
15 Full Asset List↩︎
The complete list of 49 cryptocurrency assets in the market-data (tensor) universe is: BTC, ETH, SOL, XMR, ADA, AVAX, DOT, LINK, ATOM, ALGO, FIL, ICP, AAVE, UNI, MKR, COMP, CRV, SNX, YFI, SUSHI, ENS, GRT, LDO, OP, ARB, APT, AXS, BAND, EGLD, ENJ, FTM, GALA, HBAR, IMX, LIT, LPT, MANA, NEAR, OCEAN, POL, RENDER, RPL, SAND, SC, STORJ, SUI, TRB, API3, ZEC. The claims/alignment analysis uses the \(43\)-asset content-verified subset (Table 2); six market-listed assets are retained for tensor decomposition but lack a usable, content-verified whitepaper and are therefore excluded from the alignment tests.
16 Whitepaper Corpus Details↩︎
Table 10 summarises corpus statistics for selected assets; the documents are mostly founding-era, several predating 2018, which bears on the temporal-coverage mismatch discussed in Section 6.
| Asset | Pages | Year | Type |
|---|---|---|---|
| ZEC | 229 | 2020 | Protocol Spec |
| STORJ | 90 | 2018 | Storage WP |
| NEAR | 45 | 2020 | Sharding |
| ICP | 45 | 2021 | Tech Overview |
| LINK | 38 | 2017 | Oracle WP |
| FIL | 36 | 2017 | Tech Report |
| ETH | 36 | 2014 | Original WP |
| ADA | 32 | 2020 | Consensus |
| SOL | 32 | 2018 | Original WP |
| MKR | 21 | 2017 | Stablecoin |
| XMR | 20 | 2013 | CryptoNote |
| + 32 additional documents | |||
Documents were obtained from official project sources, academic repositories (arXiv), and GitHub. Sources include original whitepapers (BTC, ETH, SOL, AVAX), academic papers (ADA, NEAR, GRT from arXiv), protocol specifications (ZEC, LINK), DeFi protocol documentation (AAVE, COMP, MKR, UNI), storage whitepapers (FIL, STORJ, SC, AR), and technical documentation (ICP, ARB, XMR). An earlier version of this corpus contained several contaminated documents—most consequentially a GitHub-fallback retrieval that substituted the Binance Smart Chain whitepaper for Cosmos (ATOM), together with wrong-document files for ADA, NEAR, and GRT and a number of failed-download stub pages masquerading as whitepapers. These were detected by content verification (word-count thresholds and project-name provenance checks against the extracted text, not file metadata) and replaced with the correct official documents prior to the analysis reported here. The 43-asset corpus is content-verified throughout; as Section 6 discusses, the earlier contamination is itself instructive, since it manufactured a spurious cross-sectional “specialised tokens align” result that did not survive correction.
17 Methodological Extensions for Future Work↩︎
Several methodological refinements could strengthen future iterations of this analysis:
Alternative Alignment Measures. The zero-padding approach for dimension-mismatched Procrustes comparison is conservative but nonstandard. Future work should implement: (i) canonical correlation analysis (CCA) to find maximally correlated linear combinations across spaces; (ii) the RV coefficient or HSIC for rotation-invariant dependence measures; (iii) principal angles between subspaces via Grassmannian distance; and (iv) representational similarity analysis (RSA) or Mantel tests common in cross-modal ML.
Taxonomy Validation. The ten-category taxonomy, while grounded in cryptocurrency discourse, would benefit from domain validation through expert labelling or data-driven topic discovery (e.g., BERTopic, LDA). Ablations with alternative taxonomies and finer-grained categories (L1 vs L2, DeFi subcategories, oracle networks) could reveal whether coarser groupings obscure economically salient distinctions.
Enhanced NLP Calibration. Given the modest inter-model agreement (\(\kappa = 0.25\)), future work should include: human adjudication on a labelled subset to calibrate zero-shot accuracy; domain-adapted few-shot prompting with chain-of-thought rationale; and sentence embedding clustering to derive data-driven categories aligned post-hoc to hypothesised domains.
Expanded Market Features. The seven aggregate statistics omit crypto-native fundamentals that may mediate narrative-market links: on-chain activity metrics (active addresses, transaction counts), token supply mechanics (inflation schedules, unlock events), total value locked (TVL) for DeFi protocols, staking yields, and developer activity (GitHub commits, contributor counts). Multi-venue data consolidation could also reduce venue-specific microstructure noise.
Dynamic Narrative Analysis. The temporal mismatch between static whitepapers (often 2017–2020) and the 2023–2024 market window may understate alignment. Rolling-window analysis with contemporaneous narrative sources (governance proposals, blog posts, Discord announcements) could test whether narrative-market coupling strengthens when narratives are temporally matched to market regimes.
18 Per-Category Method Agreement↩︎
Figure 5 visualises pairwise method correlations for each semantic category. While most categories exhibit positive inter-method agreement (\(r = 0.4\)–\(0.86\)), smart_contracts is the weakest (\(\bar{r} = 0.21\)), with the embedding–LLM pair essentially uncorrelated (\(r = -0.03\)), suggesting this category’s linguistic markers are interpreted differently across model architectures. Categories with clearer linguistic anchors (DeFi, oracle, privacy) show strongest convergence.
