Bright blazar flares with CTA
September 18, 2023
1 Introduction↩︎
The current generation of Imaging Atmospheric Cherenkov Telescopes (IACTs), composed of the three arrays MAGIC, H.E.S.S., and VERITAS, has greatly increased our knowledge of the very-high-energy \(\gamma\)-ray (VHE,
energies greater than 100 GeV) sky, bringing the number of known VHE sources from a dozen to about 250, in a bit less than twenty years of data taking [1]. The
extra-galactic component of the VHE sky is dominated by active galactic nuclei (AGN), i.e. accreting super-massive black holes, of the blazar type. Within the unified AGN model, a blazar is a radio-loud AGN whose relativistic jet points in the direction of
the observer. The relativistic boosting of the emission is what makes blazars particularly bright within the AGN population. They are characterized by non-thermal emission over a broad range of wavelengths, from radio up to VHE, a high degree of
polarization in radio, optical, and X-rays, and they exhibit remarkable variability in both brightness (with significant increases spanning orders of magnitude) and time-scales (reaching as short as minute-scale variability). The rapid variability is of
particular interest, because time changes in the emission encode important information about the physical properties of the emitting region, the emission processes at work in it, as well as the acceleration processes that are energizing the particles in
the jet (leptons or hadrons) [2], [3].
The next generation IACT, the Cherenkov Telescope Array, CTA [4], is currently under construction. It will consist of two arrays, one in the Northern Hemisphere, on
the Canary island of La Palma, close to the running MAGIC telescopes, and one in the Southern Hemisphere, at the Paranal Observatory in Chile. In order to maximize the scientific return of the instrument, the CTA Consortium is currently working on
simulations of the expected outcomes of the observations. The work presented in this contribution is part of the preparation for the CTA AGN Key Science Project [4].
What is discussed here represents a part of this larger effort, and focuses on the simulation of future CTA observations of blazar flares, concentrating on the study of rapid variability with a particular emphasis on the capability to reconstruct spectral
variability. A complementary study (shown in these proceedings by [5]) focuses on the long-term variability. The preliminary results of this work
have been presented in [6].
2 Simulations↩︎
The first step of the simulation is to input theoretical models that have been developed to describe data from current observatories. In order to be as general as possible, we do not fit existing data, but we rather produce theoretical models that can
approximately reproduce (in terms of flux and time variability) observed flares. In this contribution, we limit ourselves to two different models that approximately describe the variability observed in the well known VHE blazar Mrk 421. Input models are
provided in the form of time-dependent spectral energy distributions, produced over a broad spectral range, from radio to VHE. The next step is then to simulate CTA observations: this is done using the CTAAGNVAR pipeline1, which is built upon the official CTA high-level analysis tool, Gammapy [7].
CTAAGNVAR reads the theoretical AGN spectrum as input, and produces a simulated CTA observation including realistic observational constraints as outputs. As the zenith angle of the source will vary during an observing period, the software
implements source tracking and selects the appropriate instrumental response functions (IRF). Once the CTA simulated spectra are produced, they are then fitted using phenomenological spectral functions in order of increasing complexity (i.e. a simple
power-law, a log-parabola, a power-law with exponential cut-off; the more complex model is considered only if it improves the fit), as done by observers on real data. Absorption on the extragalactic background light is included when performing the fit. The
best-fit model parameters can then be studied, in order to investigate the capability of CTA to reconstruct the input models and ultimately discriminate among them. In this contribution we focus on specific observational properties: the capability of CTA
to reconstruct spectral variability and hysteresis whenever present in the input model. This is a very important feature, already detected in the X-ray band in blazars, predicted in the VHE band by some of the models, but as yet undetected in the VHE band
[8]. In the following, we show the results from two different theoretical inputs: a single-zone leptonic model in which the acceleration mechanism is not
explicit, and electrons are assumed to be injected with a power-law shape and then cool down as they radiate (in the following, model A)[9]; and a flaring
activity triggered by magnetic reconnection (in the following, model B)[10]. The input models are shown in Figure 1.
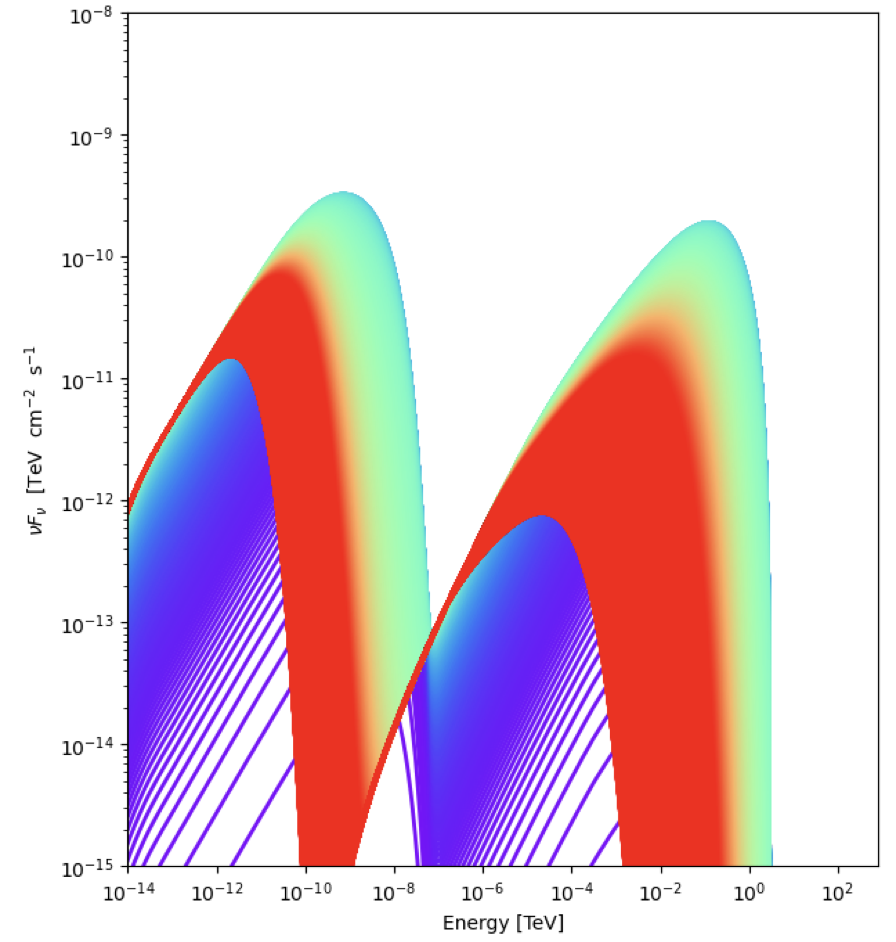
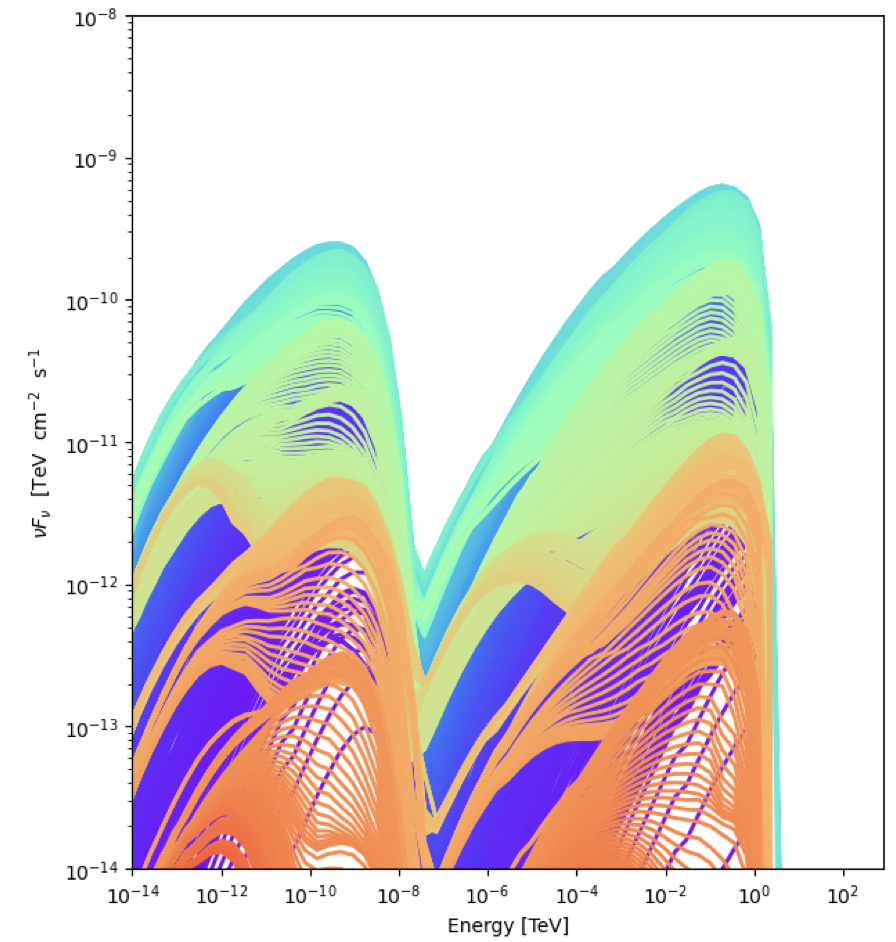
Figure 1: Theoretical SEDs provided as input for the CTA simulations. Left: model A; Right: model B (see text for details). The color code, from violet to red, represents the elapsed time..
3 Results↩︎
The results of the simulations are shown in Figures 2 to 4. In Figure 2 we show simulated CTA light-curves (using the CTA North IRFs) for both models: model A
represents a fast flare happening during a single observing night, while model B covers a larger data set of approximately two weeks, even though during the brightest nights fast intra-night variability can also be observed. In Figure 3 we show the results of a power-law fit to CTA data, plotted as amplitude vs photon index: these simulations indicate that model A has intrinsic spectral variability that can be detected by CTA; on the other hand model B shows
weaker spectral variability in the CTA data. As an alternative to this visualization plot, we also produce two hardness-ratio plots, which is a common display tool in X-ray astronomy: in Figure 4 we show the evolution of the
integral flux as a function of the hardness ratio between a high and low CTA energy band. Here as well we clearly observe the hysteresis cycle in the CTA data for model A.
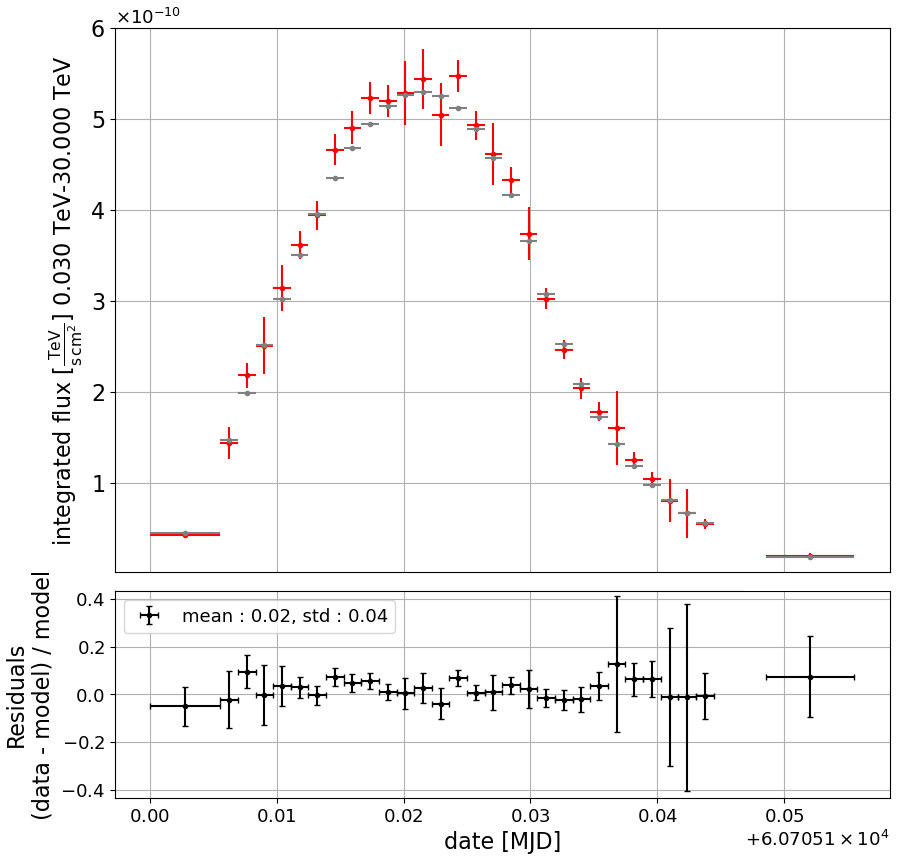
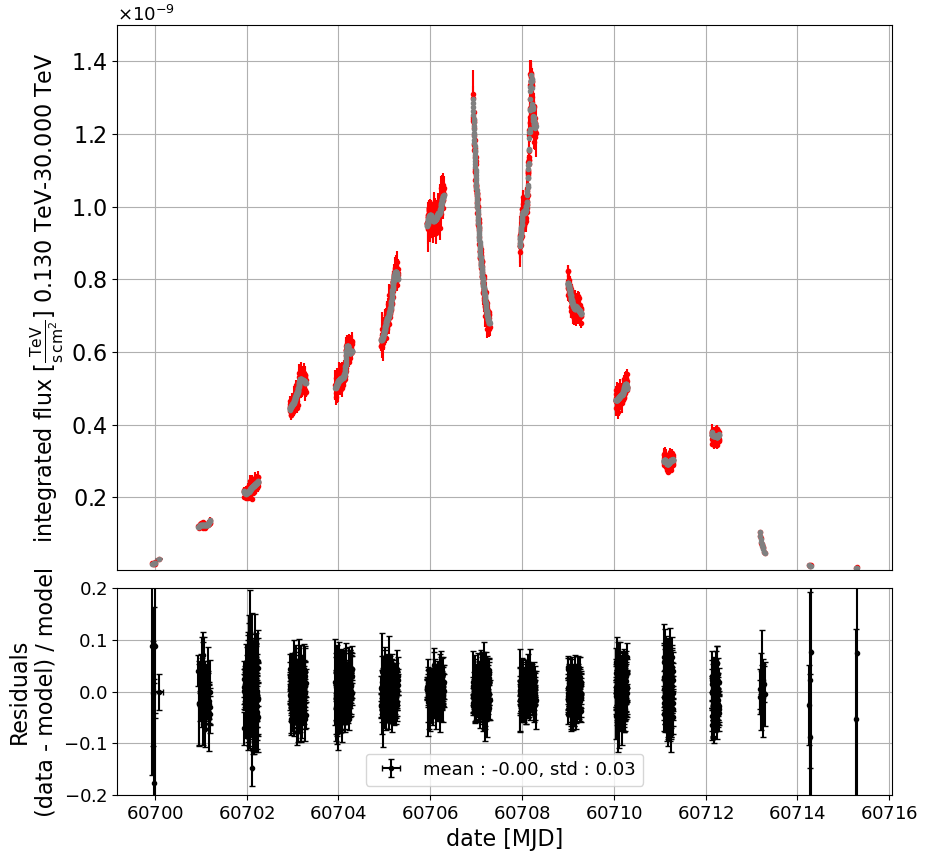
Figure 2: Simulated CTA light-curves, expressed as differential flux . Left: model A; Right: model B (see text for details)..
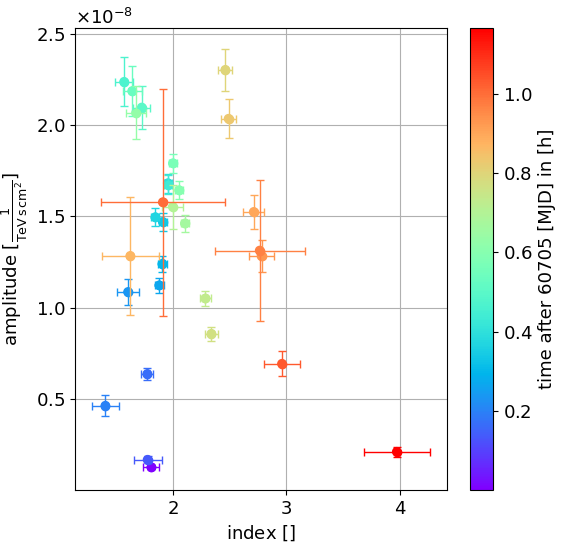
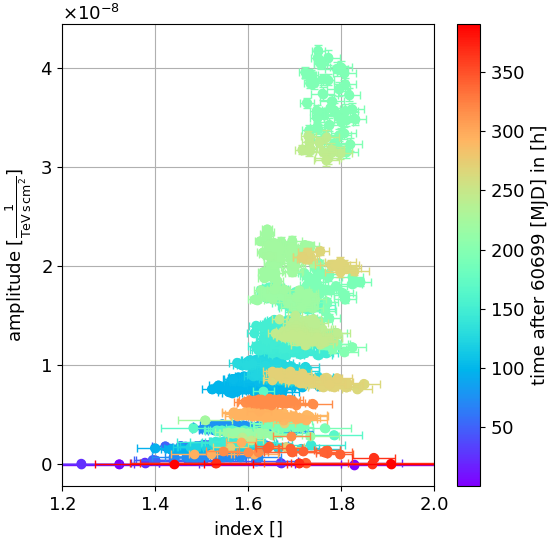
Figure 3: Differential flux versus best-fit power-law index. Left: model A; Right: model B (see text for details)..
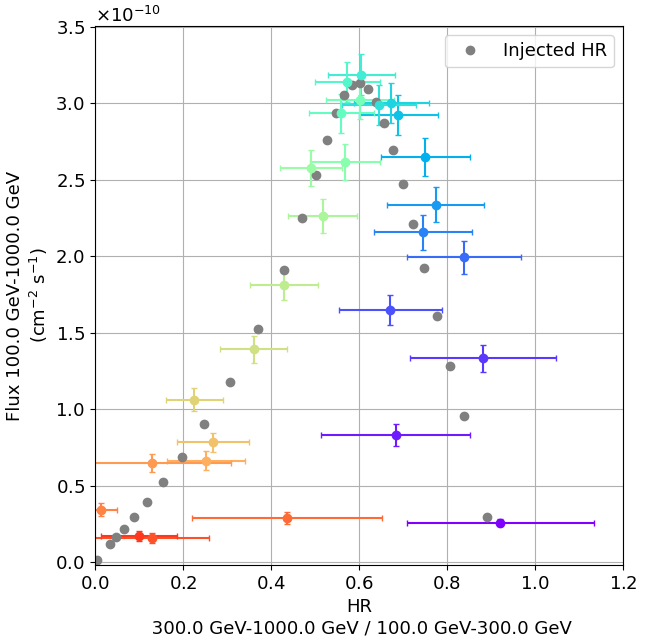
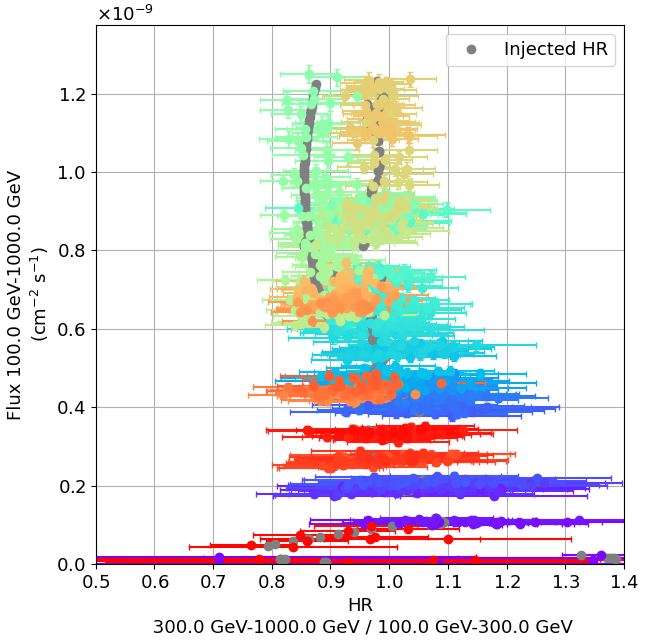
Figure 4: Hardness-ratio plot: flux in the low-energy band vs the hard/soft flux ratio. Left: model A; Right: model B (see text for details)..
4 Conclusions↩︎
CTA will provide unprecedented sensitivity in the VHE band, giving us access to much increased statistical sample on blazar flares compared to current IACTs. In this contribution we have shown two simulated CTA light-curves on bright blazar flares,
taking as input two different state-of-the-art numerical models. The preliminary results indicate that CTA might be able to detect, for the first time, hysteresis cycles in the VHE band, if they are indeed produced by the acceleration and radiative
processes at work in the jet. This will give us a new observable to further constrain theoretical models. The results presented here are a small sub-set of the simulations that we are currently performing.
Acknowledgments↩︎
Please see the full CTA acknowledgments at https://www.cta-observatory.org/consortium_acknowledgments/